This is a repository copy of
Depth-Based Complexity Traces of Hypergraphs from Directed
Line Graphs
.
White Rose Research Online URL for this paper:
http://eprints.whiterose.ac.uk/79595/
Version: Submitted Version
Proceedings Paper:
Bai, Lu, Ren, Peng, Escolano, Francisco et al. (1 more author) (2014) Depth-Based
Complexity Traces of Hypergraphs from Directed Line Graphs. In: Proceedings of the 22nd
International Conference on Pattern Recognition. 22nd International Conference on
Pattern Recognition, 24-28 Aug 2014 IEEE Computer Society Press .
[email protected] https://eprints.whiterose.ac.uk/
Reuse
Items deposited in White Rose Research Online are protected by copyright, with all rights reserved unless indicated otherwise. They may be downloaded and/or printed for private study, or other acts as permitted by national copyright laws. The publisher or other rights holders may allow further reproduction and re-use of the full text version. This is indicated by the licence information on the White Rose Research Online record for the item.
Takedown
If you consider content in White Rose Research Online to be in breach of UK law, please notify us by
Directed Depth-Based Complexity Traces of
Hypergraphs from Directed Line Graphs
Lu Bai and Edwin R. Hancock
Department of Computer Science University of York
York, YO10 5DD, United Kingdom
Peng Ren
College of Information and Control Engineering China University of Petroleum (Huadong)
Shandong Province, Qingdao, P.R. China
Francisco Escolano
Department of Computer Science and Artificial Intelligence University of Alicante, Spain
Abstract—In this paper, we aim to characterize hypergraphs in terms of structural complexities. To measure the complexity of a hypergraph in a straightforward way, we transform a hypergraph into a line graph which accurately reflects the multiple relationships exhibited by the hypergraph. To locate the dominant substructure within a line graph, we identify a centroid vertex by computing the minimum variance of its shortest path lengths. A family of directed centroid expansion subgraphs of the line graph is then derived from the centroid vertex. We compute the directed depth-based complexity trace of a hypergraph by measuring directed entropies on its directed subgraphs. The novel hypergraph complexity trace provides a flexible framework that can be applied to both hypergraphs and graphs. Experiments on standard (hyper)graph datasets demonstrate the effectiveness and efficiency of the new complexity trace.
I. INTRODUCTION
There has recently been an increasing interest in the use of hypergraph models for higher order learning. A hypergraph is a generalization of a graph. Unlike the pairwise nature of edges in a graph, hypergraph representations allow a hyperedge to encompass an arbitrary number of vertices, and can hence cap-ture multiple relationships among feacap-tures. To exploit existing graph based methods for learning higher order models, Agar-wal et al. [1] have performed hypergraph clustering by parti-tioning a weighted graph obtained by transforming the original hypergraph using a weighted sum of hyperedges to form edges. Wachman et al. [2] have developed a hypergraph kernel by enumerating similar walks on two hypergraphs. Zass et al.[3] and Duchenne et al.[4] have separately applied high-degree affinity arrays (i.e. tensors) to formulate hypergraph matching problems using different cost functions. Both methods address the matching process in an algebraic manner but become intractable to compute if the hyperedges are not suitably sam-pled. Shashua et al. [5], [6] have performed visual clustering using tensors to represent uniform hypergraphs (i.e. those for which the hyperedges have identical cardinality) extracted from images and videos. Their work has been complemented by He et al.’s [7] algorithm for detecting number of clusters in a tensor-based framework. Similar methods include those described in [8], [9], [10], [11], [12], in which tensors (uniform hypergraphs) are used to represent the multiple relationships between objects. One limitation of most existing methods for hypergraph characterization is that they are usually restricted to uniform structures and cannot be applied to hypergraphs with arbitrary relational orders. To address this shortcoming, Ren et al. [13] have exploited a set of polynomial coefficients obtained from the hypergraph Ihara zeta function for characterizing
nonuniform hypergraphs. Unfortunately, the computation of the hypergraph Ihara coefficients tends to be computational burdensome.
To overcome the limitations of existing methods for hy-pergraph analysis, we present a novel framework for charac-terizing hypergraphs based on computing complexity traces as a function of depth. This is effected by constructing a depth-based representation of a hypergraph obtained from its directed line graph. Depth-based representations of undirected graph structures are powerful tools of characterizing their topological structures [14], [15]. One approach is to gauge the information content flow through a family of K layer expansion subgraphs of a graph, these increasing K layer subgraphs can be located around a vertex having a maximum topology distance K. By measuring the heat flow complexity of each subgraph, Escolano et al. [15] have shown how to use this approach to characterize each casual trajectory of a graph leading a vertex to the graph by using the minimal enclosing Bregman balls (MEBBs). Then the thermodynamic based depth complexity of such a graph relies on the variability of the different trajectories from each vertex to the graph. Unfortunately, this method establishes expansion subgraphs around each vertex and then measures the inefficient intrinsic complexity measure on each subgraph. As a result, the thermodynamic based depth complexity measure can not be efficiently computed. To overcome this shortcoming, Bai and Hancock [16], [17], [18] have developed a fast depth-based complexity trace for a graph. They decompose a graph into a family of centroid expansion subgraphs around a centroid vertex having a shortest path length K, the resulting complexity trace is computed by measuring entropies on the expansion subgraphs. Since the depth-based complexity traces can efficiently compute the entropy based complexity measures on a small set of expansion subgraphs rooted at the centroid vertex, this method can be computed in polynomial time.
convenient framework for complexity analysis.
We develop a new directed depth-based complexity trace for hypergraphs. For a hypergraph, we commence by trans-forming the hypergraph into a directed line graph. We establish a family of directed expansion subgraphs around a centroid vertex derived from the directed line graph. The directed complexity trace of the hypergraph is computed by measuring the directed von Neumann entropy on the family of directed expansion subgraphs. Our new hypergraph complexity trace method provides a flexible framework that can be applied to both hypergraphs and graphs. We perform experiments on sev-eral bioinformatics and computer vision datasets. We empiri-cally demonstrate that our hypergraph complexity trace method not only readily accommodates nonuniform hypergraphs but also easily scales to large hypergraphs. The performance of our framework is competitive with complexity based graph methods and other hypergraph based methods in the literature.
II. DIRECTEDLINEGRAPHS
A hypergraph is usually denoted by a pair set
HG(VH, EH) where VH is a set of vertices and EH is a set of non-empty subsets ofVH called hyperedges. To obtain the complexity traces of a hypergraph, we first describe how to establish a directed line graph for a hypergraph using the Perron-Frobenius operator [19], [13]. The reasons for using this graph representation for a hypergraph are twofold. First, pairwise-order representations for hypergraphs enable the graph based complexity analysis to be applied to hypergraphs. Second, the directed line graph avoids the order ambiguities that arises from the straightforward expansion-based or clique-based graph representations of a hypergraph [13].
Furthermore, we also give the definition of measuring the von Neumann entropy on directed (sub)graphs.
A. Directed Line Graph
The clique expansion graphGH(VG, EG)for a hypergraph
HG(VH, EH) can be obtained by connecting each pair of vertices in ei through an edge for each hyperedgeei ∈ EH, and the vertex and edge sets are
VG=VH;
EG={(u, v)⊂ei |ei∈EH}. (1)
It is important to stress that there are potential multiple edges between two vertices in GH(VG, EG) if the two vertices are encompassed by more than one common hyperedge in
HG(VH, EH). Suppose there arephyperedges encompassing two vertices in HG(VH, EH). The p hyperedges induce p edges separately between the two vertices inGH(VG, EG).
For GH(VG, EG), the associated symmetric digraph
DGH(VG, Ed) can be obtained by replacing each edge of
GH(VG, EG)by a directed edge pair in which the two directed edge are inverse to each other. Finally, the directed line graphGD(VD,
− →
ED)of the hypergraph HG(VH, EH) can be established based on the symmetric digraph DGH(VG, Ed). The vertex setVDand edge set
− →
ED of the directed line graph
GD(VD,
− →
ED)are defined as
V
D=Ed;
− →
ED={(u, v)i,(v, w)j ∈Ed×Ed | i6=j}. (2)
where the subscripts i and j denote the indices of the hy-peredges from which the directed edges (u, v) and (v, w) are induced respectively. It is important to stress that unlike the edge set E of an undirect graph G(V, E), −→ED is a set of directed edges of the directed graph GD(VD,
− →
ED). The adjacency matrix TH of GD(VD,
− →
ED) is the Perron-Frobenius operator of the original hypergraph. For the(i, j)th entry ofTH, TH(i, j)is 1 if there is one edge directed from the vertex i to the vertex j in the directed line graph, and otherwise it is 0. Unlike the adjacency matrix of an undirected graph, the Perron-Frobenius operator for a hypergraph is not a symmetric matrix. This is because the constraint in Eq.(2) arises in the construction of directed edges. Specifically, any two directed edges induced by the same hyperedge in the original hypergraph are not allowed to establish a directed edge in the directed line graph.
B. Theoretical Properties
Based on [13], [20], the directed line graph and its Perron-Frobenius operator for a hypergraph have several interesting properties. These properties include: a) the directed line graph accurately captures the multiple relationships with arbitrary relational orders such that it can be used to characterize either uniform or nonuniform hypergraphs, b) comparing to the (hyper)graph adjacency or Laplacian matrix, the Perron-Frobenius operator spans a higher dimensional feature space where it may expose richer (hyper)graph characteristics, and c) the directed line graph represents a (hyper)graph in a complete manner such that it naturally avoids the information loss arising in the spectral truncation [9] or the clique graph approximation [21]. As a result, the direct line graph and its Perron-Frobenius operator can offer us an elegant way for hypergraph complexity analysis which can not only capture precise hypergraph complexity information but can also reflect richer characteristics of hypergraphs.
Time Complexity: The transformation from the hypergraph
HG(VH, EH) into the directed line graph GD(VD,
− →
ED) re-quires O(|VD|2) operations, because it relies on the |Ed| edges of DGH(VG, Ed) and needs to establish the |VD|2 (|VD| = |Ed|) pairs of entries in the adjacency matrix of
GD(VD,
− →
ED). 2
C. Von Neumann Entropy of Directed Graphs
In our study, we require an entropy measure on directed (sub)graphs. We consider to use the approximated directed von Neumann entropy defined in our previous work [22]. Suppose
GD(VD,
− →
ED)is a directed graph with vertex setVDand edge set−→ED ⊆VD×VD, then the structure of this graph can be represented by a |VD| × |VD| adjacency matrix A as follows (where |V|is the number of vertices in the graph)
AD(i, j) =
1 if(i, j)∈−→ED
0 otherwise. (3)
The in-degree and out-degree of vertexvD;i are
din(i) = |VD|
X
j=1
AD(j, i), dout(j) = |VD|
X
j=1
We can approximate the von Neumann entropy of a directed graph (a strongly directed graph) in terms of the in-degree and out-degree of the vertices as
HV NSD = 1− 1
|VD|
− 1
2|VD|2
X
(vD;i,vD;j)∈ED
1
dout(i)din(j)
.
(5)
The approximated directed von Neumann entropy HSD V N contains two terms. The first is the graph size while the second one depends on the in-degree and out-degree statistics of each pair of vertices linked by an edge. Moreover, the computational complexity of these expressions is quadratic in the graph size.
Time Complexity:For the directed graphGD(VD, ED), com-puting the directed von Neumann entropyHSD
V N(GD)requires
O(|VD| 2
) operations, because it needs to visit all the |VD| 2
pairs of entries inADto compute the in-degree and out-degree
of each vertex. 2
III. CENTROIDEXPANSIONSUBGRAPHS
In this section, we give the definition of computing the hypergraph depth-based complexity traces from the directed line graphs. We commence by introducing the directed centroid expansion subgraphs of a hypergraph. Then we develop a di-rected hypergraph depth-based complexity trace by measuring how the directed von Neumann entropies vary on the directed subgraphs.
A. Directed Subgraphs from the Centroid Vertex
To compute a depth-based complexity trace for a hyper-graph, we require a family of subgraphs of increasing layer size on its directed line graph. To locate the dominant subgraphs within the directed line graph, we propose to identify a centroid vertex which has the minimum shortest path length variance to the remaining vertex. Around the centroid vertex, we derive a family of directed centroid expansion subgraphs each of which has an increasing maximum shortest path length K from the centroid vertex. Unfortunately, straightforwardly identifying the centroid vertex and establishing the expansion subgraphs based the shortest paths on a directed line graph tends to ignore certain topological information, because a path may not exist between two vertices in a connected directed line graph. To overcome this problem, we identify the centroid vertex and establish the directed centroid expansion subgraphs through the undirected line graph of a hypergraph. The undirected line graph GU L(VU L, EU L) of a hypergraph HG(VH, EH) can be obtained through replacing each pair of inversely directed edges in its directed line graphGDL(VDL,
− →
EDL)by an undirected edge.
For the undirected line graph GU L(VU L, EU L) of a hy-pergraph HG(VH, EH), we commence by computing its shortest path matrix SGU L using the Dijkstra algorithm. The
mean vector VM for GU L(VU L, EU L)is a vector having the same vertex order as SGU L, and each element VM(i) =
P|VU L|
j=1 SGU L(i, j)/|VU L|represents the average shortest path
from vertexvi to the remaining vertices. The centroid vertex
vi for GU L(VU L, EU L)is identified as follows
ˆ
vi= arg min i
|VU L|
X
j=1
[SGU L(i, j)−VM(i)]
2.
(6)
LetNK ˆ
vC be a subset ofVU L satisfying
NK ˆ
vC ={u∈VU L |SGU L(ˆvC, u)≤K}. (7)
For the hypergraphHG(VH, EH)with the centroid vertexˆvC on its undirected line graph GU L(VU L, EU L), the K-layer directed centroid expansion subgraph GDK(VDK;
− →
EDK) on its directed line graph GDL(VDL,
− →
EDL) has the vertex set
VK and edge setEK as follows
V
DK ={u∈NvKC};
−→
EDK ={(u, v)∈
− →
EDL |{(u, v)⊂NvKC |(u, v)∈EU L}}.
(8) Note that there is a strict order for any pair of vertices(u, v)∈ −→
EDK. The number of directed centroid expansion subgraphs is equal to the greatest length of the shortest path from the centroid vertex to the remaining vertices of the undirected line graphGU L(VU L, EU L).
B. The Directed Complexity Trace of A Hypergraph
Definition 3.1 (Directed complexity trace)For a hypergraph
HG(VH, EH) and its directed line graph GDL(VDL,
− →
EDL) and undirected line graphGU L(VU L, EU L), the directed com-plexity traceCTD is an Lmax dimensional vector defined as
CTD= [HD(GD1),· · · , HD(GDK),· · ·, HD(GDLmax)] T
.
(9) where Lmax is the greatest length of the shortest paths from the centroid vertex vˆC to the remaining vertices in
GU L(VU L, EU L), GDK is the K-layer directed centroid ex-pansion subgraph ofGDL(VDL,
− →
EDL), andHD(GDK)is the entropy of the directed subgraph GDK. We use the directed von Neumann entropy defined in Eq.(5) in our study. 2
Note that, the Lmax-layer directed centroid expansion subgraph is the directed line graph itself, and the dimension of a hypergraph complexity trace vector is thus equal to the greatest layer Lmax. However, the complexity trace vectors for hypergraphs of different sizes may exhibit various lengths. To compare these hypergraphs by using complexity trace vectors, we need to make the vector lengths uniform. This is achieved by padding out the dimensions of the complexity trace vectors. Hence, for complexity trace vectors CTD
a and
CTD
b of two hypergraphsHGa andHGb with dimensions p andqrespectively, wherep > q, we use theq-th element value of CTb as the added padding value for the extendedq+ 1-th top-th elements ofCTb.
C. Discussions of the Complexity Trace
The proposed complexity traces for (hyper)graphs focus on measuring how the entropy based complexities of their sub-graphs from the line sub-graphs (i.e. sub-graphs transformed from the original (hyper)graphs) vary with increasing layer size. Such complexity traces reflect high dimensional depth-based complexity characteristics of (hyper)graphs and can be used for (hyper)graph clustering or classification. By contrast, the depth-based complexity measure in [15], the Shannon entropy measures in [23] and the von-Neumann entropy measure in [24] are based on the global structure of the original graph, and only provide an uni-dimensional complexity characterization.
D. Analysis of Computational Complexity
Suppose the directed line graphGDL(VDL,
− →
EDL) extract-ed from HG(VH, EH) has n vertices. The computational complexity for constructing the directed complexity trace for
HG(VH, EH) are governed by the following processes. 1) The construction of the directed centroid expansion subgraphs which involves using Dijkstra algorithm to compute the short-est path matrix to locate the centroid vertex and implementing the transformation from the hypergraph HG(VH, EH) into the line graph. Dijkstra algorithm takes time O(n2). The transformation to the line graph has time complexity O(n2). As a result the construction of the representation requires time complexity O(n2). 2) The computation of the directed von Neumann entropies for the directed centroid expansion subgraphs from GDL(VDL,
− →
EDL). These entropies require time complexity O(n2Lmax)
. As a result, computing the directed complexity trace for the hypergraph HG(VH, EH) requires time complexitiesO(n2Lmax)
.
IV. EXPERIMENTALEVALUATIONS
We demonstrate the performance of our new directed complexity trace method on three standard graph datasets abstracted from bioinformatics databases. These datasets are: MUTAG, CATH1 and CATH2. The MUTAG dataset consists of graphs representing 188 chemical compounds. The maxi-mum, minimum and average number of vertices are 28, 10 and 17.93 respectively. The CATH1 dataset consists of proteins in the same class (i.e Mixed Alpha-Beta), but the proteins having different architectures (i.e. Alpha-Beta Barrel vs. 2 -layer Sandwich). CATH2 has proteins in the same class (i.e. Mixed Alpha-Beta), architecture (i.e. Alpha-Beta Barrel), and topology (i.e. TIM Barrel), but in different homology classes (i.e. Aldolase vs. Glycosidases). The CATH2 dataset is harder to classify, since proteins in the same topology class are structurally similar. The protein graphs are10 times larger in size than chemical compounds, with200−300vertices. There are 712 and 190 testing graphs in the CATH1 and CATH2 datasets. The maximum, minimum and average number of vertices are 568, 44 and 205.70 respectively (for CATH1), and 568, 143 and 308.03 respectively (for CATH2). Beside the graph datasets, we also test our proposed complexity trace on a hypergraph dataset abstracted from the COIL image database. The hypergraph dataset consists of 162 hypergraphs extracted from 162 images separately in the COIL image database. The COIL image database consists of images of 100 objects. In our experiments, we use selected images for three similar cups, three similar bottles and three similar pieces of vegetable. For each object we employ 18 images captured from different
ð ð ð∫
ð∫ ð∫ ð∫ ð∫
∏⌠×↵♣≈→ ±≡ …•→≈←≈… ≈″←→±•… ≈♦°↵″↑•±″ ↑↔≠→↵°÷↑
≈↵
″
⇔
″
←→
±
°
♣
♠
↵
×↔
≈
⇐•→≈←≈… ¬♣°≈→≠→↵°÷ ⇑±≥°×≈♦•←♣ ⊂→↵≈↑
ð ð ð ð ð
ð∫ð ð∫ ð∫ ð∫ ð∫ ð∫ ð∫ ð∫
¬♣°≈→≠→↵°÷ ⇔…•← ∇°≈→↵←•±″
⇔
↔
ו…
≈↵
″
⇐
•↑
←↵
″
[image:5.595.319.548.54.143.2]≈
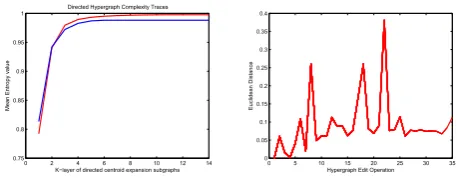
Fig. 1. Evaluation of Interior Complexity Traces and Stability.
viewpoints. Then the hypergraphs are extracted from each of these images using the feature hypergraph method [13]. The maximum, minimum and average number of vertices of the (hyper)graphs in the four (hyper)graph datasets are 28 (max), 10 (min) and 17.93 (ave) for MUTAG, 232 (max), 3 (min) and 109.60 (ave) for PPIs, 126 (max), 2 (min) and 32.63 (ave) for ENZYMES, and 549 (max), 213 (min) and 412.50 (ave) for the hypergraph dataset.
A. Evaluation of Interior Complexity Traces
We commence by illustrating the representational power of the proposed directed complexity traces of hypergraphs. We demonstrate that these can be used to distinguish hypergraphs. The evaluation utilizes 36 hypergraphs abstracted separately from the images of a box and a cup in the COIL image database. For each object we use 18 images captured from different viewpoints. The hypergraphs for individual images are established by using the feature hypergraph method. For each hypergraph, we construct the proposed complexity trace. Fig.1 (a) shows the mean values of the directed complexity traces using the directed von Neumann entropy. In Fig.1 (a) the x-axis represents the order of the K-layer directed centroid expansion subgraph for each hypergraph, while the y-axis represents the mean entropy value as a function of the expansion subgraph order. Here the blue and red lines represent the mean entropy values of complexity traces for the hypergraphs abstracted from the box and cup objects respectively. The main feature to note is that the mean entropy values of the complexity traces from the different objects are quite dissimilar.
B. Stability Evaluation
To evaluate the stability of our directed complexity trace method, we explore the relationship between the hypergraph edit distance and the feature distance resulting from our complexity trace vectors for hypergraphs. The evaluation u-tilizes one randomly generated seed hypergraphs. The seed hypergraph has 400 vertices. For the seed hypergraph, we apply random edit operations to simulate the effects of noise by deleting a fraction of vertices. The feature distance of the original seed hypergraph HGS and its edit operated noise corrupted counterpart HGE is defined as their Euclidean distance
dS,E=
q
(CTS−CTE)T(CTS−CTE), (10)
whereCTS andCTE are the complexity traces of HGS and
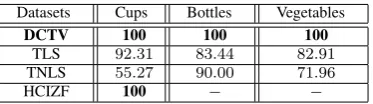
TABLE I. CLASSIFICATIONACCURACYCOMPARISONS ON
HYPERGRAPHS(IN%)
Datasets Cups Bottles Vegetables
DCTV 100 100 100
TLS 92.31 83.44 82.91
TNLS 55.27 90.00 71.96
HCIZF 100 − −
vertices randomly deleted (from1% to 35%), and the y-axis represents the value of the Euclidean distance dS,E between the original seed hypergraph HGS and its noise corrupted counterpartHGE. It is clear that the fluctuation is small. This implies that the proposed complexity trace method is robust even when the seed hypergraphs and their centroid vertices undergo relatively large perturbations.
C. Experiments on Image Hypergraphs
Experimental setup:We illustrate the performance of our directed complexity trace method on a hypergraph classifica-tion problem. The hypergraph dataset for testing is abstracted from the COIL image database. We also compare our method with several alternative state of the art hypergraph based learn-ing methods. These methods include 1) the Ihara coefficients for hypergraphs (HCIZF) [13], 2) the truncated Laplacian spec-tra (TLS) and truncated normalized Laplacian specspec-tra (TNLS) [21]. We compute the feature vectors of testing hypergraphs using our method and the alternatives respectively. With these feature vectors, we then perform 10-fold cross-validation using the Support Vector Machine (SVM) Classification associated with the Sequential Minimal Optimization (SMO) [25] and the Pearson VII universal kernel (PUK) [26] to compute the classification accuracies of our method and the alternative methods. We use nine samples for training and one for testing. All the SMO-SVMs and their parameters were performed and optimized on a Weka workbench [26]. We repeat the whole experiments 10 times. We report the average classification accuracy in Table 1.
Experimental Results and Evaluations: From Table.1 it is clear that our method achieves the greatest accuracies over all image datasets. 1) Our method outperforms TLS and TNLS which use spectral information for hypergraphs. The reason for this is that our method based on the line graph of a (hyper)graph captures richer (hyper)graph char-acteristics than the (hyper)graph spectral representations and also avoids the spectral truncation arising in TLS and TNLS.
2) For the hypergraphs extracted from the images of the cup object, the maximum and minimum number of vertices are 310 and 213 respectively. Here the accuracy of HCIZF is competitive with that of our method. Like our method, HCIZF also relies on directed line graphs, and exploits richer (hyper)graph characteristics. However, for the hypergraphs extracted from the images of the bottle and vegetable objects, where the maximum and minimum number of vertices are 549 and 305 respectively, HCIZF is intractable for characterizing the hypergraph structures. The reason for this is that the computation of the underlying Ihara coefficients tends to result in infinities even for hypergraphs of moderate sizes. In contrast, our directed complexity trace method can easily scale to these large hypergraphs.
D. Experiments on Graphs
Experimental setup:We evaluate the performance of our method on a graph classification problem. The graph datasets for testing are abstracted from bioinformatics databases. We also compare our method with alternative state of the art graph based learning methods. The comparative methods include 1) the Weisfeiler-Lehman subtree kernel (WL) [27], 2) the von-Neumann thermodynamic depth complexity (VNTD) [15], 3) the von-Neumann graph entropy (VNGE) [24], 4) the Shannon entropies associated with the information functionals
fV
(FV) and fP
(FP) [23], and 5) the Ihara coefficients for graphs (GCIZF) [13]. For the Weisfeiler-Lehman subtree kernel we compute the kernel matrix of each dataset, we perform the kernel Principle Component Analysis (kPCA) on the kernel matrix to embed graphs into a feature space as vectors. For other methods, we calculate the feature vectors or feature values of testing graphs. With these feature vectors or feature values, we also perform 10-fold cross-validation using the SMO-SVMs described in Section IV-C to compute the classification accuracies of our method and the alternative methods. We repeat the whole experiments10times. We report the average classification accuracies for each method in Table 2. We also report the runtime to establish graph feature vectors or feature values of each method in Table 2 under Matlab R2011a running on an Intel(T7500) 2.2GHz 2-Core processor.
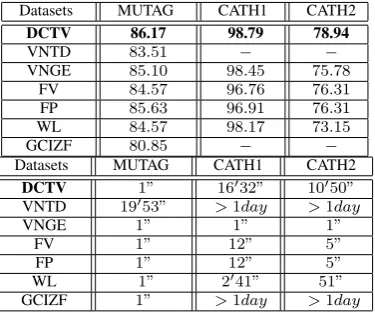
Experimental Results and Evaluations: 1) Clearly, our method outperforms all the alternative methods. Key to the effectiveness of our method is that our directed complexity trace method probes a graph from its line graph which can reflect richer graph characteristics in a higher dimensional feature space, and generates a multi-dimensional complexity characterization from the substructure complexities of the line graph. On the other hand, the alternative methods are based on the original graph. In particular, the entropy based complexity measures (i.e. VNGE, FV and FP) are just computed based on the global structure of the original graph, and only provide an uni-dimensional complexity characterisation. 2) Although GCIZF is also based on a line graph representation, it is outperformed by our directed complexity trace method on each of the datasets studied. This is because the directed centroid ex-pansion subgraphs allow our method to capture a depth-based information that GCIZF cannot convey. Moreover, similar to the HCIZF, GCIZF is also intractable for characterizing the large graph structures.3) The runtime of our complexity trace method is clearly faster than that of the alternative depth-based complexity method VNTD. It is also competitive with GCIZF, the fast subtree kernel WL and the fast entropy measures VNGE, FV and FP. The reason for this efficiency is that the required graph entropies in our method can be computed in polynomial time.
V. CONCLUSION
TABLE II. CLASSIFICATIONACCURACYCOMPARISONS ONGRAPHS
(IN%)
Datasets MUTAG CATH1 CATH2
DCTV 86.17 98.79 78.94
VNTD 83.51 − −
VNGE 85.10 98.45 75.78
FV 84.57 96.76 76.31
FP 85.63 96.91 76.31
WL 84.57 98.17 73.15
GCIZF 80.85 − −
Datasets MUTAG CATH1 CATH2
DCTV 1” 16′32” 10′50”
VNTD 19′53” >1day >1day
VNGE 1” 1” 1”
FV 1” 12” 5”
FP 1” 12” 5”
WL 1” 2′41” 51”
GCIZF 1” >1day >1day
increasing layer size. The complexity trace of a hypergraph has been constructed by measuring how the required entropies of these subgraphs vary with increasing layer size. Experiments demonstrate the effectiveness and efficiency of our method.
Our future work is to develop a new hypergraph kernel by using the depth-based hypergraph complexity traces. In [16], we have developed a framework of computing depth-based complexity traces for graphs. In [28], we have developed a family of Shannon kernels for graphs using the Jensen-Shannon divergence. By computing the Jensen-Jensen-Shannon di-vergence between the depth-based complexity traces for a pair of graphs, we have shown how a fast Jensen-Shannon subgraph kernel for the graphs can be computed [29]. It would be interesting to develop a new hypergraph kernel by computing the Jensen-Shannon divergence between the hypergraph complexity traces for a pair of hypergraphs.
Acknowledgments
Edwin R. Hancock is supported by a Royal Society Wolf-son Research Merit Award.
Peng Ren was supported by the NSFC project (No. 61105005) and Qingdao Fundamental Research Project (No. 13-1-4-256-jch).
REFERENCES
[1] S. Agarwal, J. Lim, L. Zelnik-Manor, P. Perona, D. Kriegman, and
S. Belongie, “Beyond pairwise clustering,” inCVPR, 2005, pp. 838–
845.
[2] G. Wachman and R. Khardon, “Learning from interpretations: a rooted
kernel for ordered hypergraphs,” inICML, 2007, pp. 943–950.
[3] R. Zass and A. Shashua, “Probabilistic graph and hypergraph matching,”
inCVPR, 2008, pp. 1–8.
[4] O. Duchenne, F. Bach, I. Kweon, and J. Ponce, “A tensor-based
algorithm for high-order graph matching,” inCVPR, 2009, pp. 1980–
1987.
[5] A. Shashua, R. Zass, and T. Hazan, “Multi-way clustering using
super-symmetric non-negative tensor factorization,” inECCV, 2006, pp. 595–
608.
[6] A. Shashua and A. Levin, “Linear image coding for regression and
classification using the tensor-rank principle,” inCVPR, 2001, pp. 623–
630.
[7] Z. He, A. Cichocki, S. Xie, and K. Choi, “Detecting the number
of clusters in n-way probabilistic clustering,” IEEE Transactions on
Pattern Analysis and Machine Intelligence, vol. 32, pp. 2006–2012, 2010.
[8] V. Govindu, “A tensor decomposition for geometric grouping and
segmentation,” inCVPR, 2005, pp. 1150–1157.
[9] G. Chen and G. Lerman, “Spectral curvature clustering,”International
Journal of Computer Vision, vol. 81, pp. 317–330, 2009.
[10] ——, “Foundations of a multi-way spectral clustering framework for
hybrid linear modeling,” Journal of Foundations of Computational
Mathematics, vol. 9, pp. 517–558, 2009.
[11] G. Chen, S. Atev, and G. Lerman, “Kernel spectral curvature clustering,”
inICCV Workshop on Dynamical Vision, 2009, pp. 317–330.
[12] S. Bulo and M. Pelillo, “A game-theoretic approach to hypergraph
clustering,” inNIPS, 2009, pp. 1571–1579.
[13] P. Ren, T. Aleksic, R. Wilson, and E. Hancock, “A polynomial
char-acterization of hypergraphs using the ihara zeta function,” Pattern
Recognition, vol. 44, pp. 1941–1957, 2011.
[14] J. Crutchfield and C. Shalizi, “Thermodynamic depth of causal states:
Objective complexity via minimal representations,”Physical Review E,
vol. 59, p. 275283, 1999.
[15] F. Escolano, E. Hancock, and M. Lozano, “Heat diffusion:
Thermody-namic depth complexity of networks,”Physical Review E, vol. 85, p.
036206, 2012.
[16] L. Bai and E. Hancock, “Depth-based complexity traces of graphs,”
Pattern Recognition, vol. 47, no. 3, pp. 1172–1186, 2014.
[17] L. Bai, E. R. Hancock, L. Han, and P. Ren, “Graph clustering using
graph entropy complexity traces,” inICPR, 2012, pp. 2881–2884.
[18] L. Bai and E. R. Hancock, “Graph complexity from the jensen-shannon
divergence,” inSSPR/SPR, 2012, pp. 79–88.
[19] C. Storm, “The zeta function of a hypergraph,”Electronic Journal of
Combinatorics, vol. 13, pp. 1–26, 2006.
[20] H. Bass, “The ihara-selberg zeta function of a tree lattice,”Int’l J. Math.,
vol. 6, pp. 717–797, 1992.
[21] D. Zhou, J. Huang, and B. Sch¨olkopf, “Learning with hypergraphs:
clustering, classification, and embedding,” inNIPS, 2007, pp. 1601–
1608.
[22] C. Ye, R. C. Wilson, C. H. Comin, L. da F. Costa, and E. R. Hancock,
“Entropy and heterogeneity measures for directed graphs,” inSIMBAD,
2013, pp. 219–234.
[23] M. Dehmer and A. Mowshowitz, “A history of graph entropy measures,”
Information Sciences, vol. 181, pp. 57–78, 2011.
[24] L. Han, F. Escolano, E. Hancock, and R. Wilson, “Graph
characteriza-tions from von neumann entropy,”Pattern Recognition Letters, vol. 33,
pp. 1958–1967, 2012.
[25] J. Platt, “Fast training of support vector machines using sequential
minimal optimization,”Sch¨olkopf, B., Burges, C.J.C., and Smola, A.J.
(Eds.) Advances in Kernel Methods, pp. 185–208, 1999.
[26] I. Witten, E. Frank, and M. Hall, Data Mining: Practical machine
learning tools and techniques. Morgan Kaufmann, 2011.
[27] N. Shervashidze, P. Schweitzer, E. J. Leeuwen, K. Mehlhorn, and K. M.
Borgwardt, “Weisfeiler-lehman graph kernels,” Journal of Machine
Learning Research, vol. 1, pp. 1–48, 2010.
[28] L. Bai and E. Hancock, “Graph kernels from the jensen-shannon
divergence,”Journal of Mathematical Imaging and Vision, vol. 47, no.
1-2, pp. 60–69, 2013.
[29] ——, “A fast jensen-shannon subgraph kernel,” inICIAP, 2013, pp.