Vol. 2, Issue 8, August 2013
BRAIN TUMOR DETECTION USING METHOD
OF SEGMENTATION BASED ON SOFT
COMPUTING
Vishal Paramane
1, Lalita Admuthe
2, Vinayak Sutar
3P.G. Student, Department of Electronics Engineering, DKTE’s, TEI, Ichalkaranji, Maharashtra, India1 Professor, Department of Electronics Engineering, DKTE’s, TEI, Ichalkaranji, Maharashtra, India2 Assist. Professor, Department of Electronics & Telecommunication Engineering, DKTE’s, TEI, Ichalkaranji,
Maharashtra, India3
Abstract: This study gives a new approach to computer aided detection (CAD) scheme for brain tumor detection and its classification. In the study, large number of MRI images with various types of tumors was selected and examined. The proposed CAD system consist of following steps: 1) MRI image pre-processing; 2) ROI (Region Of Interest) selection; 3) Brain skull edge detection; 4) Tumor Segmentation; 5)Classification of tumor stage. In this study, we have used localised segmentation method for tumor feature extraction and Back Propagation Neural (BPN) Network with Levenberg-Marquardt (LM) algorithm for tumor classification.
Keywords: Computer aided detection (CAD), Median filter, localised segmentation, Back Propagation Neural (BPN) Network, Levenberg-Marquardt (LM).
I. INTRODUCTION
Computers were initially used in health care for billing and administrative functions. More recently computers have been used to present clinical information such as laboratory results and pharmacy orders. Many medical informatics researchers believe that the ultimate goal of the “computer-aided diagnosis” should be to advance computerized clinical decision-support.
The concept of image processing is an attractive technique for advancement of human perception. Interest in image processing methods stems from two principal application areas: improvement of pictorial information for human interpretation; and processing of image data for storage, transmission, and representation for autonomous machine. It can be applied to analyse images in a large number of domains. The influence and impact of digital images on modern society is tremendous, and image processing is now a critical component in science and technology [7]. The rapid progress in computerized medical image reconstruction, and the associated developments in analysis methods and computer-aided diagnosis, has propelled medical imaging into one of the most important sub-fields in scientific imaging.
During the past few decades, with the increasing availability of relatively inexpensive computational resources, computed tomography (CT), magnetic resonance imaging (MRI), Doppler ultrasound, and various imaging techniques based on nuclear emission (PET (positron emission tomography), SPECT (single photon emission computed tomography), etc) have all been valuable additions to the radiologist’s arsenal of imaging tools toward ever more reliable detection and diagnosis of disease. Tomography imaging principles are rooted in physics, mathematics, computer science, and engineering [8].
Medical image processing has experienced dramatic expansion, and has been an interdisciplinary research field attracting expertise from applied mathematics, computer sciences, engineering, statistics, physics, biology and medicine. Computer-aided diagnostic processing has already become an important part of clinical routine. Accompanied by a rush of new development of high technology and use of various imaging modalities, more challenges arise; for example, how to process and analyse a significant volume of images so that high quality information can be produced for disease diagnosis and treatment.
Vol. 2, Issue 8, August 2013
the presentation of benign and malignant states, and the varying abilities of the physicians may result in interpretation errors. CAD systems aim to facilitate lesion detection and characterization tasks by enhancing the physicians’ capabilities and reducing the time required for accurate diagnosis and treatment.
Medical image processing is a very broad field; it covers medical signal gathering, image forming, picture processing, and image display to medical diagnosis based on features extracted from images. There are many areas in medical image processing some emphasizing general applicable theory and some focus on specific applications. The objective is to provide a computational output as a second opinion in order to assist physicians in the disease diagnosis and treatment.
II.RELATED WORK
High-resolution MRI determines structural changes in the brain. Manual volumetric methods are currently the gold standard to determine the hippocampal volume, but they are time-consuming. Hippocampal volumetry is the best suited structural biomarker for AD, particularly for early diagnosis and appears to be suitable for risk stratification in mild cognitive impairment cohorts in treatment trials [6]. However, this procedure is still time-consuming and involves a great deal of manual work and therefore is not set to become a routine diagnostic test in the future. The application of Hippocampal volumetry might be further improved in the short-term by implementing semi automated and fully automated analysis procedures [6].
A computer-aided detection (CAD) scheme can be used for pulmonary embolism (PE) detection. For doing this CAD scheme consists of five basic steps: 1) lung segmentation; 2) PE candidate extraction using an intensity mask and tobogganing region growing; 3) PE candidate feature extraction; 4) false-positive (FP) reduction using an artificial neural network (ANN); and 5) a multifeature-based k-nearest neighbour for positive/negative classification [4].
The principles of CAD systems design and development are demonstrated by means of two ways. The first one focuses on the differentiation between symptomatic and asymptomatic carotid atheromatous plaques. For each plaque, a vector of texture and motion features was estimated, which was then reduced to the most robust ones by means of Analysis of Variance (ANOVA). Using fuzzy c-means, the features were then clustered into two classes. Clustering performances of 74%, 79%, and 84% were achieved for texture only, motion only, and combinations of texture and motion features, respectively [1].
The second CAD system supports the diagnosis of focal liver lesions and is able to characterize liver tissue from Computed Tomography (CT) images as normal, hepatic cyst, hemangioma, and hepatocellular carcinoma. Five texture feature sets were extracted for each lesion, while a genetic algorithm based feature selection method was applied to identify the most robust features. The selected feature set was fed into an ensemble of neural network classifiers [1]. The advantage of hierarchical self organizing map and fuzzy c means algorithms are used to classify the image layer by layer. The lowest level weight vector is achieved by the abstraction level. We have also achieved a higher value of tumor pixels by this neuro-fuzzy approach. The multilayer segmentation results of the neuro fuzzy are shown to have interesting consequences from the viewpoint of clinical diagnosis [2].
There are several techniques for image recognition. Among those methods, application of soft computing models on digital image has been considered to be an approach for a better result. The main objective of the present work is to provide a new approach for image recognition using Artificial Neural Networks [3]. Soft Computing is an emerging field built up of latest techniques like fuzzy logic, artificial neural networks, evolutionary computation and machine learning. Each soft computing technique can be applied to produce solutions to any problem that is too complex or noisy to tackle with conventional methods. Artificial Neural Network has been one of the recent development tools that are inspired from biological neural networks. The main advantage of this new powerful tool is to use its capacity to solve problems that are not very easy to be solved by traditional computing methods [3].
The Region of Interest both normal & abnormal appearing in medical image may be defined using manual or semiautomatic methodologies. These methodologies are used according to the application requirement [1]. In brain tumor detection system the part of tumor in scanned brain image is region of interest [9] [12].
Vol. 2, Issue 8, August 2013
Segmentation is an important process to extract information from complex medical images. Image Segmentations refers to the process of partitioning an image into groups of pixels which are homogenous with some criteria. Segmentation algorithms are area oriented instead of pixel oriented. The result of segmentation is the splitting up of the image into connected areas. Thus segmentation is concerned with dividing an image in to meaningful regions [11]. The one of the most common problem of pattern recognition in medical image analysis is the classification of a set into proper class. The extracted features classification can be supervised or unsupervised. In the supervised classification, the feature set is identified as a member of a predefined class, while in unsupervised classification, the feature set pattern is assigned to an unknown class [11].
III.SYSTEM BLOCK DIAGRAM
The system consists of following steps
Fig.1 System Implementation Steps
Image pre-processing:
By image pre-processing we improved the quality of data through the application of methods for denoising. Median filter is used for this.
Median filter
In median filtering, the neighbouring pixels are ranked according to brightness (intensity) and the median value becomes the new value for the central pixel.
Median filters can do an excellent job of rejecting certain types of noise, in particular, “shot” or impulse noise in which some individual pixels have extreme values. In the median filtering operation, the pixel values in the neighbourhood window are ranked according to intensity, and the middle value (the median) becomes the output value for the pixel under evaluation.
The best known order-statistics filter is the median filter, which replaces the value of a pixel by the median of the gray levels in the neighbourhood of that pixel-
--- (1)
The original value of the pixel is included in the computation of the median.
IMAGE PRE-PROCESSING
DEFINITION OF ROI
FEATURE EXTRACTION
Vol. 2, Issue 8, August 2013
Definition of ROI and feature extraction:
The MRI image of brain consists of different features, to detect the tumor we have to collect similar feature attributes together. For this the particular space in brain image is to be selected which is nothing but the ROI (Region of Interest).In this study we have used computer mouse to specify ROI. This selected area is used to generate binary mask of the region.
After defining ROI the binary mask generated is used for feature extraction. Segmentation of image is required for feature extraction. Image segmentation is done by localized segmentation method.
Localized Segmentation Method
Localized segmentation is actually Localized Region Based Active Contour Segmentation. The steps of implementing the segmentation are as below
1. Select 2D image
2. Initialise the binary mask(1=foreground 0=background) 3. Define no. of iterations & localisation radius(r)
4. Define α (weight) of smoothing term, for max (α) smoother results. 5. Selection of localized energy.(chan-vese energy) or (Yezzi energy).
E_cv(C) = F1(C) +F2(C)
= Integrate<interior of C> |U(x, y)-u1|2+ Integrate<exterior of C> |U(x, y)-u2|2 --- (2) Where U(x, y) represents the pixel located at (x, y) in the 2D image U, u1 and u2 are the average for the interior region and the exterior region respectively.
Finally, we tried to find a contour C such that E_cv is minimized
The segmented features of tumor are used to find out tumor area. This tumor area is used to find out the proportional area, which is required for classifying tumor stage.
Classification:
Along with tumor detection classification of tumor stage is essential for effective diagnosis system. For this various methods are available but in this study we are using artificial neural network approach.
For classification of tumor stage the back propagation neural network is used. Training a network by back-propagation involves three stages:
1) The feed-forward of the input training pattern 2) The back-propagation of the associated error 3) The adjustment of the weights.
The ANN comprised three layers (one input layer, one hidden layer, and one output layer) trained by back propagation. In proposed method back propagation feed forward neural network with Levenberg-Marquardt algorithm is used.
Levenberg-Marquardt Algorithm (LM)
For LM algorithm, the performance index to be optimized is defined a
s
2 1 1
)
(
)
(
kp P p K k kpo
d
w
F
---
(3)
Where w= [w1, w2 ……..wN ]T consists of all weights of the network, dkp is the desired value of the kthoutput and the pth
pattern ,okp is the actual value of the k th
output and pth pattern, N is the number weights, P is the number of patterns,
and K is the number of the network outputs. Equation (3) can be represented as,
Vol. 2, Issue 8, August 2013
Where
e
is the error vector comprising the error for all the training examples. When training with the LM method, the increment of weights ∆w can be obtained as:Δ
w
= [
J
TJ
+ µI]
-1J
Te
--- (5)
Where J is the Jacobian matrix, µ is the learning rate which is to be updated using the β depending on the outcome. In Particular, µ is multiplied by decay rate β (0<β<1) whenever F (w) decreases, whereas µ is divided by β whenever F (w) increases in a new step.
IV. RESULTS
For this method we tested various MRI brain images, the results of pre-processing, ROI, Segmentation is given in this paper. Before segmentation we have measured skull area of each MRI image which is given in Table I. Application of segmentation gave us tumor pixels & tumor area. By using tumor area & skull area we obtained proportional area .All the areas and tumor stages are represented in Table 1.
TABLE I
SR.NO IMAGE SKULL AREA TUMOR AREA PROP AREA TUMO
R STAGE
1 BT 1 5.1291e+05 794.750 1.54e-03 I
2 BT 2 2.3052e+04 91 3.94e-03 II
3 BT 3 1.2903e+05 267.375 2.07e-03 I
4 BT 4 31162 224.750 7.2e-03 III
5 BT 5 1.1217e+05 1.0403e+03 9.2e-03 IV
6 BT 6 8.0615e+04 212.750 2.63e-03 II
A number of original and test images have been taken and processed. The results for selected brain MRI images are shown in Fig 1 to Fig 6.
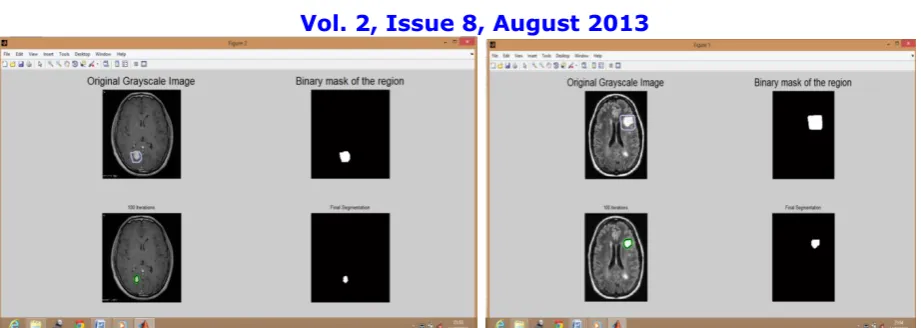
Figure 1 shows original gray scale tumored brain image (BT 1) in 1st window and selected binary mask of ROI (region of interest) in 2nd window. The processing of segmentation is shown in 3rd window while final segmented tumor is shown in 4th window.
Similarly Figure 2 shows results for BT 2, Figure 3 shows results for BT 3, Figure 4 shows results for BT 4, Figure 5 shows results for BT 5 and Figure 6 shows results for BT 6.
Vol. 2, Issue 8, August 2013
Fig 1.Results for image BT 1 Fig 2.Results for image BT 2
Fig .3 Results for image BT 3 Fig .4 Results for image BT 4
Fig .5 Results for image BT 5 Fig .6 Results for image BT 6
The proportional area for large no. of MRI brain images is calculated & used to train the neural network. After training, the network is used for testing and validation.
Vol. 2, Issue 8, August 2013
Fig .7 Neural Network Training
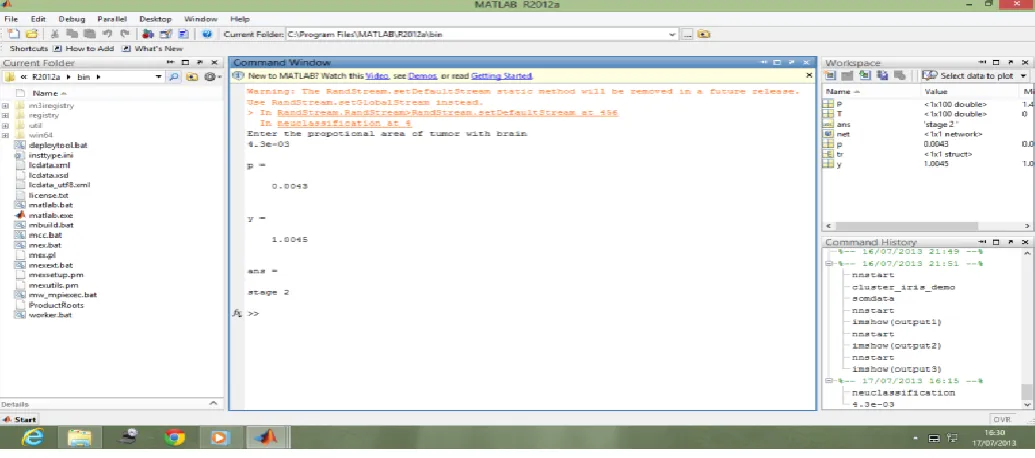
After training, the network was used for testing. Once the network is trained we can use the network for any value of proportional area. For this, we have to give proportional area in command window. For the given proportional area the network gives certain weight values which are used to find stage of tumor. Figure 8 shows the command window to give proportional area and the same window displays tumor stage.
Fig. 8 command window to enter value of prop area & to display tumor stage
Vol. 2, Issue 8, August 2013
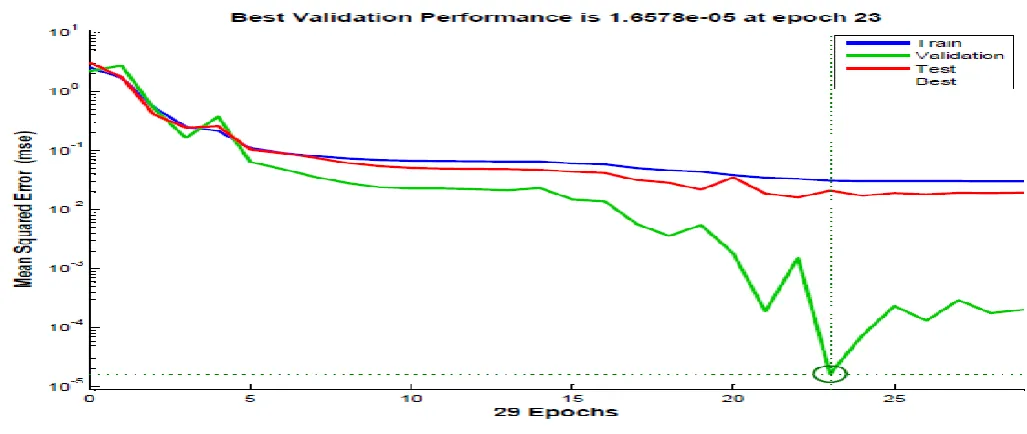
Fig. 9 Neural Network Training Performance
Figure 10 shows training state of neural network. It gives variation of gradient, mu & valfail with reference to epoch.
Fig. 10.Neural Network Training State
Vol. 2, Issue 8, August 2013
Fig. 11 Neural Network Training Regression
V.
CONCLUSION
We developed and tested a new CAD scheme for brain tumor detection & classification of tumor stage. To improve the system we tested & examined different MRI brain images. The study showed that the tumor detection & classification can be done effectively with the proposed method. By taking MRI images of a patient at regular interval we can also predict the growth rate of tumor which is very difficult to find without CAD system. The presented CAD system gives 2nd opinion to doctors for accurate detection of tumor & its stages.
R
EFERENCES[1] John Stoitsis, Ioannis Valavanisa, Stavroula G. Mougiakakou, Spyretta Golemati, Alexandra Nikitab, Konstantina S. Nikita, “Computer aided diagnosis based on medical image processing andartificial intelligence methods”, Elsevier September 2006.
[2] S. Javeed Hussain, S. Asif Hussain, M. Praveen Raju, M. N. GiriPrasad, D. Satyanarayana, C. Venkatesh, “ Neuro-Fuzzy System For Medical Image Processing”, (978-1-4244-9005-9/10), IEEE 2010.
[3] Md. Iqbal Quraishi, J Pal Choudhury, Mallika De “Image Recognition and Processing Using Artificial Neural Network” (978-1-4577-0697-4/12),
IEEE 2012.
[4] Sang Cheol Park, Brian E. Chapman, and Bin Zheng “ A Multistage Approach to Improve Performance of Computer-Aided Detection of Pulmonary Embolisms Depicted on CT Images: Preliminary Investigation” IEEE Trans on Biomedical Engineering, vol. 58,no.6, june 2011. [5] T. Logeswari and M. Karnan, “An Improved Implementation of Brain Tumor Detection Using Segmentation Based on Hierarchical Self Organizing Map”, International Journal of Computer Theory and Engineering, Vol. 2, No. 4, August, 2010.
[6] Rash Bihari Dubey, M.Tech., Madasu Hanmandlu, PhD, Suresh K. Gupta, PhD, Sushil K. Gupta, PhD, “ The Brain MR Image Segmentation Techniques and use of Diagnostic Packages”, Academic Radiology, Vol 17, No 5, May 2010.
[7] Rafael C. Gonzalez , Richard E. Woods “Digital Image Processing”, Third Edition. [8] Hongmei Zhu, “ Medical Image Processing Overview”, University of Calgary.
[9] MethodTuhin Utsab Paul, Samir Kumar Bandhyopadhyay, “Segmentation of Brain Tumor from Brain MRI Images Reintroducing K – Means with advanced Dual Localization Method”, International Journal of Engineering Research and Applications (IJERA), Vol. 2, Issue 3, pp. 226-231, May-Jun 2012.
[10] Eva M. van Rikxoort, Bartjan de Hoop, Saskia van de Vorst, Mathias Prokop and Bram van Ginneken,, “Automatic Segmentation of Pulmonary Segments From Volumetric Chest CT Scans”, IEEE transactions on medical imaging, vol. 28, no. 4, april 2009.
Vol. 2, Issue 8, August 2013
BIOGRAPHY
V. P. Paramane received B.E. and M.E. (appeared) in electronics engineering in Shivaji University Kolhapur, India. He is currently working as Asst. professor in electronics engineering department of DKTE’TEI, Ichalkaranji. His research interests include Image Processing, ANN
and clustering Algorithms.
L. S. Admuthe receivedM.E. and Ph. D. degree in Electronics Engineering from Shivaji University Kolhapur, India and she is currently working as a professor in electronics engineering department. Her research interests include Fuzzy, ANN, Genetic algorithms and various Clustering algorithms.
V. B. Sutar received B. E. and M. E. in electronics engineering in Shivaji University Kolhapur, India. He is currently working as Asst. professor in electronics and telecommunication engineering department. His research interests include Image Processing and Pattern Recognition, and Embedded systems.