Study of the processes
e
+e
−→
K
+K
−π
+π
−,
φη
with the CMD-3
detector at the
e
+e
−collider VEPP-2000
D.N. Shemyakin1,2,a, R.R. Akmetshin1,2, A.V. Anisenkov1,2, V.M. Aulchenko1,2, V.Sh. Banzarov1, N.S. Bashtovoy1, D.E. Berkaev1,2, A.E. Bondar1,2, A.V. Bragin1, S.I. Eidelman1,2, D.A. Epifanov1,3, L.B. Epshteyn1,4, A.L. Erofeev1, G.V. Fedotovich1,2, S.E. Gayazov1,2, A.A. Grebenuk1,2, D.N. Grigoriev1,2,4, E.M. Gromov1, F.V. Ignatov1,2, S.V. Karpov1, V.F. Kazanin1,2, B.I. Khazin1,2,
I.A. Koop1,2, O.A. Kovalenko1,2, A.N. Kozyrev1, E.A. Kozyrev1,2, P.P. Krokovny1,2,
A.E. Kuzmenko1,2, A.S. Kuzmin1,2, I.B. Logashenko1,2, P.A. Lukin1,2, K.Yu. Mikhailov1,2,
N.Yu. Muchnoi1,2, V.S. Okhapkin1, Yu.N. Pestov1, E.A. Perevedentsev1,2, A.S. Popov1,2,
G.P. Razuvaev1,2, Yu. A. Rogovsky1, A.L. Romanov1, A.A. Ruban1, N.M. Ryskulov1,
A.E. Ryzhenenkov1,2, V.E. Shebalin1,2, D.N. Shemyakin1,2, B.A. Shwartz1,2, D.B. Shwartz1,2,
A.L. Sibidanov1,5, P.Yu. Shatunov1, Yu.M. Shatunov1, E.P. Solodov1,2, V.M. Titov1,
A.A. Talyshev1,2, A.I. Vorobiov1, and Yu.V. Yudin1,2
1Budker Institute of Nuclear Physics, Novosibirsk, 630090, Russia
2Novosibirsk State University, Novosibirsk, 630090, Russia
3University of Tokyo, Department of Physics, 7-3-1 Hongo Bunkyo-ku Tokyo, 113-0033, Japan
4Novosibirsk State Technical University, Novosibirsk, 630092, Russia
5University of Sidney, School of Physics, Falkner High Energy Physics, NSW 2006, Sydney, Australia
Abstract.We report preliminary results on the measurement of the cross sections of the processese+e−→K+K−π+π−ande+e−→φηin the c.m.energy range from 1.5 GeV to 2 GeV with the CMD-3 detector. The cross sections of these processes agree with BaBar results and have better accuracy.
1 Introduction
It is known that the accuracy of the calculations of the hadronic contribution to the anomalous mag-netic moment of the muon is driven in part by the processe+e− → hadronswith kaons in the final state. Studies of the hadronic cross sections allow us to determine parameters of light vector mesons and their excitations.
The processe+e− → K+K−π+π−has been studied at DM1 [1], DM2 [2] and with much larger effective integrated luminosity at the BaBar by ISR [3, 4]. Study of production dynamics with BaBar exhibited complex resonant substructures (K+K−ρ,K∗Kπ,φπ+π−,K1Ketc.). Part of such intermediate states were studied by the Babar collaboration, but with CMD-3 [5] it is possible to make a more detailed analysis of this dynamics.
BABAR measured thee+e−→ K+K−ηcross section in the c.m. energy range from 1.56 to 3.48 GeV in theη → γγdecay channel [6], and (with lower accuracy) in the energy range from 1.56
ae-mail: [email protected]
DOI: 10.1051/ C
Owned by the authors, published by EDP Sciences, 2014
/201
to 2.64 GeV in theη → π+π−π0 decay channel [7]. They also found that the major intermediate mechanism in this process isφη, and theNON−φcross section part amounts to about 3−15 percent. The collected statistics were not enough to analyse the intermediate states in theNON−φpart.
The results on thee+e−→K+K−π+π−ande+e−→ φηcross sections presented here are based on 22 pb−1of data collected with the CMD-3 detector at the VEPP-2000 collider [8] in the c.m. energy range from 1.5 to 2.0 GeV. The luminosity is measured using events of Bhabha scattering at large angles [9].
2 Cross section measurement of the process
e
+e
−→
K
+K
−π
+π
−Candidates for the process under study are required to have three or four tracks in the Drift Chamber coming from the interaction region. Momentum of charged particlepiis determined from the track
curvature and angles reconstructed in DC. As one can see in Fig. 1, the ionization losses of pions and kaons in the Drift Chamber are significantly different. This difference is used forK/π-separation.
P, MeV/c 100 200 300 400 500 600 700
dE/dX
10000 20000
hdedx2d_970 Entries 2196 Mean x 339.7 Mean y 3525 RMS x 112.3 RMS y 2496 hdedx2d_970 Entries 2196 Mean x 339.7 Mean y 3525 RMS x 112.3 RMS y 2496 tdedx:tptot {is_kkpipi4==1 && abs(tz[0])<3 && abs(tz[1])<3 && abs(tz[2])<3 && abs(tz[3])<3 && trho[0]<0.06 && trho[1]<0.06 && trho[2]<0.06 && trho[3]<0.06 && tptot[0]>60 && tptot[1]>60 && tptot[2]>60 && tptot[3]>60}
Figure 1. Pion and kaon ionization losses in DC vs particle momentum.
P, MeV/c
Σ
100 200 300 400 500 600
, MeV
beam
E - 2E
Σ
-600 -400 -200 0 200 400
h
Entries 3686 Mean x 213.7 Mean y 5.57 RMS x 181.3 RMS y 247.4
h
Entries 3686 Mean x 213.7 Mean y 5.57 RMS x 181.3 RMS y 247.4
EAll:PAll {Ngood==4}
Figure 2. Scatter plot of the difference between the
total energy and c.m. energy (ΔE4) versus the total
momentum for four-track events. The upper cluster of dots represents π+π−π+π− while the lower one
-K+K−π+π−events.
The total energyEtot and total momentumPtotcould be used for selection of four-tracke+e− → K+K−π+π−events. They are defined as:
Etot=
4
i=1
p2
i +m2i, Ptot =|
4
i=1
pi|.
Figure 2 shows a scatter plot of the difference between the measured total energy and c.m. energy
ΔE4 =Etot−Ec.m.vs the total momentum for events with four tracks. The signal events locate near
zero in the vertical axis and near zero in the horisontal axis. Another cluster of events with a zero total momentum but shifted up the vertical axis, corresponds toπ+π−π+π−events. The conditions onΔE4 andPtotfor the signal events were chosen as:
−100 MeV<ΔE4<100 MeV, Ptot<100 MeV/c.
added to the energy of three detected particles. The difference between the obtained energyΔE3+1 and c.m. energy is shown in Fig. 3. Signal events are clearly seen near zero. To obtain the number ofK+K−π+π−events from a three-track sample, the histogram was fitted with a sum of two Gaussian distributions for a signal peak and a quadratic polynomial for background in the range from−200 MeV to 200 MeV. Variation of fitting functions for the peak and background leads to about 3% uncertainty in the number of signal events.
hEtotv3Ngood_2k2pi Entries 2948 Mean 45.46 RMS 215.6
, MeV Beam -2*E -π + π -K + K E
-400 -200 0 200 400 600 0 20 40 60 80 100 hEtotv3Ngood_2k2pi
Entries 2948 Mean 45.46 RMS 215.6 Total energy+k or pi - 2*ebeamfor 3 good tracks
-π
+π
-π
+π
γ -π + π -K + , K 0 π 0 π -π + π -π + π ± π s K ± , K 0 π -π + π -π + π-π
+π
-K
+K
Figure 3.The histogram of the difference between the calculated energy of the four particlesΔE3+1and c.m.
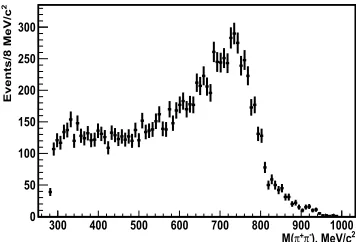
energy. 2 ), MeV/c -π + π M( 300 400 500 600 700 800 900 1000
2 Events/8 MeV/c 0 50 100 150 200 250 300
Figure 4.Theπ+π−invariant mass.
To obtain a detection efficiency, theK+K−π+π−events were simulated with a primary generator using the GEANT4 package and then reconstructed with the same software as experimental data. The π+π−invariant mass,K±π∓invariant mass, and theK+K−invariant mass for the selected events are shown in Fig. 4, Fig. 5 and Fig. 6, respectively. Presence ofρin theπ+π−combination,K∗inK±π∓ andφinK+K−is seen. Production mechanisms with theK+K−ρ,K1K → K∗πK,φπ+π−andK∗K∗ interfering intermediate states are used for the primary generator to describe angular and invariant mass distributions of the experimental data. The total detection efficiency takes into account the contributions of different intermediate states based on the approximation of the experimental angular and momentum distributions. A phase space model was also considered and excluded from further consideration because it contradicted to all studied distributions.
2 ), MeV/c -π + M(K
700 800 900 1000 1100 1200
2 Events/8 MeV/c 0 100 200 300 400 500 600
Figure 5.TheK±π∓invariant mass.
2 ), MeV/c -K + M(K
1000 1100 1200 1300 1400 1500
2 Events/8 MeV/c 0 100 200 300 400 500 600 700 800
Figure 6.TheK+K−invariant mass.
At each energy point the cross section is calculated as
whereLis the integrated luminosity, is the detection efficiency, and (1+δ) is the radiative correction calculated according to [10, 11]. The detection efficiency is about 50-60 % and is basically determined by detector acceptance. The radiative correction smoothly increases from 0.8 to 0.98 in the studied energy range. The cross section as a function of energy is presented in Fig. 7. The cross section maximum value is∼4.5 nb. Systematic errors are under study and are currently estimated as 7%. The main uncertainty is due to model dependence of the detection efficiency. The obtained cross section agrees with the previous measurement by the BaBar Collaboration [4] presented by open circles.
, MeV c.m. E 1500 1600 1700 1800 1900 2000
cross section, nb
0 1 2 3 4 5
Figure 7. Dots show the eee+e− → K+K−π+π−
cross section measured with the CMD-3 detector. The BaBar results are shown by open circles.
h_MinvKK_mc Entries 715537 Mean 1019 RMS 5.807
1000 1005 1010 1015 1020 1025 1030 1035 1040 0
20 40 60 80 100 120 140 160 180 200
220 h_MinvKK_mcEntries 715537 Mean 1019 RMS 5.807
), MeV
-,K
+
(K
inv
M
Number of events
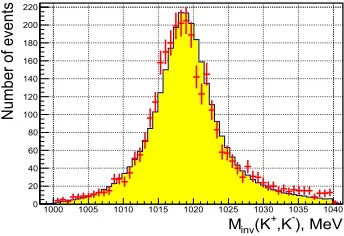
Figure 8. Distribution of the invariant mass of two kaons.The hatched histogram corresponds to MC and dots correspond to data. The number of events in the MC-histogram is normalized to the number of events in the experimental one.
3 Measurement of the Cross section for the process
e
+e
−→
φη
To select candidates for two kaons fromφdecay, we apply the following set of selection criteria to all pairs of charged particles in the DC (the optimal values of cuts are determined using MC of signal and background processes): 1) Total charge of the pair should be zero; 2) Both tracks have a minimal distanceρto the beams axis of less than 0.5 cm; 3) The distances of tracks from the beam interaction point along the z-axis|z1,2|is less than 12 cm; 4) The absolute difference of the distances of tracks from the beam interaction point along the z-axis|z1−z2|is less than 4 cm; 5) Particles passed more than a 19 cm of the DC in the transverse direction: r⊥ > 19 cm; 6) The energy losses dE/dx are typical for the charged kaons with corresponding momenta; 7) The invariant mass of particles, if they are kaons, should come fromφdecay: Minv∈(1000 MeV; 1040 MeV); 8) Angle between kaons and their momenta are inside certain limits taken from simulation forφdecay at a given energy.
If a pair of charged particles satisfies the above conditions, we consider them to be kaons fromφ decay and calculate the parameterEtotal−2Ebeam:
Etotal−2Ebeam=
p2
K++m2K+
p2
K−+m2K+
(−pK+−pK−)2+m2η−2·Ebeam,
which represents the total energy of the final particles minus twice beam energy assuming that the missing particle is anη-meson. The distribution of this parameter has a peak around zero for any energy point and is used for determining the number of selected signal eventsNexp.
0 100 200 300 400 500 600 700 800 0
50 100 150 200 250 300 350 400 450
), MeV
-,K
+
Missing mass of (K
Number of events
-K +
K π0
-K +
K η
ω
-K + K (600)
0 f -K + K
Figure 9.Distribution of the missing mass of theK+−
K−pair for experimental data. The events of signal
andK+K−π0,φf
0(600),K+K−ωbackground processes
are seen.
1.6 1.7 1.8 1.9 2 0
0.5 1 1.5 2 2.5 3
/ ndf
2
χ 103.5 / 84 Prob 0.07341 p0 0 0±
p1 0.02926 0.001536±
p2 1.678 0.008287±
p3 0.1455 0.02395±
p4 5.327e-05 ± 3.145 p5 0.0005162 0.0003667±
p6 2.145 0.02552±
p7 0.03065 0.03264±
p8± 1.664 3.799 / ndf
2
χ 103.5 / 84 Prob 0.07341 p0 0 0±
p1 0.02926 0.001536±
p2 1.678 0.008287±
p3 0.1455 0.02395±
p4 5.327e-05 ± 3.145 p5 0.0005162 0.0003667±
p6 2.145 0.02552±
p7 0.03065 0.03264±
p8± 1.664 3.799
, GeV
c.m.
E
Cross section, nb
Figure 10. Circles show thee+e−→ φηcross section measured with the CMD-3 detector. The BaBar results are shown by squares.
The cross section of the processe+e−→ φηat the c.m. energyEc.m.is given by the expression:
σe+e−→φη=
Nexp·Corr
L·ε·(1+δrad)·B(φ→ K+K−),
whereL- the collected luminosity at the fixed energy point,Nexp - the number of signal events de-termined at this energy point,ε- the efficiency,Corr- the correction to the efficiency of detecting charged particles taken from MC. The determined cross section is presented in Fig. 10 along with the BABAR data.
Acknowledgements
This work is supported in part by the Ministry of Education and Science of the Russian Federation, by FEDERAL TARGET PROGRAM "Scientific and scientific-pedagogical personnel of innovative Russia in 2009-2013", by agreement 14.B37.21.07777, by the RFBR grants 10-02-00253, 10-02-00695, 11-02-00112, 11-02-00328,
12-02-01032, 12-02-31498, 12-02-31499, 12-02-31501, 13-02-00215, 14-02-00047 and the DFG grant HA 1457/9-1.
References
[1] A. Cordieret al., Phys. Lett. B110, 335 (1982). [2] D. Biselloet al., Nucl.Phys.Proc.Suppl.21, 111 (1991).
M.R. Whalley, J. Phys. G29, A1 (2003).
[3] B. Aubertet al., Phys. Rev. D77, 092002 (2008). [4] J.P. Leeset al., Phys. Rev. D86, 012008 (2012).
[5] B.I. Khazinet al., Nucl. Phys. B (Proc. Suppl.)181-182, 376 (2008). [6] B. Aubertet al., Physical Review D77, (2008).
[7] B. Aubertet al., Physical Review D76, (2007). [8] D.E. Berkaevet al., JETP113, 213 (2011).
[9] R.R. Akhmetshinet al., Nucl. Phys. B (Proc. Suppl.)225-227, 69 (2012). [10] E.A. Kuraev and V.S. Fadin, Sov. J. Nucl. Phys.41, 466 (1985).