Article
Coupling Fine-Scale Root and Canopy Structure
Using Ground-Based Remote Sensing
Running head: Fine Scale Structural Coherence
Brady S. Hardiman
1,2,*, Christopher M. Gough
3, John R. Butnor
4, Gil Bohrer
5,
Matteo Detto
6, Peter S. Curtis
21 Department of Forestry and Natural Resources & Division of Environmental and Ecological Engineering, Purdue University, West Layafette, IN 47907, USA
2 Department of Evolution, Ecology and Organismal Biology, The Ohio State University, Columbus, OH 43210, USA
3 Department of Biology and Environmental Studies, Virginia Commonwealth University, Richmond, VA 23284, USA
4 USDA Forest Service, Southern Research Station, 81 Carrigan Drive, Burlington, VT 05405, USA
5 Department of Civil, Environmental and Geodetic Science, The Ohio State University, Columbus, OH 43210, USA
6 Smithsonian Tropical Research Institute, Unit 9100, Box 0948, DPO AA 34002-9998, USA * Corresponding author. Email: [email protected]
Abstract: Ecosystem physical structure, defined by the quantity and spatial distribution of biomass, influences a range of ecosystem functions. Remote sensing tools permit the non-destructive characterization of canopy and root features, potentially providing opportunities to link above- and belowground structure at fine spatial resolution in functionally meaningful ways. To test this possibility, we employed ground-based portable canopy lidar (PCL) and ground penetrating radar (GPR) along co-located transects in forested sites spanning multiple stages of ecosystem development and, consequently, of structural complexity. We examined canopy and root structural data for coherence at multiple spatial scales ≤ 10 m within each site using wavelet analysis. Forest sites varied substantially in vertical canopy and root structure, with leaf area index and root mass more evenly distributed by height and depth, respectively, as forests aged. In all sites, above- and belowground structure, characterized as mean maximum canopy height and root mass, exhibited significant coherence at a scale of 3.5-4 meters, and results suggest that the scale of coherence may increase with stand age. Our findings demonstrate that canopy and root structure are linked at characteristic spatial scales, which provides the basis to optimize scales of observation. Our study highlights the potential, and limitations, for fusing lidar and radar technologies to quantitatively couple above- and belowground ecosystem structure.
Keywords: canopy; root; biomass; spatial wavelet coherence; radar; lidar
Highlights
• Canopy and root biomass biomass are examined across a forest chronosequence.
• Colocated ground-based lidar and ground-penetrating radar data were collected.
• Spatial wavelet analysis reveals coherence in canopy height and root biomass.
• All ages exhibited coherence at 3-4m; oldest stands demonstrated coherence at 8m.
Ethical Statement
The authors declare no conflicts of interest, financial, personal, or otherwise.
All authors made substantial original intellectual contributions to the collection and analysis of data described in this study and have reviewed and approved the final manuscript prior to submission. The work described in the manuscript is the author’s own original work and has not been published previously, nor is it under consideration for publication elsewhere.
All funding sources in involved in the completion of this study have been declared in the acknowledgements section of the manuscript.
1. Introduction
Ecosystem structure predicts a wide range of ecological functions, from carbon, nutrient, and water cycling to animal biodiversity. Measures of ecosystem structure expressing the quantity and/or distribution of above- and belowground biomass serve as important proxies for ecosystem functions, and accordingly are commonly used to parameterize ecosystem models (Medvigy et al., 2009; Monserud and Sterba, 1996). For example, leaf surface area is a global predictor of primary production (Reich, 2012). Belowground, root biomass distribution correlates with nutrient uptake and retention, which can in turn affect aboveground growth and structure (Parsons et al., 2016; Ritter et al., 2005). Ecosystem water cycling and land-atmosphere gas exchanges, similarly require understanding of above- and belowground structure, with canopy interception of precipitation affecting the distribution and quantity of soil water content and, consequently, plant water availability and root growth (Shachnovich et al., 2008). While above- and belowground structural interactions are relevant to these and other ecosystem functions, quantitative linkages between them are poorly characterized, particularly at fine spatial scales, owing in large part to challenges in quantifying belowground structure and the often arbitrary scales at which they are compared.
Traditional approaches linking above- and belowground ecosystem structure at scales of several meters or less are time consuming, may require destructive sampling, and are often descriptive rather than quantitative (McGuire et al., 2001; Ostertag, 1998; Purbopuspito and Van Rees, 2002; Schroeer et al., 1999; Taskinen et al., 2003). For example, common methods of belowground biomass estimation include soil coring followed by the manual separation of soil and roots prior to weighing, or equally laborious root imaging (i.e., minirhizotron) protocols (Johnson et al., 2001). Comparatively, many measures of canopy structure -- such as mean height, leaf area index, stem density, and diameter distribution -- are more easily acquired using inventory or remote sensing approaches (Garrity et al., 2012; Gonzalez et al., 2010; Lefsky et al., 2002a, 2002b, 1999). Because aboveground ecosystem structure is more easily characterized, identification of coupled above-and belowground structural features could advance and simplify efforts to infer root structure from canopy structure, and provide new opportunities to scale, model, and interpret root-canopy interactions.
comparable spatial scales the distribution of root biomass in upper soil horizons (Barton and Montagu, 2004; Butnor et al., 2003; Hruska et al., 1999; Raz-Yaseef et al., 2013; Samuelson et al., 2014). GPR relies on differential propagation of electromagnetic waves through the soil and uses travel time and amplitude of reflected signals to estimate biomass (Butnor et al., 2003).
In this short communication, we show how PCL and GPR can be applied in tandem to explicitly couple fine-scale above- and belowground structure. Our findings suggest strong but spatially variable coherence between root and canopy structure, indicating robust inference of belowground structure from aboveground structure is possible but will require broader quantitative understanding of the spatial scales of above- and belowground structural correspondence.
2. Methods
2.1 Study site and layout
Our study was conducted at the University of Michigan Biological Station (UMBS) in northern lower Michigan, USA, in a transitional zone between temperate and boreal forest (Nave et al., 2014; Schmid et al., 2003). The site contains ecosystems common throughout the region, which include secondary forests regrown during the last century following harvest and wildfire, and primary “old-growth” forest fragments that were spared stand-replacing disturbance (Gough et al., 2016). Detailed descriptions of UMBS forests are found in Gough et al. (2010), Hardiman et al. (2013b), and Nave et al. (2011).
For our analysis of above- and belowground structure, we selected three forest sites spanning a broad gradient in canopy structural complexity (Table 1; Hardiman et al., 2013b). An old-growth (age = 185 years) forest site, hereafter called “late succession”, subject to infrequent single-tree harvesting during the middle 20th century containing several canopy gaps and a complex canopy
structure (Albert and Minc, 1987; Hardiman et al., 2013b) was dominated by late successional eastern hemlock (Tsuga canadensis L.), American beech (Fagus grandifolia Ehrh.), northern red oak
(Quercus rubra L.), and sugar maple (Acer saccharum Marsh.). A second forest site (age = 95 years),
hereafter termed “middle succession”, was transitioning from early to middle stages of ecological succession following clearcut harvesting and fire in the early 20th century (Gough et al., 2007). Canopy composition includes a large but rapidly declining fraction of early successional aspen
(Populus grandidentata Michx. & Populus tremuloides Michx.) and birch (Betula papyrifera Marsh.),
with increasing representation in the canopy of northern red oak, red maple (A. rubrum L.), white pine (Pinus strobus L.), and American beech. Lastly, an early successional forest site (age = 31 years) established in 1980 following clearcut harvesting and fire, hereafter referred to as “early successional”, was dominated by a relatively uniform aspen and birch canopy (Gough et al., 2007).
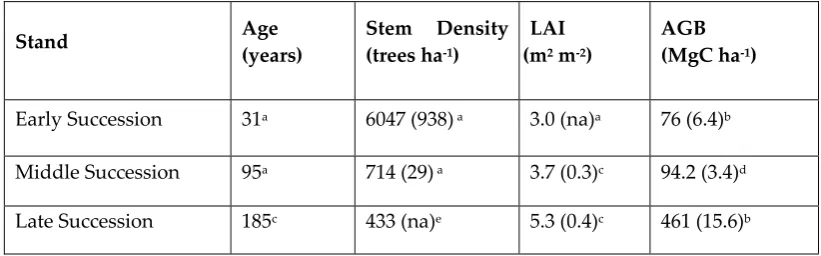
Table 1. Stand characteristics. All values are means (standard error) for each study site.
Stand Age
(years)
Stem Density (trees ha-1)
LAI (m2 m-2)
AGB (MgC ha-1)
Early Succession 31a 6047 (938) a 3.0 (na)a 76 (6.4)b
Middle Succession 95a 714 (29) a 3.7 (0.3)c 94.2 (3.4)d
Late Succession 185c 433 (na)e 5.3 (0.4)c 461 (15.6)b
aFrom Gough et al. (2007). SE of LAI not available. bL. Nave (personal communication, April
19, 2016). cFrom Hardiman et al. (2013b). dFrom Gough et al. (2008). eFrom (Liebman et
Within each forest site, we remotely sensed above- (canopy) and belowground (root) structure at two spatial scales to assess structural variation within and across plots. Our first sampling campaign broadly captured within-stand structural variability to identify the spatial scale of canopy and root structural coherence. We used GPR and PCL data to co-characterize high resolution root and canopy structure continuously along six parallel 50m transects, each 10m apart within 2500m2
plots in early, middle, and late successional forests. This design was chosen to allow examination of the spatial scale of root and canopy covariation at multiple scales. A second sampling campaign was a conventional qualitative comparison of canopy and root structural coherence. Fine-scale structure was characterized within six 2x2m square subplots nested within early and late successional plots. In the early successional stand, 3 subplots were positioned under canopy gaps; no gaps were present in the late successional plot. Parallel transects (length = 2m) were established at 25cm spacing the width of the subplots. Root biomass was assessed by GPR along each transect (n = 9) while the PCL was deployed along alternating transects (n = 5) in each plot.
2.2 Aboveground canopy structure: portable canopy lidar
We characterized canopy structure using a PCL equipped with a near-infrared laser distance meter (model LD90- 3100VHS-FLP; RieglUSA, Inc., Orlando, Florida, USA). Design, operation, and validation of the PCL is described in detail elsewhere (Fahey et al., 2014; Gough et al., 2013; Hardiman et al., 2013a, 2013b; Parker and Russ, 2004). Briefly, the PCL is an upward-pointing ground based high-frequency laser distance meter that non-destructively measures vegetation height by reflecting laser pulses off canopy surfaces. The PCL produces a vertical cross section of fine-scale canopy height and spatial distribution of canopy elements, permitting derivation of a suite of metrics characterizing 1-meter resolution height (maximum canopy height, height of maximum leaf density, mean height of canopy surfaces, etc.), variability of height metrics across the transect, and openness of the canopy volume (gap fraction, clumping index, porosity). Additional explanation of the derivation and interpretation of these structural metrics can be found in Hardiman et al. (2013a). Of the structural metrics derived from PCL, we compared mean canopy height with root structure because the former is readily acquired using ground surveys and airborne lidar measurements, making this accessible expression of aboveground structure an ideal candidate for inferring belowground structure.
2.3 Belowground structure: ground-penetrating radar
0.68 to r= 0.77 among forest sites. GPR-derived estimates of column-total root biomass were compared to PCL estimates of canopy height.
2.4 Wavelet coherence analysis
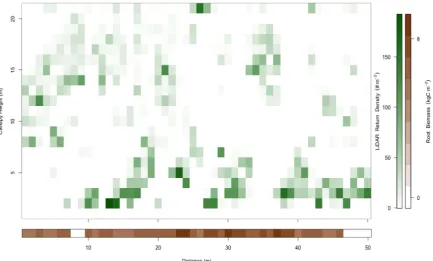
Our field data collection yielded detailed 1-meter resolution canopy and root structural information (Figure 1), which we examined for coherence at multiple spatial scales ≤10m within each site using wavelet analysis (Kumar and Foufoula-Georgiou, 1997)
Figure 1. Alignment of canopy and root structure data. Vertical cross-sections of canopy (top) and root (bottom) biomass distribution illustrating the arrangement of 50m lidar and radar data collected along the
same transect. Lidar returns are binned to 1m2 (horizontal and vertical) and radar returns are column totals
binned to 1m (horizontally). Lidar bins are shaded proportional to return density (correlated with canopy biomass) and radar bins are shaded proportionally to biomass (both shown on the vertical color bar on the right).
conducted with the Grinsted (2004) Matlab wavelet toolbox. Because one of our goals was to determine whether easily obtained aboveground metrics of structure can be used to estimate belowground structural features, we focused our wavelet analysis on structural measures that are readily derived from PCL and GPR data and, in the case of aboveground structure, easily obtained using other (e.g., inventory based) approaches. Wavelets decompose the variability of a spatial process on a scale-base function. Wavelet coherence (WC) of two spatial patterns, X and Y, is calculated as
( ) = |( )( )| ( )
where SXX and SYY are the univariate global wavelet spectra of spatial pattern X and Y respectively
at scale s, and CXY is their global wavelet cospectrum (Grinsted et al., 2004). Wavelet coherence is a
Given our interest in fine-scale (≤10m) root-canopy structural correspondence, we evaluated coherence at scales of 1.5 to 10m using a Morlet wavelet function. Additionally, the evaluation of scales > 10m along our 50m transects would reduce the number of replicates to <5 per transect, greatly decreasing statistical power to detect coherence. The ensemble wavelet coherence was computed for each site as the average of wavelet coherences of the six transects within each site. CIs were computed using 1000 random combinations of GPR and lidar-derived canopy height of the six transects for each site. To increase the number of permutations considered when generating CIs, we also included flipped (reversed) transects.
3. Results
3.1 Canopy and root vertical structure
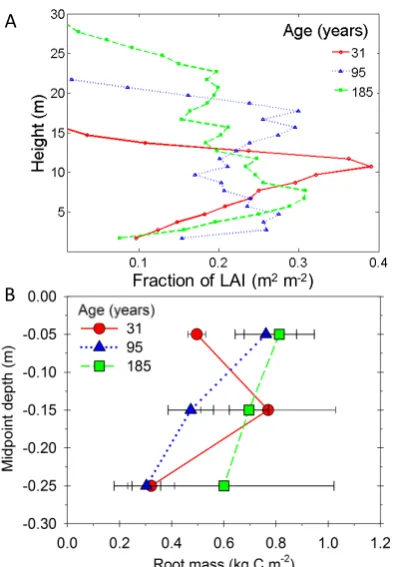
We observed substantial differences among sites in mean vertical canopy and root structure, with lead area density (LAD) and root mass more evenly distributed by height and depth, respectively, as forests aged. The vertical distribution of vegetation in the canopy, expressed as LAI, became increasingly more even as forests got older, indicating a progressive advance to a taller and more multi-layered canopy (Figure 2a). The early successional forest canopy was 15m tall and exhibited a unimodal distribution, with a dense LAI layer at ~10m. In the middle successional forest, maximum height was 22m, with a broadly bimodal vertical LAI distribution; an LAI peak at 18m indicated a concentration of canopy dominant trees, and a second peak at ~5m signified a substantial subcanopy stratum. Maximum canopy height of the late successional forest was 28m and LAD was relatively uniform across heights.
Figure 2. Canopy and root vertical profiles. Vertical profiles of canopy and root biomass change with stand age demonstrating greater vertical uniformity in older stands. Canopy height increases with stand age and biomass distribution becomes more uniform (A). Mean root biomass (± s.e.) increases in deeper soil horizons as stands age, but younger forests exhibit highest root biomass at moderate depths (B).
Root mass exhibited similar trends of increasing vertical evenness with increasing age (Figure 2b). Root mass was irregularly distributed across soil depths in the early successional forest, becoming more uniform in older forests. Peak root mass in the youngest forest was concentrated at 15cm
Fraction of LAI (m2m-2)
A
(midpoint) and at the soil surface in the two older forests. In middle successional forests, root mass decreased significantly (p <0.05) with increasing soil depth. The middle successional forest had the broadest range of root mass across depths, while root mass in late successional forest did not differ significantly across soil depths.
3.2 Canopy and root structural coherence across ecosystem development
We found that canopy and root structure were significantly related at all stages of forest development, but that the strength and statistical significance of this coherence was dependent upon the spatial scale of comparison. In our wavelet coherence analysis, we focused on the correlation of two structural parameters derived from PCL and GPR: maximum canopy height and root mass, respectively. Our findings indicate that at a scale of 3.5-4 meters, the frequencies of variation in canopy height and root biomass were significantly coherent (WC=~0.3, p < 0.05) in all stages of forest development, increasing slightly with age (Figure 3). These results indicate subtle differences across forest development in the spatial scale but not strength of coherence between maximum canopy height and root mass. Canopy height and root mass were additionally coherent in the oldest and most structurally complex stand at ~8m (WC=~0.6, p<0.05). Root-canopy structural coherence was not significant at any other spatial scales examined (p > 0.05).
Figure 3. Roots and canopy structural coherence. Wavelet coherence between canopy height and root biomass peaks in all stands at 3-4m and again at 8m in the oldest stand. Each line is an average across all six transects in each stand. Confidence intervals were constructed from 1000 randomizations of six random samples independently extracted from the dataset pooled across sites. Portions of each curve above the dotted line indicate scales at which root biomass and canopy height are significantly coherent. Note, the x-axis is a shown on a log scale.
3.3 Small-scale canopy and root structural correspondence
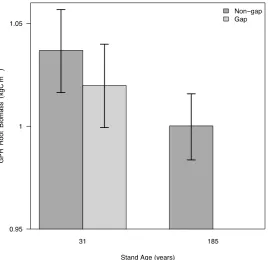
We evaluated root-canopy structural 7correspondence using conventional approaches that examine root mass below continuous canopy cover or gaps. Our analysis showed root mass was weakly related to the visually determined occurrence of small canopy gaps in the youngest forest, a finding consistent with our wavelet coherence analysis revealing limitations in the detection of canopy and root structural correspondence when data were binned at arbitrarily small (<3m) spatial scales. Similarly, we observed no significant difference in the youngest stand in root mass below small (2m2) canopy gaps and intact canopies (Figure 4, p > 0.05). Canopy gaps were absent in the oldest
Figure 4. Influence of canopy gaps and stand age on root biomass. Fine-scale mean (±95% confidence intervals) GPR-derived root biomass changes with stand age and disturbance as measured by 2m GPR transects in subplots located under gaps or continuous canopies. No gaps were present in the 185 year old stand.
4. Discussion
We have shown that portable canopy lidar and ground penetrating radar, when paired, can yield quantitative and potentially scalable coupled canopy-root structural information. Ground and airborne lidar approaches to remotely sensing canopy structure, including canopy height, are well developed (Detto et al., 2015; Lefsky et al., 2002b; Lim et al., 2003; Nelson et al., 2003; Parker et al., 2004), but are rarely coupled with GPR approaches for remotely sensing root structure (Borden et al., 2014; Butnor et al., 2012; Guo et al., 2013; Stover et al., 2007). Airborne lidar data products alone have been used to quantify root mass at sub-hectare (>30m) spatial scales in boreal and subtropical forests (Cao et al., 2014; Kristensen et al., 2015), and to scale GPR-based root mass in an oak savanna (Raz-Yaseef et al., 2013), highlighting potential for joining lidar and radar technologies to more comprehensively quantify and couple above- and belowground ecosystem structure. Our findings build on and advance these prior results by showing that ground-based lidar and GPR remote sensing applications, which operate at a smaller spatial scale, may provide an order of magnitude higher (<10m) resolution. High resolution, non-destructive co-quantification of canopy and root structure could be used to infer and interpret ecosystem functions requiring understanding of fine-scale structure, including primary production (Hardiman et al., 2013b, 2011), animal habitat suitability and diversity (Goetz et al., 2007; Vierling et al., 2008), and tree-scale hydrologic processes (Kirchner, 2006; Raz-Yaseef et al., 2013).
these structures are measured (Figure 4), and may explain why qualitative assessments of canopy-root structural coherence, including ours (Figure 3), conducted at a variety of spatial scales, report mixed degrees of canopy-root coupling (e.g., McGuire et al., 2001; Ostertag, 1998). The spatial scale (of 3.5 to 4m) of maximum canopy-root structural correspondence at our sites may approximate the average individual-tree biomass footprint, which generally increases above- and belowground with forest age. For example, mean tree crown length, stem diameter, and root length increased with age in a number of different ecosystems (Børja et al., 2008; Medhurst et al., 1999; Monserud and Sterba, 1996; Watson and O’Loughlin, 1990; Wirth et al., 2004). A second scale of significant coherence at 8m in the oldest stand is a signal of high variation in individual-tree footprint size within this complex late successional forest, which contains a mosaic of smaller closely-spaced trees and larger mature trees spaced farther apart; in contrast, the younger stands have one primary canopy layer comprised of geometrically less variable trees and, therefore, more uniform in biomass footprint size (Figure 4, Table 1; Hardiman et al., 2013b; Liebman et al., n.d.).
While the scale-dependency of canopy-root correlation indicates caution must be exercised when interpreting canopy and root structural linkages, the range and distribution of spatial scales (3.5-4m, 8m in oldest forest) in which above/belowground structure was significantly coherent at our sites was narrow considering the comparatively large differences across ecosystem development in canopy and root vertical structure (Parker and Russ, 2004; Parker et al., 2004). Moreover, the increasing scale of root-canopy structural coherence and transition from unimodal to bimodal correspondence with age is consistent with ecological understanding of changes in complexity over the course of forest development (Parker and Russ, 2004). Nonetheless, inferring root structure from canopy structure in other, particularly non-forested, ecosystems requires understanding of scale-dependencies across a much broader array of plant growth forms and spatial densities, factors which affect ecosystem physical structure, and the quantity and allocation of above- and belowground biomass (Mokany et al., 2006; Poorter et al., 2012).
Ground-based approaches for remotely sensing ecosystem structure have been applied successfully to variety of ecosystems, but lidar and radar-based methods have limitations that may preclude the derivation of robust co-located above- and belowground measurements under some conditions. A comprehensive review of lidar and radar ecological applications and limitations is beyond the scope of this Short Note and available elsewhere (Butnor et al., 2012; Lefsky et al., 2002b; Parker et al., 2004); here, we briefly summarize current limitations of each technology. Accurate characterization of canopy structure, especially metrics based on height, relies on accurate sampling of the full depth of the canopy volume. Areas of especially dense leaf area can occlude the laser beam emitted from the PCL system, a problem common to optical remote sensing methods (Clawges et al., 2007; Côté et al., 2012; Lefsky et al., 2002b; Parker et al., 2004), constraining inference of distribution of canopy elements above such areas. Multireturn and waveform lidar have improved the penetration ability of the laser beam, but these techniques have been usually deployed on airborne platforms (e.g. Detto et al., 2015), and applied to large scale monitoring programs with high operative costs (Asner et al., 2012). Similarly, signal propagation from the GPR system though the vertical soil profile similarly diminishes with depth, meaning the lower extent of sampled soil volume is poorly defined. This may limit applications to water-limited ecosystems, where root systems extend deeply into the soil. Further, GPR resolution is such that bundles of fine roots can appear as a single large root, while very fine roots challenge detection limits; discontinuities of soil moisture and/or texture can also contribute noise (Butnor et al., 2012, 2001), which can be minimized with rigorous site-specific calibration of the GPR using conventional root coring methods can.
unexplained variation among ecosystems in above- and belowground biomass allocation patterns owing in part to variable study approaches, arbitrary scales of analysis, and sampling challenges (Mokany et al., 2006; Poorter et al., 2012). Widespread systematic and coordinated quantification of above- and belowground ecosystem structure, for example by ecological networks (Hobbie et al., 2003; Symstad et al., 2003), could transform basic biological understanding of small-scale canopy-root linkages, and lead to advances in interpreting and predicting an array of ecosystem functions dependent upon both above- and belowground structure.
Acknowledgements
We wish to thank Lucas Nave, Alex Fotis, and Conor Flynn for assistance in quantifying root biomass. We acknowledge the University of Michigan Biological Station for facilities and material support. This work was supported in part by U.S. Department of Energy's Office of Science, Office of Biological and Environmental Research, Ameriflux Management project under Flux Core Site agreement No. 7096915 through Lawrence Berkeley National Laboratory.
Literature Cited
Albert, D.A., Minc, L.D., 1987. The natural ecology and cultural history of the Colonial Point red oak stands. University of Michigan Biological Station, Pellston, Michigan, USA.
Asner, G.P., Knapp, D.E., Boardman, J., Green, R.O., Kennedy-Bowdoin, T., Eastwood, M., Martin, R.E., Anderson, C., Field, C.B., 2012. Carnegie Airborne Observatory-2: Increasing science data dimensionality via high-fidelity multi-sensor fusion. Remote Sens. Environ. 124, 454–465. doi:10.1016/j.rse.2012.06.012
Barton, C.V.M., Montagu, K.D., 2004. Detection of tree roots and determination of root diameters by ground penetrating radar under optimal conditions. Tree Physiol. 24, 1323–1331. doi:10.1093/treephys/24.12.1323
Borden, K.A., Isaac, M.E., Thevathasan, N. V., Gordon, A.M., Thomas, S.C., 2014. Estimating coarse root biomass with ground penetrating radar in a tree-based intercropping system. Agrofor. Syst. 88, 657–669. doi:10.1007/s10457-014-9722-5
Børja, I., de Wit, H.A., Steffenrem, A., Majdi, H., 2008. Stand age and fine root biomass, distribution and morphology in a Norway spruce chronosequence in southeast Norway. Tree Physiol. 28, 773–784. doi:10.1093/treephys/28.5.773
Butnor, J.R., Barton, C., Day, F.P., Johnsen, K.H., Mucciardi, A.N., Schroeder, R., Stover, D.B., 2012. Using Ground-Penetrating Radar to Detect Tree Roots and Estimate Biomass, in: Mancuso, S. (Ed.), Measuring Roots: An Updated Approach. Springer Science & Business Media, p. 397. doi:10.1007/978-3-642-22067-8
Butnor, J.R., Doolittle, J.A., Johnsen, K.H., Samuelson, L., Stokes, T., Kress, L., 2003. Utility of Ground-Penetrating Radar as a Root Biomass Survey Tool in Forest Systems. Soil Sci. Soc. Am. J. 67, 1607. doi:10.2136/sssaj2003.1607
Butnor, J.R., Doolittle, J.A., Kress, L., Cohen, S., Johnsen, K.H., 2001. Use of ground-penetrating radar to study tree roots in the southeastern United States. Tree Physiol. 21, 1269–1278. doi:11696414
Butnor, J.R., Samuelson, L.J., Stokes, T.A., Johnsen, K.H., Anderson, P.H., González-Benecke, C.A., 2016. Surface-based GPR underestimates below-stump root biomass. Plant Soil 402, 47–62. doi:10.1007/s11104-015-2768-y
Cao, L., Coops, N.C., Hermosilla, T., Innes, J., Dai, J., She, G., 2014. Using small-footprint discrete and full-waveform airborne LiDAR metrics to estimate total biomass and biomass components in subtropical forests. Remote Sens. 6, 7110–7135. doi:10.3390/rs6087110
Clawges, R., Vierling, L., Calhoon, M., Toomey, M., 2007. Use of a ground-based scanning lidar for estimation of biophysical properties of western larch (Larix occidentalis). Int. J. Remote Sens. 28, 4331–4344. doi:10.1080/01431160701243460
Detto, M., Asner, G.P., Muller-Landau, H.C., Sonnentag, O., 2015. Spatial variability in tropical forest leaf area density from Multireturn LiDAR and modelling. J. Geophys. Res. Biogeosciences 120, 1–16. doi:10.1002/2014JG002774
Fahey, R., Fotis, A.T., Woods, K.D., 2014. Quantifying canopy complexity and effects on productivity and resilience in late successional hemlock-hardwood forests. Ecol. Appl. doi:10.1890/14-1012.1
Garrity, S.R., Meyer, K., Maurer, K.D., Hardiman, B.S., Bohrer, G., 2012. Estimating plot-level tree structure in a deciduous forest by combining allometric equations, spatial wavelet analysis and airborne LiDAR. Remote Sens. Lett. 3, 443–451. doi:10.1080/01431161.2011.618814
Goetz, S., Steinberg, D., Dubayah, R., Blair, B., 2007. Laser remote sensing of canopy habitat heterogeneity as a predictor of bird species richness in an eastern temperate forest, USA. Remote Sens. Environ. 108, 254–263. doi:10.1016/j.rse.2006.11.016
Gonzalez, P., Asner, G.P., Battles, J.J., Lefsky, M.A., Waring, K.M., Palace, M., 2010. Forest carbon densities and uncertainties from Lidar, QuickBird, and field measurements in California. Remote Sens. Environ. 114, 1561–1575.
Gough, C.M., Curtis, P.S., Hardiman, B.S., Scheuermann, C., Bond-Lamberty, B., 2016. Disturbance, complexity, and succession of net ecosystem production in North America’s temperate deciduous forests. Ecosphere In press. doi:10.1002/ecs2.1375
Gough, C.M., Hardiman, B.S., Nave, L.E., Bohrer, G., Maurer, K.D., Vogel, C.S., Nadelhoffer, K.J., Curtis, P.S., 2013. Sustained carbon uptake and storage following moderate disturbance in a Great Lakes forest. Ecol. Appl. 00, 233. doi:10.1890/12-1554.1
Gough, C.M., Vogel, C.S., Hardiman, B., Curtis, P.S., 2010. Wood net primary production resilience in an unmanaged forest transitioning from early to middle succession. For. Ecol. Manage. 260, 36–41. doi:10.1016/j.foreco.2010.03.027
Gough, C.M., Vogel, C.S., Harrold, K.H., George, K., Curtis, P.S., 2007. The legacy of harvest and fire on ecosystem carbon storage in a north temperate forest. Glob. Chang. Biol. 13, 1935–1949. doi:10.1111/j.1365-2486.2007.01406.x
Gough, C.M., Vogel, C.S., Schmid, H.P., Su, H.B., Curtis, P.S., 2008. Multi-year convergence of biometric and meteorological estimates of forest carbon storage. Agric. For. Meteorol. 148, 158–170. doi:10.1016/j.agrformet.2007.08.004
Grinsted, A., Moore, J.C., Jevrejeva, S., 2004. Application of the cross wavelet transform and wavelet coherence to geophysical time series. Nonlinear Process. Geophys. 11, 561–566. doi:10.5194/npg-11-561-2004
Guo, L., Chen, J., Cui, X., Fan, B., Lin, H., 2013. Application of ground penetrating radar for coarse root detection and quantification: A review. Plant Soil 362, 1–23. doi:10.1007/s11104-012-1455-5 Hardiman, B.S., Bohrer, G., Gough, C.M., Curtis, P.S., 2013a. Canopy Structural Changes Following
Widespread Mortality of Canopy Dominant Trees. Forests 4, 537–552. doi:10.3390/f4030537 Hardiman, B.S., Bohrer, G., Gough, C.M., Vogel, C.S., Curtisi, P.S., Curtis, P.S., 2011. The role of
canopy structural complexity in wood net primary production of a maturing northern deciduous forest. Ecology 92, 1818–27.
Hardiman, B.S., Gough, C.M., Halperin, A., Hofmeister, K.L., Nave, L.E., Bohrer, G., Curtis, P.S., 2013b. Maintaining high rates of carbon storage in old forests: A mechanism linking canopy structure to forest function. For. Ecol. Manage. 298, 111–119. doi:10.1016/j.foreco.2013.02.031 Hobbie, J.E., Carpenter, Grimm, N.B., Gosz, Seastedt, T.R., 2003. The US Long Term Ecological
Research Program. Bioscience 53, 21–32. doi:10.1641/0006-3568(2003)053[0021:TULTER]2.0.CO;2
Hruska, J., Cermák, J., Sustek, S., 1999. Mapping tree root systems with ground-penetrating radar. Tree Physiol. 19, 125–130. doi:10.1093/treephys/19.2.125
minirhizotrons. Environ. Exp. Bot. 45, 263–289. doi:10.1016/S0098-8472(01)00077-6
Kirchner, J.W., 2006. Getting the right answers for the right reasons: Linking measurements, analyses, and models to advance the science of hydrology. Water Resour. Res. 42, 1–5. doi:10.1029/2005WR004362
Kristensen, T., Naesset, E., Ohlson, M., Bolstad, P. V., Kolka, R., 2015. Mapping above- and below-ground carbon pools in boreal forests: The case for airborne lidar. PLoS One 10, 1–24. doi:10.1371/journal.pone.0138450
Kumar, P., Foufoula-Georgiou, E., 1997. Wavelet Analysis for Geophysical Applications. Rev. Geophys. 35, 385–412. doi:10.1029/97RG00427
Lefsky, M.A., Cohen, W.B., Harding, D.J., Parker, G.G., Acker, S.A., Gower, S.T., 2002a. Lidar remote sensing of above-ground biomass in three biomes. Glob. Ecol. Biogeogr. 11, 393–399. Lefsky, M.A., Cohen, W.B., Parker, G.G., David, J., 2002b. Lidar Remote Sensing for Ecosystem
Studies. Bioscience 52, 19–30. doi:10.1641/0006-3568(2002)052[0019:LRSFES]2.0.CO;2
Lefsky, M.A., Harding, D., Cohen, W.B., Parker, G.G., Shugart, H.H., 1999. Surface lidar remote sensing of basal area and biomass in deciduous forests of eastern Maryland, USA. Remote Sens. Environ. 67, 83–98.
Liebman, E., Yang, J., Nave, L., Nadelhoffer, K., Gough, C., n.d. Soil Respiration in Upper Great Lakes Old-Growth Forest Ecosystems. Bios in review.
Lim, K., Treitz, P.M., Wulder, M.A., St-Onge, B., Flood, M., 2003. LiDAR remote sensing of forest structure. Prog. Phys. Geogr. 27, 88–106. doi:10.1191/0309133303pp360ra
McGuire, J.P., Mitchell, R.J., Moser, E.B., Pecot, S.D., Gjerstad, D.H., Hedman, C.W., 2001. Gaps in a gappy forest: plant resources, longleaf pine regeneration, and understory response to tree removal in longleaf pine savannas. Can. J. For. Res. 31, 765–778. doi:10.1139/x01-003
Medhurst, J.L., Battaglia, M., Cherry, M.L., Hunt, M.A., White, D.A., Beadle, C.L., 1999. Allometric relationships for Eucalyptus nitens (Deane and Maiden) Maiden plantations. Trees - Struct. Funct. 14, 91–101.
Medvigy, D., Wofsy, S.C., Munger, J.W., Hollinger, D.Y., Moorcroft, P.R., 2009. Mechanistic scaling of ecosystem function and dynamics in space and time: Ecosystem Demography model version 2. J. Geophys. Res. 114, 1–21. doi:10.1029/2008JG000812
Mokany, K., Raison, R.J., Prokushkin, A.S., 2006. Critical analysis of root: Shoot ratios in terrestrial biomes. Glob. Chang. Biol. 12, 84–96. doi:10.1111/j.1365-2486.2005.001043.x
Monserud, R. a., Sterba, H., 1996. A basal area increment model for individual trees growing in even- and uneven-aged forest stands in Austria. For. Ecol. Manage. 80, 57–80. doi:10.1016/0378-1127(95)03638-5
Nave, L.E., Gough, C.M., Maurer, K.D.D., Bohrer, G., Hardiman, B.S., Le Moine, J., Munoz, a. B., Nadelhoffer, K.J., Sparks, J.P., Strahm, B.D., Vogel, C.S., Curtis, P.S., 2011. Disturbance and the resilience of coupled carbon and nitrogen cycling in a north temperate forest. J. Geophys. Res. 116, G04016. doi:10.1029/2011JG001758
Nave, L.E., Sparks, J.P., Le Moine, J., Hardiman, B.S., Nadelhoffer, K.J., Tallant, J.M., Vogel, C.S., Strahm, B.D., Curtis, P.S., 2014. Changes in soil nitrogen cycling in a northern temperate forest ecosystem during succession. Biogeochemistry. doi:10.1007/s10533-014-0013-z
Nelson, R., Parker, G., Hom, M., 2003. A portable airborne laser system for forest inventory. Photogramm. Eng. Remote Sensing 69, 267–273.
Ostertag, R., 1998. Belowground Effects of Canopy Gaps in a Tropical Wet Forest. Ecology 79, 1294– 1304.
Parker, G.G., Harding, D.J., Berger, M.L., 2004. A portable LIDAR system for rapid determination of forest canopy structure. J. Appl. Ecol. 41, 755–767.
Parker, G.G., Russ, M.E., 2004. The canopy surface and stand development: assessing forest canopy structure and complexity with near-surface altimetry. For. Ecol. Manage. 189, 307–315. doi:10.1016/j.foreco.2003.09.001
Parsons, W.F.J., Knight, D.H., Miller, S.L., 2016. Root Gap Dynamics in Lodgepole Pine Forest : Nitrogen Transformations in Gaps of Different Size. Ecol. Appl. 4, 354–362.
leaves, stems and roots: Meta-analyses of interspecific variation and environmental control. New Phytol. 193, 30–50. doi:10.1111/j.1469-8137.2011.03952.x
Purbopuspito, J., Van Rees, K.C.J., 2002. Root distribution at various distances from clove trees growing in Indonesia. Plant Soil 239, 313–320. doi:10.1023/A:1015096119071
Raz-Yaseef, N., Koteen, L., Baldocchi, D.D., 2013. Coarse root distribution of a semi-arid oak savanna estimated with ground penetrating radar. J. Geophys. Res. Biogeosciences 118, 135– 147. doi:10.1029/2012JG002160
Reich, P.B., 2012. Key canopy traits drive forest productivity. Proc. R. Soc. B-Biological Sci. 279, 2128–2134. doi:10.1098/rspb.2011.2270
Ritter, E., Starr, M., Vesterdal, L., 2005. Losses of nitrate from gaps of different sizes in a managed beech (Fagus sylvatica) forest. Can. J. For. Res. Can. Rech. For. 35, 308–319. doi:10.1139/x04-185 Roering, J.J., Marshall, J., Booth, A.M., Mort, M., Jin, Q., 2010. Evidence for biotic controls on
topography and soil production. Earth Planet. Sci. Lett. 298, 183–190. doi:10.1016/j.epsl.2010.07.040
Samuelson, L.J., Stokes, T. a, Butnor, J.R., Johnsen, K.H., Gonzalez-benecke, C. a, Anderson, P., Jackson, J., Ferrari, L., Martin, T. a, Cropper, W.P., 2014. Ecosystem carbon stocks in Pinus palustris forests. Can. J. For. Res. 486, 476–486. doi:10.1139/cjfr-2013-0446
Schmid, H.P., Su, H.B., Vogel, C.S., Curtis, P.S., 2003. Ecosystem-atmosphere exchange of carbon dioxide over a mixed hardwood forest in northern lower Michigan. J. Geophys. Res. 108, 19. doi:4417 10.1029/2002jd003011
Schroeer, A.E., Hendrick, R.L., Harrington, T.B., 1999. Root, ground cover, and litterfall dynamics within canopy gaps in a slash pine (Pinus elliottii Engelm.) dominated forest. Écoscience 6, 548–555.
Shachnovich, Y., Berliner, P.R., Bar, P., 2008. Rainfall interception and spatial distribution of throughfall in a pine forest planted in an arid zone. J. Hydrol. 349, 168–177. doi:10.1016/j.jhydrol.2007.10.051
Stover, D.B., Day, F.P., Butnor, J.R., Drake, B.G., 2007. Effect of Elevated Co 2 on Coarse-Root Biomass in Florida Scrub Detected By Ground-Penetrating Radar. Ecology 88, 1328–1334. Symstad, A.J., Chapin, F.S., Wall, D.H., Gross, K.L., Huenneke, L.F., Mittelbach, G.G., Peters, D.P.C.,
Tilman, D., 2003. Long-Term and Large-Scale Perspectives on the Relationship between Biodiversity and Ecosystem Functioning. Bioscience 53, 89. doi:10.1641/0006-3568(2003)053[0089:LTALSP]2.0.CO;2
Taskinen, O., Ilvesniemi, H., Kuuluvainen, T., Leinonen, K., 2003. Response of fine roots to an experimental gap in a boreal Picea abies forest. Plant Soil 255, 503–512. doi:10.1023/A:1026077830097
Vierling, K.T., Vierling, L.A., Gould, W.A., Martinuzzi, S., Clawges, R.M., 2008. Lidar: shedding new light on habitat characterization and modeling. Front. Ecol. Environ. 6, 90–98. doi:10.1890/070001
Watson, A., O’Loughlin, C., 1990. Structural root morphology and biomass of three age-classes of Pinus radiata. New Zeal. J. For. Sci. 20, 97–110.
Wirth, C., Schumacher, J., Schulze, E.-D., 2004. Generic biomass functions for Norway spruce in Central Europe--a meta-analysis approach toward prediction and uncertainty estimation. Tree Physiol. 24, 121–139. doi:10.1093/treephys/24.2.121
© 2016 by the authors; licensee Preprints, Basel, Switzerland. This article is an open access article distributed under the terms and conditions of the Creative Commons by