Performance Evaluation of Face Recognition
based on Multiple Feature Descriptors using
Euclidean Distance Classifier
Sunil Swamilingappa Harakannanavar11
S. G. Balekundri Institute of Technology, Belagavi-590010, Karnataka, India [email protected]
Prashanth Chikkanayakanahalli Renukamurthy2 2
Dr. Ambedkar Institute of Technology, Bangalore-560056, Karnataka, India [email protected]
Sapna Patil3 and Kori Basava Raja3 3
University Visvesvaraya College of Engineering, Bangalore, Karnataka, India
---ABSTRACT---Personal Identification based on face recognition is receiving extensive attention over the last few years in both research and real time applications due to increasing emphasis on security. In this paper, Face Recognition based on Stationary Wavelet Transform (SWT), Discrete Cosine Transform (DCT) and Local Ternary Pattern (LTP) is presented. Face images are resized. SWT and DCT are applied on face images to produce features. LTP is applied on SWT features. SWT, DCT and LTP features are concatenated to get final features. Features of test and database images are compared using Euclidean distance. It is found that Total Success Rate of the proposed system is better than existing systems.
Keywords -Face identification, Stationary Wavelet Transform, Discrete Cosine Transform, Local Ternary Pattern, Success Rate.
--- Date of Submission: July 24, 2018 Date of Acceptance: Aug 28, 2018 ---
I.
INTRODUCTIONT
he personal identification is an actively growing area of research. The traditional personal authentication measures such as cards and passwords may not be enough for secure authentication of human identity. Biometric traits are efficiently used for secure authentication. Voice, face, iris, retina, fingerprint, Signature are commonly used for authentication. The physiological and behavioral characteristics of human beings are measured as biometrics. These are used for uniquely recognizing humans in seamless applications such as identity access management, access control and used to identify individuals in groups for surveillance application. Face recognition is one such biometric method which authenticates individuals by face recognition. The technology has developed for automatic face recognition with artificial intelligence. Early face identification systems used simple geometric models, but the recognition process has now changed with complex mathematical modeling, tools, techniques and matching concepts. Major improvements and initiatives in the past ten years have propelled face recognition technology into the focus. Face recognition system is a computer application which automatically identifies or verifies a person based on a digital image acquired from any source. The face recognition algorithms are classified in accordance with the overall techniques used. The commonly used approaches are appearance based and geometric based. The appearance based approach extracts features by considering overall image as input and in geometric basedapproach; the facial or physiological properties are elicited. The feature extraction process is normally rule based, which uses some parameters, transformations, tools or techniques to represent high dimensional image data. The important performance metrics used to analyze any algorithm are False Rejection Rate (FRR), False Acceptance Rate (FAR), Equal Error Rate (EER), Recognition Rate (RR) and Success Rate (SR).
The rest of this paper is organized as follows. Section II briefly gives overview of the related work. Section III presents the proposed model. Section IV presents the algorithm for proposed model. Section V reports performance analysis and section VI concludes the proposed work.
II.
R
ELATEDW
ORKlearning approach for face recognition based on Local Binary Pattern Network to extract and compare high order level over complete features in the multi order hierarchy. Prateekshit Pandey et al., [4] explained face recognition model with the concept of scattering wavelet for illicit drug abuse variations. SCATNET is deep wavelet based architecture for texture feature representation at multiple scales and orientation. Yong ping Chen et al., [5] proposed face recognition system based on extended local binary pattern. Features are extracted by LBP and PCA for reducing dimension. Sunil kumar et al., [6] explained extraction of informative regions of a face for facial expression recognition, where main intension is to extract useful features from informative regions of face where Local Binary Pattern (LBP) and IRE model will estimates the importance of sub regions. Padma Suresh et al., [7] discussed face recognition using curvelet feature extraction on JAFEE database. Patched Geodesic texture transform (PGTT) where the experiments were conducted using BUDFE. Gradient feature matching technique using single image is applied. Sushma et al., [8] proposed face recognition by using fusion of PCA and LDA for dimensionality reduction and feature extraction purpose. Zhao L hong et al., [9] described face recognition based on Local Binary Pattern (LBP) and Genetic algorithm. The illumination algorithm that reduces the impact of illumination on face by Gamma Correction, Histogram Equalization, Logarithmic transformation and Exponential transform where the system finally selects the approach based on Histogram Equalizations Nearest, Neighbor (NN) and Super Vector Machine (SVM) are used for classification. Chunlei Peng et al., [10] discussed graphical representation of face recognition. The weight matrices generated from the Markov networks are regarded as graphical representations. The similarity between the weight matrices of heterogeneous face images is used for matching. A coupled representation similarity metric (CRSM) is explained to measure the similarity between graphical representations. Zhengzheng and Yong [11] proposed development of face recognition system based on PCA and LBP for Intelligent Anti-Theft Doors. The system uses LBP algorithm for extracting the facial features and PCA algorithm for reducing the dimensions of the facial features combining with Euclidian distance method for future matching which helps to realize the face recognition. Haifeng and Xiaowei [12] explained face recognition based on Mobile Phone System. It consists of three parts where the first part is to get the human face images from the mobile phone camera and then for the obtained images carry out some work like cropping, scaling, alignment, removing the illumination effect and so on to get the proper preprocessed image. The Convolution Neural Network (CNN) is used to extract the main features from face. Realization of face retrieval and matching is obtained by using Cosine Similarity and Euclidian Distance method. Fakhir et al., [13] proposed face recognition for images with various pose. The authors focus on identification and verification of an individual person when they are in the different poses. There are three main aspects that are used to get
Image Features (BSIF) are used for feature extraction. Finally collaborative classifiers were used for classification purpose. Experiments were conducted on multi spectral face database consisting of 168 subjects using various state-of-the-art feature extraction methods. Navaneeth Bodla et al., [21] developed a deep heterogeneous feature fusion network to provide the information related to the features generated by various Deep Convolutional Neural Networks (DCNNs) for creating template based recognition. The proposed approach effectively combines the information of different deep features by generating a more descriptive template representation which preserves in feature space and by jointly learning non-linear high-dimensional projection of deep features. Ze Lu et al., [22] described the pre-trained Convolutional Neural Network (CNN) and fine-tuned CNN models, those could not provide better facial recognition rate. So to overcome the problem faced, the author proposed combination of non-CNN features with image representations learned by Convolutional Neural Networks. Experiments were conducted on LFW and FRGC datasets using pre-trained CNN method and VGG face. Menglu Wn et al., [23] developed an algorithm based on combined Local Binary Pattern (LBP) and Local non negative matrix factorization (LNMF). Histogram Normalization is used as a preprocessing approach for enhancement of facial image. LBP and LNMF are used for feature extraction and the co-efficient-matrix can be obtained through test sample database. Nearest Neighbor is used for classification purpose. Experiments were conducted on two popular public ORL database and Yale database. Jesus Olivares-mercado et al., [24] developed an algorithm based on Local Binary Pattern (LBP) to recognize the face and is implemented in a smart phone with Android OS. The input facial image is captured using Smartphone and Local Binary Pattern is used for extracting the features of facial image. Euclidean Distance is used as a classifier for classify the genuine and imposter candidate. Experiments were conducted on AR face database. Ashraf S Huwedi et al., [25] described Regularized Linear Discriminant analysis method during occlusions and illumination variations. The preprocessing technique used is Histogram Equalization with de-noising filter (Haar-wavelet de-noising filter) for enhancing the facial image. Once the preprocessing approach is completed, next step is feature extraction which extracts the features of facial image by powerful Statistical Regularized Linear Discriminant Analysis (RLDA). Finally Cosine distance is used as classifier. Experiments were conducted on Extended Yale B database. Zhihan Xie et al., [26] developed an algorithm that fuses Binary Pattern (LBP) and Histogram of Oriented Gradients (HOG). Histogram Equalization is used as pre-processing normalization to enhance the quality of image. LBP is used for extracting the texture features of an infrared face and edge features from original infrared image were extracted using HOG. Finally Multiple Kernel Learning technique is used for fusing the texture features and edge features where Support Vector Machine (SVM) is used as classifier.
Neural Network is used as a classifier. Experiments were conducted on JAFFE, CK+ and MS-Kinect datasets. M Sharmila Kumari and Swathi Salian [35] explained a fusion of Discrete Cosine Transform (DCT) and Principal Component Analysis (PCA) to extract the facial features. Experiments were conducted on ORL, UMIST and real datasets. Nishat Banu Nayakwadi et al., [36] described Local Ternary Pattern (LTP) and signed bit multiplication to extract the local features of face. Test images are compared with the training images using Euclidean Distance classifier. Experiments were conducted on ORL face database.
III.
P
ROPOSED MODELIn this section, proposed model of face recognition is discussed and is given in Figure 1. The face images are read from the database and preprocessing is performed to get the desired part of the face and exclude the unwanted information. The desired features are extracted using SWT, DCT and LTP methods. The matching between the database image and test image is done using Euclidean distance.
Fig 1. Model of the proposed face recognition system
The input face images are resized to 128*128 for making all the images of same size. The Stationary Wavelet Transform (SWT) and Discrete Cosine Transform (DCT) are applied separately on the preprocessed images to get
the corresponding coefficients. The Local Ternary Pattern (LTP) is applied on the SWT coefficients. Then SWT, LTP and DCT coefficients are concatenated to obtain final features. The database and test final features are compared using Euclidean distance (ED) to compute performance parameters.
3.1 Face Databases
The Various face databases such as Indian Female, ORL and Combined face database are used to test the proposed model for performance analysis.
3.1.1Indian Female Database
The Indian Female database [37]has 11 persons with 22 images per person i.e., totally it has 240 images. The face images are captured with different facial emotional expressions based on facial orientations. The samples of face image of a person with each image of size 640*480 are shown in Figure 2.
Fig 2: Samples of Indian Female Images 3.1.2 Olivetti Research Laboratory Database (ORL)
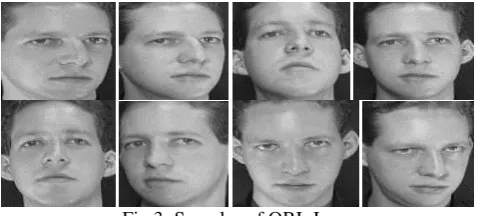
The ORL database [38] has 40 persons with 10 images per person i.e., totally it has 400 images. The face images are captured with different facial emotional expressions based on facial orientations and lighting conditions. The samples of face image of a person with each image of size 92*112 are shown in Figure 3.
Fig 3: Samples of ORL Images 3.1.3Combined Face Database
Fig 4: Samples of Combined face Image 3.2 Stationary Wavelet Transform (SWT) [34]
Wavelet Transform is basically used in feature detection of MRI, signal de-noising, pattern recognition and brain image classification. However, the discrete wavelet transform (DWT) is lack of translation variant property which can be nullified by using Stationary Wavelet Transform (SWT). In SWT even if the signal is shifted, the transformed coefficient will not change and also performs better in de-noising and edge detecting. In contrast to DWT, SWT can be applied to any arbitrary size of images rather than size of power of two and has shown better fusion performance in medical and other images. SWT is similar to DWT and is commonly known as algorithm “trous”. Translation invariance is achieved by removing the down samples and up samples in the DWT and up sampling the coefficients by the factor of 2j-1 in the jth level of the algorithm. The SWT is redundant technique as the output of each level of SWT contains the same number of samples as input and improves the resolution of edges details with three groups of wavelet co-efficients. The disadvantage of Shift-Variant nature of discrete wavelet transform due to decimation is eliminated in Stationary Wavelet Transform (SWT). The input signal is passed through low pass and high pass filter to obtain significant and detailed information without decimation. The number of co-efficients in each sub-band is same as that of input signal due to no decimation. The input Image of M*N is passed through low-pass filter and high-pass filter and the corresponding outputs are also having dimensions of M*N. The outputs of low-pass filter and high-pass filter are further passed through low pass and high-pass filter to obtain four sub-bands viz., LL, LH, HL and HH as shown in Figure 5.
Fig 5: SWT Decomposition
The dimensions of all four sub-bands are equivalent to input image. The SWT is applied on face image and the corresponding sub-band images are shown in Figure 6.
(a) Original image (128*128)
(b) LL Band (c) LH Band (d) HL Band (e) HH Band Fig 6: SWT four sub-band images
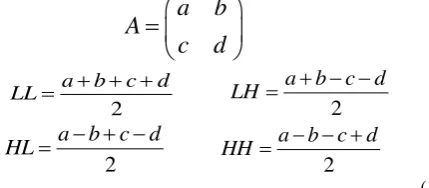
The LL band image is almost same as that of the original image and has significant information of the original image. The LH band image has horizontal details of the original image. The HL band image has vertical details of the original image. The HH band image has diagonal details of the original image. For a 2x2 matrix where LL– Approximation Band, LH–Horizontal Band, HL–Vertical Band and LL–Diagonal Band are calculated using the equation 1.
a
b
A
c
d
2
a b c d
LL
2
a
b c
d
LH
2
a b c
d
HL
2
a b c
d
HH
………(1)
3.3 Discrete Cosine Transform(DCT) [35]
Discrete Cosine Transform (DCT) produces coefficients that are concentrated in the low frequency region. Therefore, it is said to have very good energy compaction properties. The 2D discrete cosine transform X(q1,q2) of an image or 2D signal x(m1, m2) of size M1* M2 is defined by the Equation 2.
1 2 1 1 2 2
1 2 1 2 1 2
1 2
1 2
1 1 (2 1) (2 1)
( , ) ( ) ( ) ( , )cos cos
2 2
0 0
M M m q m q
X q q q q x m m
M M
m m
Where 1 1
2 2
0 1
0 1
q M
q M
………(2)
3.4 Local Ternary Pattern (LTP) [36]
LTP is a ternary or 3-valued code. In LTP the neighborhood pixel values are compared with central pixel. LTP makes use of a threshold constant ‘t’ to threshold pixel values into three different code values that is 0, 1 and -1 and is defined by the Equation 3.
1,
LTP S( , ) 0,
1, ( )
whenPi ic t
P i when P ii c t
i c
whenPi ic t
………(3)
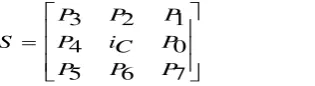
Let us Consider a 3x3 matrix of a face grey scale image.
3 2 1
4 0
5 6 7
P P P
S P iC P
P P P
………(4)
Whereic is central pixel intensity value, Pi is neighboring pixel intensity value t is the threshold constant. Threshold values can opt any of the value between 0 and 10, and threshold value basically suggests the covering of essential information or rather retaining the information. The face is the smooth structure. Choosing the wrong threshold value to threshold the pixels shall lead to loss of information. LTP encoding is illustrated in Figure 8 with t=5.
Fig 8: Illustration of transitions of LTP with t=5. Consider the 3x3 matrix with central pixel ic value=9. As the pattern uses Equation 4 to compute the ternary values, it is followed as (ic+t) = (9+5) =14 and (ic – t) = (9-5) = 4.
i) 5<14 as well as 5>4 so coded as 0 ii) 17>14 so coded as 1
iii) 29>14 so coded as 1
iv) 1<4 so coded as -1
v) 9>4 as well as 9<14 so coded as 0 vi) 2<4 so coded as -1
vii) 3<4 so coded as -1 viii) 17>14 so coded as 1
Thus the ternary coding of a 3x3 matrix as shown in the Figure 8 is coded as 0(-1)1101(-1)(-1). The LTP produces Upper pattern and Lower pattern as shown in Figure 8.
For upper pattern, value 1 is retained the same while values 0 and -1 are made 0.
The ternary coded value 0(-1)1101(-1)(-1) is now coded using equation 4 and the binary value is 00110100 for upper pattern, this binary value is combined with reordering vector 1 2 4 8 16 32 64 128 and the result obtained as 44.
(0x1+0x2+1x4+1x8+0x16+1x32+0x64+0x128= 44).
For lower pattern, value -1 is retained the same while values 0 and 1 made 0
The ternary coded value 0(-1)1101(-1) (-1) is now coded using equation 4 and the binary value is 01000011 for lower pattern, this binary value is combined with reordering vector 1 2 4 8 16 32 64 128 and the result obtained as 194.
(0x1+1x2+0x4+0x8+0x16+0x32+1x64+1x128= 194).
3.5 Euclidean Distance (ED)
Euclidean distance is used as a classifier for matching. It is also called Pythagorean distance. The minimum Euclidean distance gives the similarity between the unknown face image that is being tested and the ones in the database. In Cartesian coordinates, if p= (p1, p2, p3,….pn) and q=(q1, q2, q3, …..qn) are two points in Euclidean space, then the distance from p to q is given by the formula defined by Equation 5.
2 2
2 2 2 1
1
)
(
)
...
(
)
(
)
,
(
p
q
q
p
q
p
q
np
nd
………(5)
IV.
P
ROPOSEDF
ACEM
ODEL4.1.Problem Definition:
The proposed biometric algorithm using SWT, DCT and LTP in which the authenticity of the test face image is verified to identify a person effectively.
4.2.Objectives:
The objectives of the proposed algorithm are as follows:
i) Increase the Total Success Rate (TSR).
Table 1. Proposed algorithm (SWT, DCT and LTP)
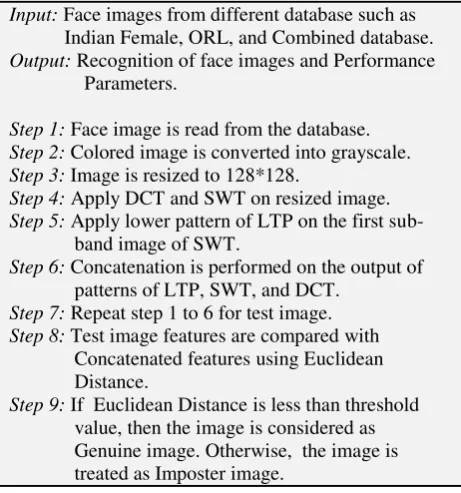
Input: Face images from different database such as Indian Female, ORL, and Combined database. Output: Recognition of face images and Performance Parameters.
Step 1: Face image is read from the database. Step 2: Colored image is converted into grayscale. Step 3: Image is resized to 128*128.
Step 4: Apply DCT and SWT on resized image. Step 5: Apply lower pattern of LTP on the first sub- band image of SWT.
Step 6: Concatenation is performed on the output of patterns of LTP, SWT, and DCT.
Step 7: Repeat step 1 to 6 for test image. Step 8: Test image features are compared with Concatenated features using Euclidean Distance.
Step 9: If Euclidean Distance is less than threshold value, then the image is considered as Genuine image. Otherwise, the image is treated as Imposter image.
V.
P
ERFORMANCEA
NALYSISIn this section, the definitions of performance parameters and performance analysis of proposed model are discussed. The proposed face recognition model is tested on Indian Female, ORL and combined face database for varying PID and POD combinations and results are discussed as follows. The percentage values of performance parameters such as EER, optimum and maximum TSR of the proposed system for Indian Female, ORL and Combined face database are computed for different combinations of PID and PODs. It is observed that the results are improved for increasing number of persons outside the database.
5.1 Definitions of Performance Parameters
5.1.1 False Acceptance Rate (FAR):
The number of unauthorized persons is accepted as authorized persons. It is the ratio of the number of unauthorized persons accepted to the total number of persons in the outside database and given in Equation 6.
Number of unauthorized persons accepted FAR
Total number of persons out of database
………(6)
5.1.2 False Rejection Rate (FRR):
The number of authorized persons rejected as unauthorized person. It is the ratio of number of authorized persons rejected to the total number of persons in the database as given in Equation 7.
Number of persons rejected FRR
Total Number of persons in database
………(7)
5.1.3True Success Rate (TSR):
The number of authorized persons recognized correctly in the database. It is the ratio of number of persons correctly matched to the total number of persons in the database and is given in Equation 8.
Number of persons correctly matched TSR
Total number of persons in the database
………(8)
5.1.4Equal Error Rate (EER):
It is the measure of trade-off between FAR and FRR and is given in Equation 9.
EERFAR - FRR
………(9)
5.2 Analysis of Performance Parameters
The performance parameters such as FAR, FRR, TSR and EER for different databases such as Indian Female ORL and Combined face database are discussed in detail for the proposed model.
5.2.1 Analysis with Indian Female database:
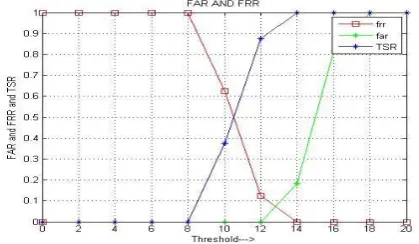
The percentage variation of FAR, FRR and TSR with threshold for Indian female database is given in table 2. The percentage values of FAR and TSR increases from 0 to maximum value as threshold increases. The percentage value of FRR decreases from 100 to 0 as threshold values increases. The maximum success rate of the proposed algorithm for Indian female database is 100% at a threshold of 14. The percentage variation of FAR and FRR with threshold for Indian female database is shown in Figure 9. As threshold value increases, the values of FAR and FRR decreases and increases respectively. It is observed that the value of EER is 0.09 for the threshold value of 12.6.
Table 2. Percentage Variations of FAR, FRR and TSR with Threshold for PID and POD of 8 and 8
8:8 THRESHOLD
%Max
TSR FRR FAR
0 0 1 0
2 0 1 0
4 0 1 0
6 0 1 0
8 0 1 0
10 38 0.6 0
12 88 0.1 0
14 100 0 0.25
16 100 0 1
18 100 0 1
20 100 0 1
Table 3 shows the percentage values of FAR and TSR increases from 0 to maximum value as threshold increases. The percentage value of FRR decreases from 100 to 0 as threshold values increases. The maximum success rate of the proposed algorithm for Indian female database is 100% at a threshold of 14. Its graphical representation is shown in Figure 10. It is observed that the value of EER is 0.13 for the threshold value of 13.
Fig 10: Variations of performance parameters with threshold for PID and POD of 11 and 8
Table 3. Percentage Variations of FAR, FRR and TSR with Threshold for PID and POD of 11 and 8
11:8 THRESHOLD
%Max
TSR FRR FAR
0 0 1 0
2 0 1 0
4 0 1 0
6 0 1 0
8 0 1 0
10 28 0.7 0
12 72 0.28 0
14 100 0 0.25
16 100 0 0.75
18 100 0 1
20 100 0 1
Table 4 shows the percentage values of FAR and TSR increases from 0 to maximum value as threshold increases. The percentage value of FRR decreases from 100 to 0 as
threshold values increases. The maximum success rate of the proposed algorithm for Indian female database is 95% at a threshold of 14. Its graphical representation is shown in Figure 11. It is observed that the value of EER is 0.15 for the threshold value of 13.2.
Fig 11: Variations of performance parameters with threshold for PID and POD of 14 and 8
Table 4. Percentage Variations of FAR, FRR and TSR with Threshold for PID and POD of 14 and 8
14:8 THRESHOLD
%Max
TSR FRR FAR
0 0 1 0
2 0 1 0
4 0 1 0
6 0 1 0
8 0 1 0
10 21 0.81 0
12 65 0.37 0
14 100 0 0.25
16 100 0 0.5
18 100 0 1
20 100 0 1
Table 5 shows the percentage values of FAR and TSR increases from 0 to maximum value as threshold increases. The percentage value of FRR decreases from 100 to 0 as threshold values increases. The maximum success rate of the proposed algorithm for Indian female database is 100% a threshold of 14.
Its graphical representation is shown in Figure 12. It is observed that the value of EER is 0.08 for the threshold value of 12.7.
Table 5. Percentage Variations of FAR, FRR and TSR with Threshold for PID and POD of 8 and 11
8:11 THRESHOLD
%Max
TSR FRR FAR
0 0 1 0
2 0 1 0
4 0 1 0
6 0 1 0
8 0 1 0
10 38 0.6 0
12 88 0.1 0
14 100 0 0.18
16 100 0 0.85
18 100 0 1
20 100 0 1
Table 6 shows the percentage values of FAR and TSR increases from 0 to maximum value as threshold increases. The percentage value of FRR decreases from 100 to 0 as threshold values increases. The maximum success rate of the proposed algorithm for Indian female database is 100% a threshold of 14. Its graphical representation is shown in Figure 13. It is observed that the value of EER is 0.05 for the threshold value of 12.9.
Fig 13: Variations of performance parameters with threshold for PID and POD of 8 and 14
Table 6. Percentage Variations of FAR, FRR and TSR with Threshold for PID and POD of 8 and 14
8:14 THRESHOLD
%Max
TSR FRR FAR
0 0 1 0
2 0 1 0
4 0 1 0
6 0 1 0
8 0 1 0
10 38 0.6 0
12 88 0.1 0
14 100 0 0.15
16 100 0 0.7
18 100 0 1
20 100 0 1
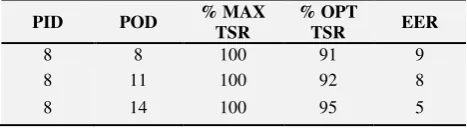
The performance parameters such as percentage maximum TSR, optimum TSR and EER values are tabulated for variations in POD keeping PID constant at 8, is given in
table 7. The maximum TSR values are constant at 100 for variations in POD. The percentage OTSR and EER values increases and decreases for increase in POD values from 8 to 14 keeping PID constant at 8.
Table 7. Variations of performance parameters with variations in POD for constant PID at 8
PID POD % MAX TSR
% OPT
TSR EER
8 8 100 91 9
8 11 100 92 8
8 14 100 95 5
The performance parameters such as percentage maximum TSR, optimum TSR and EER values are tabulated for variations in PID keeping POD constant at 8, is given in table 8. The maximum TSR values are constant at 100 for variations in PID in case of PID=8 and 11, while maximum TSR is 95 for PID of 14. The percentage OTSR and EER values increases and decreases for increase in POD values from 8 to 14 keeping POD constant at 8.
Table 8. Variations of performance parameters with variations in PID for constant POD at 8
PID POD % MAX TSR
% OPT
TSR EER
8 8 100 91 9
11 8 100 87 13
14 8 95 85 15
5.2.2 Analysis with ORL database:
The percentage variation of FAR, FRR and TSR with threshold for ORL database is given in table 9. The percentage values of FAR and TSR increases from 0 to maximum value as threshold increases. The percentage value of FRR decreases from 100 to 0 as threshold values increases. The maximum success rate of the proposed algorithm for ORL database is 100% at a threshold of 20. The percentage variation of FAR and FRR with threshold for ORL database is shown in Figure 14. As threshold value increases, the percentage values of FAR and FRR decreases and increases respectively. It is observed that the value of EER is 0.17 for the threshold value of 16.8.
Table 9. Percentage Variations of FAR, FRR and TSR with Threshold for PID and POD of 10 and 10
10:10 THRESHOLD
%Max
TSR FRR FAR
0 0 1 0
2 0 1 0
4 0 1 0
6 0 1 0
8 0 1 0
10 0 1 0
12 0 1 0
14 20 0.8 0
16 80 0.2 0.1
18 90 0.1 0.3
20 100 0 1
Table 10 shows the percentage values of FAR and TSR increases from 0 to maximum value as threshold increases. The percentage value of FRR decreases from 100 to 0 as threshold values increases. The maximum success rate of the proposed algorithm for ORL database is 100% at a threshold of 20. Its graphical representation is shown in Figure 15. It is observed that the value of EER is 0.16 for the threshold value of 16.9.
Fig 15: Variations of performance parameters with threshold for PID and POD of 10 and 20
Table 10. Percentage Variations of FAR, FRR and TSR with Threshold for PID and POD of 10 and 20
10:20 THRESHOLD
%Max
TSR FRR FAR
0 0 1 0
2 0 1 0
4 0 1 0
6 0 1 0
8 0 1 0
10 0 1 0
12 0 1 0
14 20 0.8 0
16 80 0.2 0.02
18 90 0.1 0.54
20 100 0 1
Table 11 shows the percentage values of FAR and TSR increases from 0 to maximum value as threshold increases. The percentage value of FRR decreases from 100 to 0 as
threshold values increases. The maximum success rate of the proposed algorithm for ORL database is 100% at a threshold of 18. Its graphical representation is shown in Figure 16. It is observed that the value of EER is 0.20 for the threshold value of 16.7.
Fig 16: Variations of performance parameters with threshold for PID and POD of 10 and 30
Table 11. Percentage Variations of FAR, FRR and TSR with Threshold for PID and POD of 10 and 30
10:30 THRESHOLD
%Max
TSR FRR FAR
0 0 1 0
2 0 1 0
4 0 1 0
6 0 1 0
8 0 1 0
10 0 1 0
12 0 1 0
14 20 0.8 0
16 70 0.3 0.12
18 100 0 0.55
20 100 0 1
Table 12 shows the percentage values of FAR and TSR increases from 0 to maximum value as threshold increases. The percentage value of FRR decreases from 100 to 0 as threshold values increases. The maximum success rate of the proposed algorithm for ORL database is 85% at a threshold of 20. Its graphical representation is shown in Figure 17. It is observed that the value of EER is 0.27 for the threshold value of 17.2.
Table 12. Percentage Variations of FAR, FRR and TSR with Threshold for PID and POD of 20 and 10
20:10 THRESHOLD
%Max
TSR FRR FAR
0 0 1 0
2 0 0.95 0
4 0 0.95 0
6 0 0.95 0
8 0 0.95 0
10 0 0.95 0
12 0 0.95 0
14 10 0.85 0
16 65 0.3 0
18 75 0.2 0.4
20 85 0 1
Table 13 shows the percentage values of FAR and TSR increases from 0 to maximum value as threshold increases. The percentage value of FRR decreases from 100 to 0 as threshold values increases. The maximum success rate of the proposed algorithm for ORL database is 83.33% at a threshold of 20. Its graphical representation is shown in Figure 18. It is observed that the value of EER is 0.28 for the threshold value of 16.7.
Fig 18: Variations of performance parameters with threshold for PID and POD of 30 and 10
Table 13. Percentage Variations of FAR, FRR and TSR with Threshold for PID and POD of 30 and 10
30:10 THRESHOLD
%Max
TSR FRR FAR
0 0 1 0
2 0 0.95 0
4 0 0.95 0
6 0 0.95 0
8 0 0.95 0
10 0 0.95 0
12 5 0.93 0
14 15 0.82 0
16 68 0.3 0
18 80 0.12 0.6
20 82 0 1
The performance parameters such as percentage maximum TSR, optimum TSR and EER values are tabulated for
variations in POD keeping PID constant at 10, is given in table 14. The maximum TSR values are constant at 100 for variations in POD. The percentage OTSR and EER values increases and decreases for increase in POD values from 10 to 30 keeping PID constant at 10.
Table 14. Variations of performance parameters with variations in POD for constant PID at 10
PID POD % MAX TSR
% OPT
TSR EER
10 10 100 83 17
10 20 100 84 16
10 30 100 80 20
The performance parameters such as percentage maximum TSR, optimum TSR and EER values are tabulated for variations in PID keeping POD constant at 10, is given in table 15. The maximum TSR values are varying with 100 for variations in PID of 10, 85 for variations in PID of 20 and 83.33 for variations in PID of 30. The percentage OTSR and EER values increases and decreases for increase in PID values from 10 to 30 keeping POD constant at 10.
Table 15. Variations of performance parameters with variations in POD for constant POD at 10
PID POD % MAX TSR
% OPT
TSR EER
10 10 100 83 17
20 10 85 73 27
30 10 83.33 72 28
5.2.3 Analysis with Indian Female database:
The percentage variation of FAR, FRR and TSR with threshold for combined face database is given in table 16. The percentage values of FAR and TSR increases from 0 to maximum value as threshold increases. The percentage value of FRR decreases from 100 to 0 as threshold values increases. The maximum success rate of the proposed algorithm for combined face database is 100% at a threshold of 14. The percentage variation of FAR and FRR with threshold for combined face database is shown in Figure 19. As threshold value increases, the percentage values of FAR and FRR decreases and increases respectively. It is observed that the value of EER is zero for the threshold value of 14.
Table 16. Percentage Variations of FAR, FRR and TSR with Threshold for PID and POD of 20 and 40
20:40 THRESHOLD
%Max
TSR FRR FAR
0 0 1 0
2 0 1 0
4 0 1 0
6 0 1 0
8 35 0.65 0
10 85 0.15 0
12 90 0.1 0
14 100 0 0
16 100 0 0.05
18 100 0 0.3
20 100 0 0.68
Table 17 shows the percentage values of FAR and TSR increases from 0 to maximum value as threshold increases. The percentage value of FRR decreases from 100 to 0 as threshold values increases. The maximum success rate of the proposed algorithm for combined face database is 100% at a threshold of 14. Its graphical representation is shown in Figure 20. It is observed that the value of EER is zero for the threshold value of 14.
Fig 20: Variations of performance parameters with threshold for PID and POD of 40 and 40
Table 17. Percentage Variations of FAR, FRR and TSR with Threshold for PID and POD of 40 and 40
40:40 THRESHOL
D
%Max
TSR FRR FAR
0 0 1 0
2 0 1 0
4 0 1 0
6 0 1 0
8 38 0.61 0
10 72 0.28 0
12 88 0.12 0
14 100 0 0
16 100 0 0.08
18 100 0 0.4
20 100 0 0.85
Table 18 shows the percentage values of FAR and TSR increases from 0 to maximum value as threshold increases. The percentage value of FRR decreases from 100 to 0 as
threshold values increases. The maximum success rate of the proposed algorithm for combined face database is 100% at a threshold of 18. Its graphical representation is shown in Figure 21. It is observed that the value of EER is 0.02 for the threshold value of 14.2.
Fig 21: Variations of performance parameters with threshold for PID and POD of 60 and 40
Table 18. Percentage Variations of FAR, FRR and TSR with Threshold for PID and POD of 60 and 40
60:40 THRESHOLD
%Max
TSR FRR FAR
0 0 1 0
2 0 1 0
4 0 1 0
6 0 1 0
8 35 0.68 0
10 75 0.28 0
12 90 0.1 0
14 99 0.1 0
16 100 0 0.11
18 100 0 0.51
20 100 0 0.85
Table 19 shows the percentage values of FAR and TSR increases from 0 to maximum value as threshold increases. The percentage value of FRR decreases from 100 to 0 as threshold values increases. The maximum success rate of the proposed algorithm for combined face database is 100% at a threshold of 16. Its graphical representation is shown in Figure 22. It is observed that the value of EER is 0.03 for the threshold value of 14.6.
Table 19. Percentage Variations of FAR, FRR and TSR with Threshold for PID and POD of 80 and 40
80:40 THRESHOLD
%Max
TSR FRR FAR
0 0 1 0
2 0 1 0
4 0 1 0
6 0 1 0
8 30 0.7 0
10 75 0.25 0
12 90 0.1 0
14 98 0.02 0
16 100 0.01 0.19
18 100 0 0.48
20 100 0 0.9
Table 20 shows the percentage values of FAR and TSR increases from 0 to maximum value as threshold increases. The percentage value of FRR decreases from 100 to 0 as threshold values increases. The maximum success rate of the proposed algorithm for combined face database is 100% at a threshold of 14. Its graphical representation is shown in Figure 23. It is observed that the value of EER is zero for the threshold value of 14.
Fig 23: Variations of performance parameters with threshold for PID and POD of 40 and 60
Table 20. Percentage Variations of FAR, FRR and TSR with Threshold for PID and POD of 40 and 60
40:60 THRESHOLD
%Max
TSR FRR FAR
0 0 1 0
2 0 1 0
4 0 1 0
6 0 1 0
8 38 0.61 0
10 72 0.28 0
12 88 0.12 0
14 100 0 0
16 100 0 0.1
18 100 0 0.45
20 100 0 0.89
Table 21 shows the percentage values of FAR and TSR increases from 0 to maximum value as threshold increases. The percentage value of FRR decreases from 100 to 0 as threshold values increases. The maximum success rate of the proposed algorithm for combined face database is 100% at a threshold of 14. Its graphical representation is shown in Figure 24. It is observed that the value of EER is zero for the threshold value of 14.
Fig 24: Variations of performance parameters with threshold for PID and POD of 40 and 80
Table 21. Percentage Variations of FAR, FRR and TSR with Threshold for PID and POD of 40 and 80
40:80 THRESHOLD
%Max
TSR FRR FAR
0 0 1 0
2 0 1 0
4 0 1 0
6 0 1 0
8 38 0.61 0
10 72 0.28 0
12 89 0.12 0
14 100 0 0
16 100 0 0.08
18 100 0 0.4
20 100 0 0.85
The performance parameters such as percentage maximum TSR, optimum TSR and EER values are tabulated for variations in PID keeping POD constant at 40, is given in table 22. The maximum TSR values are constant at 100 for variations in PID. The percentage OTSR and EER values increases and decreases for increase in PID values from 20 to 80 keeping POD constant at 40.
Table 22. Variations of performance parameters with variations in PID for constant POD at 40
PID POD % MAX TSR
% OPT
TSR EER
20 40 100 100 0
40 40 100 100 0
60 40 100 98 2
The performance parameters such as percentage maximum TSR, optimum TSR and EER values are tabulated for variations in PID keeping POD constant at 40, is given in table 23. The maximum TSR values are constant at 100 for variations in POD. The percentage OTSR and EER values increases and decreases for increase in POD values from 20 to 80 keeping PID constant at 40.
Table 23. Variations of performance parameters with variations in POD for constant PID at 40
PID POD % MAX TSR
% OPT
TSR EER
40 20 100 100 0
40 40 100 100 0
40 60 100 100 0
40 80 100 100 0
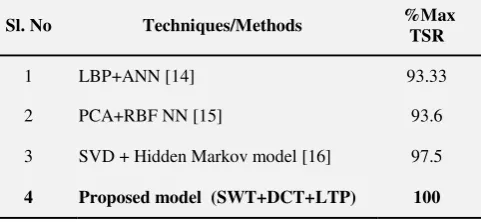
Hence in this work, the percentage maximum TSR of the proposed model is compared with existing methods explained by Abhilasha A Patil and Lakshmi Maka [14], Thakur et al., [15] and P D Bhamre and Swati B Memane [16] is shown in table 24. It is found that the performance of the proposed method is better than the existing methods for ORL face.
Table 24. Comparison of TSR value of the proposed system with existing system for ORL database
Sl. No Techniques/Methods %Max TSR
1 LBP+ANN [14] 93.33
2 PCA+RBF NN [15] 93.6
3 SVD + Hidden Markov model [16] 97.5
4 Proposed model (SWT+DCT+LTP) 100
VI.
C
ONCLUSIONIn this paper, Face Recognition using Stationary Wavelet Transform, Discrete Cosine Transform and Local Ternary Pattern is presented. Face images are resized. SWT and DCT are applied on face images to produce features. LTP is applied on SWT features. SWT, DCT and LTP features are concatenated to get final features. Features of test and database images are compared using Euclidean distance. Total Success Rate of the proposed system is better than existing systems due to invariant nature of SWT and concatenation of multiple features.
R
EFERENCES[1] Gurupreet Kaur and Navdeep Kanwal, “A Comparative Review of Various Approaches For Feature Extraction in Face Recognition”, IEEE
International Conference on Computing for
Sustainable Global Development, pp. 2705- 2710, 2016.
[2] Anil Bhagwanrao and Kalpana C J, “DCT pyramid
based Face Recognition System”, IEEE International Conference on Information Processing, pp. 506-510, 2015.
[3] Meng Xi, Liang Chen, Desanka Polajnar and Weiyang Tong, “Local Binary Pattern Network: A Deep learning Approach for Face Recognition”, IEEE International Conference on Image Processing, pp. 3224-3228, 2016.
[4] Prateekshit Pandey, Richa Singh and Mayank Vatsa, “Face Recognition using Scattering Wavelet under Illicit Drug Abuse Variations,” IEEE International Conference on Biometrics, pp. 1-6, 2016.
[5] Yong P Chen, Qi-HuiChen, Kuan-YuChou and Ren-HauWu, “Low Cost Face Recognition system based on Extended Local Binary Pattern”, IEEE International Conference on Automatic Control, pp. 13-18, 2016.
[6] Sunilkumar, M K Bhuyan and Bilab Ketan Chakraborty, “Extraction of Informative regions of a face for Facial Expression Recognition”, Research Article on Institution of Engineering and Technology, Vol.10, No. 6, pp. 567-576 , 2016.
[7] L Padma Suresh and Anil J, “Literature Survey on Face and Face Expression Recognition”, IEEE International Conference on Circuit, Power and Computing Technologies, pp. 1-6, 2016.
[8] Sushma, Niket Borade, Ratnadeep Deshmukh and Shivakumar Ramu, “Face Recognition Using Fusion of PCA and LDA: BORDA Count Approach”, IEEE
Mediterranean Conference on Control and
Automation, pp. 1164-1167, 2016.
[9] Zhao Hong, Liu Fei and Wang Yong-jun, “Face Recognition based on LBP and Genetic Algorithm”, Chinese Control and Decision Conference, pp. 1582-1587, 2016.
[10] Chunlei Peng, Xinbo Gao and Nannan Wang Jie Li, “Graphical Representation Of Heterogeneous Face Recognition”, IEEE Transactions on Pattern Analysis and Machine Intelligence, Vol. 39, No. 2, pp. 301-312, 2017.
[11] Zhengzheng Liu and Yong Wu, “Development of Face Recognition system based on PCA and LBP for Intelligent Anti-Theft Doors”, International Conference on Computer and Communications, pp. 341-345, 2016.
[12] Haifeng Li and Xiaowei Zhu, “Recognition Technology Research and Implementation based on Mobile Phone System”, IEEE International Conference on Natural Computation, Fuzzy Systems and Knowledge Discovery, pp. 972-976, 2016. [13] M M Fakhir, W L Woo, J A Chambers and S S
Dlay, “Novel method of Face Recognition from various Pose”, IEEE International Conference on Pattern Recognition Systems, pp. 6 – 11, 2016. [14] Abhilasha A Patil and Lakshmi Maka, “User
[15] S Thakur, J K Sing, D K Basu, M Nasipuri and M Kundu, “Face Recognition using Principal Component Analysis and RBF Neural Networks”, International Journal of Simulation systems, science and Technology, Vol. 10, No. 5, pp.7-15, 2009. [16] P D Bhamre and Swati B Memane, “Face
Recognition Using Singular Value Decomposition and Hidden Markov Model”, International Journal of Modern Trends in Engineering and Research, Vol. 2, Issue 10, pp. 323 – 332, October – 2015. [17] Tao Wang, “A Novel Face Recognition method
based on ICA and Binary Tree SVM”, IEEE International conference on computational Science and Engineering and IEEE International Conference on Embedded and Ubiquitous Computing, pp. 251-254, 2017.
[18] Ze LU, Xudong Jiang and Alex Kot, “A Novel LBP Based Color Descriptor for Face Recognition”, IEEE International Conference on Acoustics, Speech and Signal Processing , pp. 1857-1861, 2017.
[19] Masaki Nakada, Han Wang, Demetri and Terzopoulos, “Active Face Recognition using Convolutional Neural Networks”, IEEE International Conference on Computer Vision and Pattern Recognition Workshops, pp. 35-40, 2017.
[20] Narayan Vetrekar, Kiran B Raja, R Raghavendra, R S Gad and Christoph Busch, “ Band Level Fusion using Quaternion representation for extended Multi-Spectral face Recognition”, IEEE International Conference on Information Fusion, pp. 1-16, 2017.
[21] Navaneeth Bodla, Jingxiao Zheng, Hongyu Xu, Jun Cheng Chen, C. Castillo and R. Chellappa, “Deep Heterogeneous Feature Fusion for Template Face Recognition”, IEEE International Conference on Applications of Computer Vision, pp. 586-595, 2017. [22] Ze Lu, Xudong Jiang and Alex Kot, “Enhance Deep
learning Performance in face Recognition”, IEEE International Conference on Imaging, Vision and Computing, pp. 244-248, 2017.
[23] Menglu Wu and Tongwei Lu, “Face Recognition based on LBP and LNMF Algorithm” IEEE International Symposium on parallel and Distributed computing”, pp. 368-371, 2016.
[24] Jesus Olivares Mercado, Karina Toscano Medina and Gabriel Sanchez Perez, “Face Recognition System for Smartphone based on LBP”, IEEE International Workshop on Biometrics and Forensics, pp. 1-6, 2017.
[25] Ashraf S Huwedi and Huda M Selem, “Face Recognition using Regularized Linear Discriminant Analysis under Occlusions and Illumination Variations”, IEEE International Conference on Control Engineering and Information Technology, pp. 1-5, 2016.
[26] Zhihan Xie, Peng Jiang and Shuai Zhang, “Fusion of LBP and HOG using Multiple Kernel Learning for Infrared Face Recognition”, IEEE International Conference on Computer and Information Science, pp. 81-84, 2017.
[27] Yichuan Wang, Zhen Xu, Weifeng Li and Qingmin Liao, “Illumination Robust Face Recognition with Block-Based Local Contrast Patterns”, IEEE International Conference on Acoustics, Speech and Signal Processing, pp. 1418-1422, 2017.
[28] Haoxi Li, Haoshan Zou and Haifeng Hu, “Modified Hidden Factor Analysis for Cross-Age Face Recognition”, IEEE Journals and Magazines on Signal Processing Letters, Vol. 24, No. 4, pp. 465-469, 2017.
[29] Jou Lin and Ching Te Chiu, “LBP Edge-Mapped Descriptor using MGM Interest points for face recognition”, IEEE International Conference on Acoustics, Speech and Signal Processing, pp. 1183-1187, 2017.
[30] Kang Geon Kim, Feng Ju Chang, Jangmoo Choi, Louis Philippe and Morency, “Local-Global-landmark Confidences for Face recognition”, IEEE International Conference on Automatic Face and Gesture Recognition, pp. 666-672, 2017.
[31] Mohammed Saaidia and Messaoud Ramdani, “ Multi-Feature Characterization Strategy for Face Recognition Efficiency”, IEEE International Conference on Control Engineering and Information Technology, pp. 1-6, 2016.
[32] Gede Pasek Suta Wijaya, Ario Yudo Husodo and Wayan Agus Arimbawa, “Real-Time-Face Recognition using DCT Co-efficient based Face Descriptor”, IEEE International Conference on Informatics and Computing, pp. 142-147, 2016. [33] Ismahane Cheheb, Noor Al Maadeed, Somaya Al
Maadeed and Ahmed Bouridane Richard Jiamg, “Random Sampling for Patch-based face Recognition”, IEEE International Workshop on Biometrics and Forensics, pp. 1-5, 2017.
[34] Huma Qayyum, Muhammad Majid, Syed Muhammad Anwar and Bilal Khan, “Facial Expression Recognition using Stationary Wavelet Transform Features”, Research Article on Mathematical Problems in Engineering, pp. 1-9, 2017.
[35]M Sharmila Kumari and Swathi Salian, “Discriminative DCT based Face Recognition: An Efficient and Accurate Approach”, International Journal of Innovative Research in Computer and Communication Engineering, Vol. 2, No. 5, pp. 319-325, 2014.
[36]Nishatbanu Nayakwadi and Mohammad Jameel Hashmi, “Face Recognition System using Local Ternary Pattern and Signed number Multiplication”,
International Journal of Engineering Science
Invention, Vol. 5, No. 1, pp. 44-50, 2016.
[37]Indiandatabase http://viswww.cs.umass.edu/~vidit/ Indian Face Database.
[38]ORL database, http://www.camrol.co.uk.
Authors
’
Profiles
Mr. Sunil S Harakannanavar completed his Bachelor of Engineering in the stream of Electronics & Communication Engineering from Sri Taralabalu Jagadguru Institute of Technology, Ranebennur and his Masters in the field of Microelectronics and Control Systems from Nitte Mahalinga Adyanthaya Memorial Institute of Technology, Nitte. Presently he is working as Assistant Professor with S. G. Balekundri Institute of Technology Belagavi. He is pursuing his Ph.D at Visvesvaraya Technological University, Belagavi and his area of interests includes Computer Vision, Pattern Recognition and Biometrics. He is a life member of Indian Society for Technical Education, New Delhi and Institute for Exploring Advances in Engineering (IEAE).
Dr. Prashanth C R received the BE degree in Electronics, ME degree in Digital Communication and Ph.D degree from Bangalore University, Bangalore. He is currently working as a Professor, Department of Telecommunication Engineering, Dr. Ambedkar Institute of Technology, Bangalore. His research interests include Computer Vision, Pattern Recognition and Biometrics. He is a life member of Indian Society for Technical Education, New Delhi, Member of IEEE, IACSIT, ACM and Fellow of Institution of Engineers.
Ms. Sapna Patil received B.E degree in Telecommunication Engineering from KLE Society's Dr. M. S. Sheshgiri College of Engineering and Technology under VTU Belagavi and M.E in Electronics and Communication from University Visvesvaraya College of Engineering, Bangalore under Bangalore University. Her research interests include Computer Vision, Pattern Recognition and Biometrics.