Abstract—Perceived depth models represent the perception of depth by human being with algebraic structure of observation environment. Most conventional models do not consider the fact of non-physical components such as color, shape and other information from the contents itself. In this paper, we analyzed the relationship between hue information and the perceived depth while other factor such as observation environment fixed. We generated test patterns with the change of hue information for pre-defined image structure and tested the perceived depth. The perceived depth model considering hue information is proposed in this paper.
Index Terms—Hue, perceived depth, human visual system.
I. INTRODUCTION
3-Dimensional images are popular in these days, especially on the field of 3-dimensional movie theater, video and so on. In the process of making 3-D film and editing, the control of depth information is very important. There is no quantitative measure for this control because it depends on the personal characteristics of 3-D viewing. Therefore, it is difficult to make quantitative measure for representative cases.
However, there are some methods for describing the perceived depth information by using the parameters of 3-D viewing condition such as the observation distance from the display to the observer, inter-pupil distance of observer, device characteristic and so on. The characteristic of visual discomfort is one of the important issues in this field. Visual discomfort means the observer feels some fatigue with the specific observation parameters of observation environment such as observation angle and distance between the observer and display devices. There is visual discomfort zone [1]-[2] and the observer feels visual fatigue when he or she watches 3-D contents [3]-[4].
Visual discomfort zone means that if the observer is in discomfort zone when he or she observes 3-D images on some display, he or she feels discomfort. In other case, when the observer is in comfort zone, he or she feels no discomfort for the 3-D images. This phenomenon comes from the geometrical parameters such as the distance between the
Manuscript received October 31, 2013; revised January 24, 2014. This research is supported by Korea Creative Content Agency (KOCCA) in the Culture Technology (CT) Joint Research Center Project 2010.
Jeong-Yeop Kim is with the Department of Undeclared Major, University of Young-San, 99 Pilbong-gilHaeundae-Gu, Busan, 612-743, Korea (e-mail: [email protected]).
Sang-Hyun Kim is with the Department of Computer Engineering, University of Young-San, 288 Junam-ro, Yangsan-siKyungsangnam-do 626-790, Korea (e-mail: [email protected]).
Gil-Ja So is with the Department of Cyber Police and Science, University of Young-San, 288 Junam-ro, Yangsan-siKyungsangnam-do 626-790, Korea (e-mail: [email protected]).
observer and the display, the inter-pupil distance of the observer, disparity of the image pixel position and dot pitch of display device and so on. This feeling of discomfort causes fatigue when the observer watches 3-D images. The fatigue does not caused from only these parameters mentioned above, however these parameters has potential influence on it.
Because there are so many other reasons for the observer feels fatigue. For example, the physical conditions, emotional changes, and so on. In the researches related the perception of depth assumes the fatigue comes from mainly from the geometrical parameters mentioned above and usually ignores those other reasons.
This is an important factor in the evaluation of perceived depth of observer. One of the methods includes depth tuning technique by defining safety zone. Chang Yuan [5] et al.
calculated this kind of safety zone in some particular observation environment with fixed size of display device. They controlled the depth information by shifting and scaling based on human visual characteristics.
Kim et al. [6] tried to include the parameters from contents as color information into perceived depth model. They used color information as hue and lightness together. The perceived depth model was modified by using hue and lightness information in the form of scaling the depth.
In this paper, we are interested in using hue information only rather than use the hue and lightness information together. The perceived depth model should be modified as the form of offset adjustment rather than scale.
II. CONVENTIONAL METHODS
A. Conventional Perceived Depth Model
Perceived depth model has been considered by many researchers and most of them did not take the effect of human visual factor and just thought about the algebraic structure of observation environment.
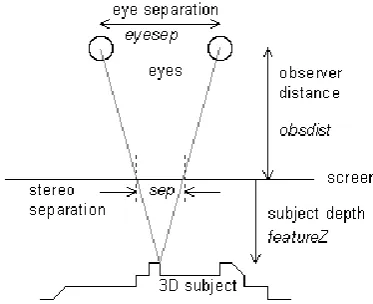
According to the research of Chang Yuan [5] et al., if the stereo images are captured in parallel mode camera, the perceived depth is proportional to disparities and can be represented in (1) where, D is perceived depth, V is observation distance (distance from observer to display device), I is IPD (inter-pupil distance) of observer, SD is horizon pixel pitch of display device and d is disparity information. The visual comfort zone is computed as in Fig. 1.
𝐷 =
𝐼𝑉 𝑆𝐷 𝑑−1(1)
In Fig. 1, the main parameters to decide visual comfort are observer-to-screen distance and disparity at screen. These two parameters have great influence on fatigue.
Jeong-Yeop Kim, Sang-Hyun Kim, and Gil-Ja So,
Member, IACSIT
Fig. 1. Visual comfort zone for various kind of display.
They shifted the images laterally to adjust disparity image and correct the data outside visual comfort zone. Additionally, if the shift values are not compatible for the scene, for example, very big to be shifted, these data can be scaled. By this approach, they can calibrate the 3-D images and make it comfortable when the observer watches the images. But there exist some artifact for disparity information because this approach adjusts the disparity values directly and there can be some discontinuity by this adjustment. In this paper, we are interested in some method how can we adjust the degree of depth not by direct adjustment of disparity.
Perceived depth model represents the actual depth perceived for some 3D images by human being in some observation condition. If we fix the observation condition such as observation distance, display device and so on, the perceived depth model gives constant depth information regardless of the displayed contents [5]. It is not considered the property of contents displayed on display device and the perceived depth is represented by just the physical, algebraic parameters and proportional rate of observation environment. However, according to the human visual experiment of depth perception [7], the actual perceived depth can be varied with the change of displayed contents such as wavelength or luminance values.
B. Human Visual Experiment on Depth Perception
However, it is known that hue and luminance components give some influence on depth perception of human-being from the physiological experimental reports about human vision and depth perception.
Cary Lu [7] et al. set experiment environment and generated stereopsis images. Stereopsis image by many type of combination was generated and used in experiment on if human being can recognize the depth information for the images or not. The contents of combination can be represented as wavelength (λ) of patch luminance (L) information. These two factors can be manipulated by experimenter and therefore, gives many patterns for this experiment. The test environment is as shown in Fig. 2 and test pattern is shown in Fig. 3.
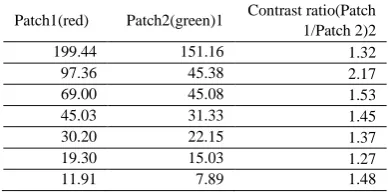
The result is shown in Table I and Table II. The depth of green object on red background is well perceived at low luminance (average contrast 10.5). The other case, red object should have high luminance (average contrast 1.5) to be perceived well. This fact of hysteresis means hue and luminance gives some influence on depth perception of human being.
Fig 2. Optical construction of experiments.
(a) left image (b) right image Fig. 3. Stereopsis pattern of optical image generation.
TABLEI:RESULT OF CONTRAST :λ1=634nm,λ2=512nm
Patch1(red) Patch2(green)1 Contrast ratio(Patch 1/Patch 2)2
256.47 26.40 9.78
167.25 13.00 12.90
104.25 8.95 11.68
54.40 4.62 11.75
34.21 3.86 8.80
22.12 2.42 9.47
13.08 1.42 9.17
TABLEII:RESULT OF CONTRAST :λ1=512nm,λ2=634nm
Patch1(red) Patch2(green)1 Contrast ratio(Patch 1/Patch 2)2
199.44 151.16 1.32
97.36 45.38 2.17
69.00 45.08 1.53
45.03 31.33 1.45
30.20 22.15 1.37
19.30 15.03 1.27
11.91 7.89 1.48
C. Perceived Depth Model with Color Information
Kim et al. [6] included the parameters of color information into perceived depth model. They used color information as hue and lightness together. They proposed the perceived depth model as (2). The test pattern is shown in Fig. 4.
𝐷
𝑐=
𝐼𝑉 𝑆𝐷 𝑑−1× 𝑓(𝜆
1, 𝐿
1, 𝜆
2, 𝐿
2)
(2)
They concluded with (3) and showed the relationship between depth and wavelength, lightness.
𝐷
𝑐=
𝐼𝑉 𝑆𝐷 𝑑−1× a ×
0.0396𝜆𝐿11−0.0299𝜆2
− 𝐿
2 (3)In this paper, we would analyze the perceived depth information in the form of offset rather than scale as Kim et. al. did. Because they used the concept of color contrast, therefore the offset is proper than the scale.
III. EXPERIMENTAL ENVIRONMENT
The test synthetic images for this new model can be generated by 3dhippie_stereocam_v1.6.4 [8] of Fig. 5 and be shown in Fig. 6.
Fig. 5. Stereo-Cam plugin for 3Ds-Max.
(a) left and right image at T = 0 sec.
(b) left and right image at T = 8 sec.
(c) left and right image at T = 16 sec. Fig. 6. Test stereopsis image by plugin.
The test image set were generated as video with running time of 16 seconds. We used two balls as the test object and
set the color of two balls as Table III. The left ball is called as CLeft and right one as CRight. We made all 78 set of test video with all possible color combinations using 13 colors from C1 to C13. The combination was performed as (CLeft , CRight) like (C1, C2), (C1,C3), …and (C12,C13). CLeft ball was put on left side of the scene and starts to move close to the eye at
TABLEIII:COLOR SAMPLES FOR TWO BALLS
Color name R G B Y Cr Cb
C1 255 24 24 93.1 161.9 -69.1 C2 255 138 10 158.4 96.6 -148.4 C3 190 190 0 168.3 21.7 -168.3 C4 101 228 0 164.0 -63.0 -164.0 C5 11 255 11 154.2 -143.2 -143.2 C6 0 252 125 162.2 -162.2 -37.2 C7 0 237 237 166.1 -166.1 70.9 C8 57 185 255 154.7 -97.7 100.3 C9 132 132 255 146.0 -14.0 109.0 C10 222 94 255 150.6 71.4 104.4 C11 255 56 255 138.2 116.8 116.8 C12 255 70 198 139.9 115.1 58.1 C13 161 161 161 161.0 0.0 0.0
T = 0 sec. This ball arrives to the position most close to the eye at T = 8 sec, and it moves the reverse route it already moved and finally to the initial position at T = 16 sec.
These sample colors were set by sampling of hue information uniformly as Fig. 7. The lightness was set to specific predefined fixed value and the hue information was changed only. The sampled hue information does not represent perfect uniform case because of gamut problem. The closest samples to ideal case were selected for the test.
Fig. 7. Sampled hue information in Cr-Cb plane.
The background of the test video was set to RGB values as (64, 64, 64).
IV. PROPOSED MODELING
In this paper, the perceived depth model is considered as the offset of depth information with the change of color contrast.
𝐷
𝑐=
𝐼𝑉𝑆𝐷 𝑑−1
+ 𝐷
𝑜𝑓𝑓(2)
We are interested in the parameter of Doff. The relationship between hue combination and Doff is tested and analyzed in this paper.
The test was performed as follows:
according to the route pre-defined.
Step 3) Observer find out the exact position of frame number that guarantees CLeft and CRight are on the same distance from the observer. We call this point as „Forward match point‟.
Step 4) Observer continues to watch the video and find out the next position of frame number when CLeft and CRight meets again. We call this point as „Backward match point‟.
Step 5) Test above 4 steps for 78 video sets.
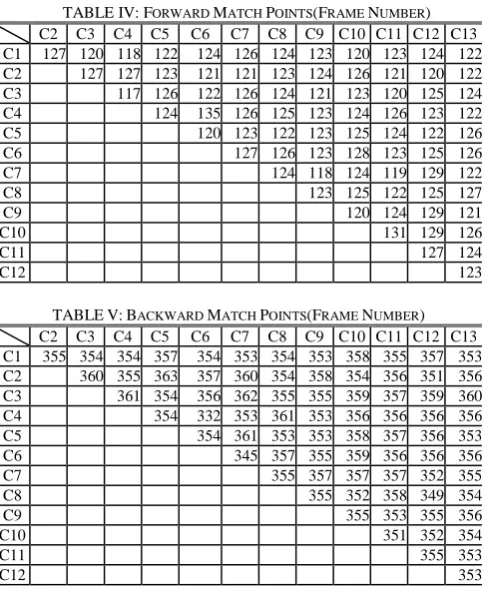
By the whole test, we can find out the exact forward and backward frame number for the matching. Then, this frame number can be converted into distance information because all 480 frames displayed corresponds the maximum moved distance of CLeft and CRight each. Therefore, we can estimate the relationship between hue change and relative perceived depth offset as described above. The forward match and backward match frame numbers are shown in Table IV and Table V.
TABLE IV: FORWARD MATCH POINTS(FRAME NUMBER) C2 C3 C4 C5 C6 C7 C8 C9 C10 C11 C12 C13 C1 127 120 118 122 124 126 124 123 120 123 124 122 C2 127 127 123 121 121 123 124 126 121 120 122 C3 117 126 122 126 124 121 123 120 125 124 C4 124 135 126 125 123 124 126 123 122 C5 120 123 122 123 125 124 122 126 C6 127 126 123 128 123 125 126
C7 124 118 124 119 129 122
C8 123 125 122 125 127
C9 120 124 129 121
C10 131 129 126
C11 127 124
C12 123
TABLEV:BACKWARD MATCH POINTS(FRAME NUMBER) C2 C3 C4 C5 C6 C7 C8 C9 C10 C11 C12 C13 C1 355 354 354 357 354 353 354 353 358 355 357 353 C2 360 355 363 357 360 354 358 354 356 351 356 C3 361 354 356 362 355 355 359 357 359 360 C4 354 332 353 361 353 356 356 356 356 C5 354 361 353 353 358 357 356 353 C6 345 357 355 359 356 356 356
C7 355 357 357 357 352 355
C8 355 352 358 349 354
C9 355 353 355 356
C10 351 352 354
C11 355 353
C12 353
The converted relative distance of matching are shown in Table VI and VII for forward and backward each.
TABLEVI:FORWARD MATCH POINTS(RELATIVE DISTANCE IN
PERCENTAGE)
C2 C3 C4 C5 C6 C7 C8 C9 C10 C11 C12 C13 C1 -5.83 0.00 1.67 -1.67 -3.33 -5.00 -3.33 -2.50 0.00 -2.50 -3.33 -1.67 C2 -5.83 -5.83 -2.50 -0.83 -0.83 -2.50 -3.33 -5.00 -0.83 0.00 -1.67 C3 2.50 -5.00 -1.67 -5.00 -3.33 -0.83 -2.50 0.00 -4.17 -3.33 C4 -3.33 -12.50 -5.00 -4.17 -2.50 -3.33 -5.00 -2.50 -1.67 C5 0.00 -2.50 -1.67 -2.50 -4.17 -3.33 -1.67 -5.00 C6 -5.83 -5.00 -2.50 -6.67 -2.50 -4.17 -5.00 C7 -3.33 1.67 -3.33 0.83 -7.50 -1.67
C8 -2.50 -4.17 -1.67 -4.17 -5.83
C9 0.00 -3.33 -7.50 -0.83
C10 -9.17 -7.50 -5.00
C11 -5.83 -3.33
C12 -2.50
TABLEVII:BACKWARD MATCH POINTS(RELATIVE DISTANCE) C2 C3 C4 C5 C6 C7 C8 C9 C10 C11 C12 C13 C1 -4.17 -5.00 -5.00 -2.50 -5.00 -5.83 -5.00 -5.83 -1.67 -4.17 -2.50 -5.83 C2 0.00 -4.17 2.50 -2.50 0.00 -5.00 -1.67 -5.00 -3.33 -7.50 -3.33 C3 0.83 -5.00 -3.33 1.67 -4.17 -4.17 -0.83 -2.50 -0.83 0.00 C4 -5.00 -23.33 -5.83 0.83 -5.83 -3.33 -3.33 -3.33 -3.33 C5 -5.00 0.83 -5.83 -5.83 -1.67 -2.50 -3.33 -5.83 C6 -12.50 -2.50 -4.17 -0.83 -3.33 -3.33 -3.33 C7 -4.17 -2.50 -2.50 -2.50 -6.67 -4.17
C8 -4.17 -6.67 -1.67 -9.17 -5.00
C9 -4.17 -5.83 -4.17 -3.33
C10 -7.50 -6.67 -5.00
C11 -4.17 -5.83
C12 -5.83
In Table VI, the relative distance Doff shows some difference with the combination of hue. For the case of C1-C2 combination, the relative distance value is -5.83%. This means left ball with color C1 looks positioned in the same distance from the observer compared to the right ball with color C2 while the actual position of left ball is 5.83% closer to the observer compared to the position of right ball. This fact shows the effect of „forward color‟ in color theory. C1 is more warm color compared to C2. This effect can be seen in other combination of hues. The backward match was considered if there exists effect of hysteresis. The result shows some hysteresis effect and this theme should be considered more specific in future studies. The method for generation of patterns should be considered in the future studies in the form of random dot style because this basic scheme was used by Cary Lu [7] et al.
The pattern would be generated as Fig. 8 and 9. This pattern is composed of random dot plane. Before test this pattern, we considered the property of this pattern, and the parameters for the real situation would be differ from the results by using this pattern. Therefore, we developed another test pattern with some volume for the center object such as sphere.
Fig. 8. Stereo-Cam plug in for planar pattern.
Fig. 9. Test pattern using planar random dot pattern.
in Fig. 10, the depth image of Fig. 11 can be used.
Fig. 10. Geometry for random dot pattern with volume.
Fig. 11. Depth image for random dot pattern with volume.
The test images can be generated by programming rather than by 3DS-Max and it is easy to adjust experimental configuration and parameters. The test image set can be generated with the same configuration of colors as Table III. In this paper, it is important to set the movement of center sphere properly to test the effect of hue in perception of depth. Some constraints would be needed for the setup of test environment as follows:
1) The center sphere should have proper size for the observation and depth of sphere should be small to minimize the effect of shape of center test object. 2) Background should have proper depth. The observer can
perceive the depth of center sphere front and behind of this background.
3) The movement of center sphere should be linear so that the observer can decide the exact point of perception. 4) Observer should find out the matching point for the
„Forward match‟ and „Backward match‟ as the previous case so that hysteresis could be checked.
The image shown in Fig. 12 represents planar center disk with planar background and this can be thought as an initial result for the generation of test patterns with volume. To make this pattern, random dots pattern for background are generated with 50% of dots inside the area.
The front random dot pattern mask can be generated with the same size of Fig. 11. Fill the circular area with random dot patterns for center sphere by using depth image of Fig. 11 as mask pattern.
If the corresponding pixel is included in black background of depth image, the random dot pattern is not filled for this case. If otherwise, it means the corresponding pixel is included in the center sphere pattern, therefore fill the random dot pattern for that case. Therefore, the pattern of circular center can be obtained by this procedure.
Fig. 12. Test random dot pattern image with volume.
To make the test pattern with volume, center sphere with volume should be positioned from behind to front position of background so that the observer can see the center sphere moves far from the observer to more close position.
The next step is making of center sphere with volume for flat background as mentioned above and as in Fig. 10. In this case the background would be represented with „featureZ‟ values as 0 in Fig. 10. This means the center sphere could not be positioned behind of background as the constraint number 2 above.
The test pattern should have two separate images for the foreground and background each. The foreground image can be defined as Fig. 11 and background image would be uniform planar pattern with a specific grey level such as 64. This value 64 can be set as „featureZ‟ in Fig. 10.
The test pattern for our test should be in the form of video, therefore this kind of test still images would be expanded with the change of time. It means the size of center sphere should be larger and larger with time elapsed in some period for „Forward match‟ and be smaller and smaller after then for „Backward match‟.
This procedure of making test video would be implemented on further studies.
V. CONCLUSION
In this paper, the method for finding relationship between the change of saturation values and perceived depth information was proposed. By the proposed method, we found if we decrease saturation values for some object in the scene, it looks like more farther than its real location. This fact can be utilized in reducing the viewing fatigue for 3D stereoscopic images because reduce in saturation values to some extent causes the change of perceived depth information without any distortion in depth. Therefore, the viewing fatigue can be controlled in some extent without distortion of depth information. The proposed perceived depth model can be modified to satisfy the conditions of real environment.
ACKNOWLEDGMENT
This research is supported by Korea Creative Content Agency (KOCCA) in the Culture Technology(CT) Joint Research Center Project 2010.
REFERENCES
[1] M. Lambooij, M. Fortuin, I. Heynderickx, and W. IJsselsteijn, “Visual discomfort and visual fatigue of stereoscopic displays: A Review,”
Journal of Imaging Science and Technology, vol. 53, no. 3, pp.
[2] S. I. Lee, J. Y. Ju, S. Hosik, R. Y. Man, and P. H. Wook, “Visual discomfort induced by fast salient object motion in stereoscopic video,”
in Proc. SPIE 7863, Stereoscopic Displays and Applications XXII,
February 11, 2011.
[3] I. P. Howard and B. J. Rogers, Binocular Vision and Stereopsis, Oxford University Press, 1st ed. 1995.
[4] D. M. Hoffman, A. R. Girshick, K. Akeley, and M. S. Banks, “Vergence-accommodation conflicts hinder visual performance and cause visual fatigue,” Journal of Vision, vol. 8, no.3, pp. 1-30, 2008. [5] Y. Chang, P. Hao, and D. Scott, “Stereoscopic 3D content depth tuning
guided by human visual models,” in Proc. SID Symposium Digest of
Technical Papers, June 2011, vol. 42, issue 1, pp. 916–919.
[6] J. Y. Kim, S. H. Kim, and G. J. So, "Perceived depth modeling based on color information," International Journal of Computer Theory and
Engineering. vol. 5, no. 4, pp. 716-720, 2013.
[7] L. Cary and H. Derek. Fender, “The interaction of color and luminance in stereoscopic vision,” Investigative Ophthalmology, vol. 11, no. 6, pp. 484-490, June 1972.
[8] 3D hippie-stereocam. [Online]. Available: http://www.scriptspot.com/3ds-max/scripts/3dhippie-stereocam [9] Home page of techmind.org. [Online]. available:
http://www.techmind.org/index.html
Jeong Yeop Kim received the diploma in electronics engineering from Kyung-Pook National University of Daegu, South Korea in 1990, and MS and PhD degrees, both in image processing of electronics engineering, from the same university, in 1992 and 2000, respectively.
He was with the Samsung Advanced Institute of Technology in Korea as a senior research staff from 1994 to 2000. From March 2001 to February 2013, he was with the Department of Game Contents Science of the University of Young-San at Busan, as an associate professor. From March 2013, He is with the Department of Undeclared Major of the University of Young-San at Busan. His doctoral dissertation work focused on detecting and adjusting the white point from single color image. The topics he has worked on include color printing, error diffusion, color correction and 3D stereoscopic images. His current research is on correction of color data in 3D stereoscopic images. He is a member of the KMMS (Korea Multimedia Society) and KIPS (Korea Information Processing Society)
Sang Hyun Kim received the diploma in electronics engineering from Kyung-Pook National University of Daegu, South Korea in 1991, and MS and PhD degrees, both in image processing of electronics engineering, from the same university, in 1993 and 1998, respectively.
He was with the Samsung Medison Co. Ltd, in Korea as a senior researcher from 1998 to 2001. From September 2001, he is with the Department of Computer Engineering of the University of Young-San at Yangsan, Kyungnamas an associate professor. His doctoral dissertation work focused on the development of fractal image coding method and transmission for image processing, image communication and computer vision problems. The topics he has worked on include virtual reality, ultrasound image processing, medical image processing, image feature extraction and classification, and 3D stereoscopic images. His current research is on region-based intensity correction in 3D stereoscopic images.
He is a member of the KMMS (Korea Multimedia Society) and KIPS (Korea Information Processing Society).