Selection of candidate reference genes and
validation for real-time PCR studies in rice
plants exposed to low temperatures
P.A. Auler1, L.C. Benitez1, M.N. do Amaral1, I.L. Vighi1, G.S. Rodrigues1,
L.C. da Maia2 and E.J.B. Braga1
1Departamento de Botânica, Instituto de Biologia, Universidade Federal de Pelotas,
Pelotas, RS, Brasil
2Centro de Genômica e Fitomelhoramento, Escola de Agronomia Eliseu Maciel,
Universidade Federal de Pelotas, Pelotas, RS, Brasil
Corresponding author: P.A. Auler E-mail: [email protected]
Genet. Mol. Res. 16 (2): gmr16029695 Received April 10, 2017
Accepted May 29, 2017 Published June 29, 2017
DOI http://dx.doi.org/10.4238/gmr16029695
Copyright © 2017 The Authors. This is an open-access article distributed under the terms of the Creative Commons Attribution ShareAlike (CC BY-SA) 4.0 License.
ABSTRACT. Rice is a cereal that presents a great ability to adapt to different soil and climate conditions. However, as it is a tropical crop with C3 metabolism, it performs better in warm temperatures with high solar radiation. Tolerance to stress caused by low temperatures is a highly complex process that involves various metabolic pathways and cellular compartments, resulting in general or specific effects on plant growth and development. In order to observe the true effect of a particular stress on genetic expression, reference genes need to be chosen for real-time PCRs, the expression levels of which should remain stable independent of the situation imposed. In this paper, the expression stability was evaluated of the actin 11 (ACT11), ubiquitin-conjugating enzyme 2 (UBC-E2), glyceraldehyde 3-phosphate dehydrogenase (GAPDH), beta tubilin (β-Tubulin), eukaryotic initiation factor 4α (eIF-4-α), eukaryotic
aquaporin (TIP41), and cyclophilin genes, in two rice genotypes cultivated in low temperature (13°C) conditions in vegetative stage (V4). The analysis material (leaves) was collected after 0, 6, 24, 48, and 72 h of exposure to the stress. In this study, the geNorm, BestKeeper, ΔCt, NormFinder, and RefFinder methods were used to evaluate the expression stability of the candidate reference genes. The results revealed that the most indicated genes for all the analysis methods were UBQ10 and UBQ5 for BRS Bojuru and BRS Pampa, respectively. On the other hand, the eIF-1-α gene presents the least expression stability and is not indicated for studies of rice plants subjected to low temperatures. The validation with the antioxidant system genes SODCc1-Cu/Zn, CATC, APX2, and GR2 confirmed the importance of using previously tested normalizing genes for adequate real-time PCR results.
Key words:Oryza sativa L.; Gene expression; Abiotic stress; Quantitative real-time PCR
INTRODUCTION
Rice (Oryza sativa L.) is a crop that evolved in tropical and subtropical areas and is sensitive to the stress of low temperatures, which can affect its geographical distribution and productivity (Kovach et al., 2007; Sang and Ge, 2007). Currently, this cereal is cultivated in a wide range of environments (tropical, subtropical, and temperate). However, because it is a tropical crop with C3 metabolism, it performs better in warm temperatures with high solar radiation (Karki et al., 2013). Different levels of tolerance to low temperatures are observed depending on the subspecies. Typical japonica cultivars are grown in regions with lower annual temperatures and generally present greater tolerance to the cold when compared with indica cultivars (Ma et al., 2015).
Exposure to low temperatures can cause damage to plants, such as osmotic stress and direct effects on metabolism, via molecular, biochemical, and physiological alterations that can lead to changes in the lipidic composition of membranes and the accumulation of osmolytes (Gilmour et al., 2000; Yamaguchi-Shinozaki and Shinozaki, 2006). Tolerance to stress caused by the cold is a highly complex process that involves various metabolic pathways and cellular compartments (Hannah et al., 2005) and results in general or specific effects on vegetal growth and development (Chinnusamy et al., 2007; Nakashima et al., 2009). Studying the profile of genetic expression in response to stress helps to identify plant signaling and regulation networks for tolerance and provides an effective approach for selecting candidate genes for manipulating and/or crossbreeding superior plants, such as rice (Zhang et al., 2004).
et al., 2010; Cotsaftis et al., 2011). However, in order to guarantee the efficiency of RT-qPCR and observe the true effect of a particular stress on the vegetal, some genes need to be chosen as normalizers/internal controls, the expression levels of which should remain uniform independent of the situation imposed. Constitutive genes are used for this purpose.
Although some genes are commonly used and reported as good reference gene in RT-qPCR plant studies, the most traditional ones include actin (ACT) (Maroufi et al., 2010), tubilin (TUB) (Wan et al., 2010), ubiquitin (UBQ) (Chen et al., 2011), codifiers of rRNA 18S (18S) (Jain et al., 2006) and of rRNA 40S (40S) (Cruz-Rus et al., 2011), glyceraldehyde 3-phosphate dehydrogenase (GAPDH), and elongation factor 1α (eIF-1-α), among others. However, it is known that the stability of some of these genes is relative, since depending on the plant, the stage of development, and/or type and intensity of stress, the expression of even constitutive genes can be significantly altered (Radonić et al., 2004; Czechowski et al., 2005). Therefore, in order to obtain a precise quantification of gene expression, we must analyze the stability of reference gene for the conditions and crop being studied. For this, a different software developed for this purpose is used, which when analyzed together indicate the most suitable gene(s) reference for the condition studied.
In this study, the stability of ten reference genes were analyzed and validated, which are traditionally used as reference genes in genetic expression studies for rice, in order to identify the most adequate for the normalization of transcription in genotypes cultivated at low temperatures in the vegetative stage.
MATERIAL AND METHODS
Vegetal material and stress conditions
The experiment was conducted using two Brazilian rice genotypes that present contrasting responses to stress from low temperatures: BRS Pampa (indica subspecies - sensitive) and BRS Bojuru (japonica subspecies - tolerant).
The seeds were geminated in germitest paper tubes at a temperature of 25° ± 2°C for 10 days in a climatized germination chamber. Then, the plantlets were transferred into plastic trays (3L) containing commercial soil fertilized according to the recommendations for irrigated rice cultivation. Three trays/genotype were used with 50 plantlets, which were kept in a greenhouse at a temperature of 28° ± 2°C and irrigated with Yoshida et al. (1976) nutritive solution until presenting four leaves (vegetative stage V4). In this period, the plants from the control treatment were collected and the remaining trays were transferred to a growth chamber with a temperature of 13°C, where they remained for 72 h for the collections.
The material for the analyses (leaves) was collected in the following way: C1 (collection 1) 0 h = plants not exposed to stress from cold; C2 = 6 h of stress; C3 = 24 h of stress; C4 = 48 h of stress; and C5 = 72 h of stress. The experimental design used was laid in a completely randomized design (CRD), in a 2 x 5 factorial layout (2 genotypes x 5 stress exposure times), with three biological repetitions per treatment. The experimental unit was composed of a bulk of 10 plants.
Total RNA extraction and cDNA synthesis
described for the PureLink Plant RNA Reagent (Invitrogen®) reactant. The quantity and purity of the RNA were measured in NanoDrop (ND-1000), while the quality and integrity were verified in electrophoresis with 1.0% agarose gel. The simple strand cDNAs were synthesized via reverse transcription for 2 μg of total RNA using oligoDT primer and Kit SuperScript First-Strand Synthesis System for RT-PCR (Invitrogen®).
Choosing the reference genes
Ten genes commonly used as internal controls in RT-qPCR analyses were chosen, which supposedly do not present significant variation between treatments. The selected genes were: actin 11 (ACT11), ubiquitin-conjugating enzyme E2 (UBC-E2), glyceraldehyde 3-phosphate dehydrogenase (GAPDH), beta tubulin (β-tubulin), eukaryotic initiation factor
4α (eIF-4- α), eukaryotic initiation factor 1α (eIF-1-α), ubiquitin 10 (UBQ10), ubiquitin 5 (UBQ5), aquaporin (TIP41), and cyclophilin (Table 1).
The specificity of each primer set was verified using the melting curve, with only those with specific amplicons being kept in this study; that is, with a single melting peak for the strands of the products of the RT-qPCR. The efficiency of PCR (E) was obtained based on four serial dilutions of cDNA (1:1; 1:5, 1:25, and 1:125), with the value of E estimated by the equation E = 10(-1/slope) (Rasmussen, 2001). Efficiency values between 1.8 and 2.2 were considered acceptable, which corresponds to efficiency of between 90-110%.
Table 1. Description of the candidate reference genes and target genes for RT-qPCRs in rice plants at a low temperature (13°C).
Gene Access F Primer R Primer Bibliography
ACT11 AK100267 5'-CAGCCACACTGTCCCCATCTA-3' 5'-AGCAAGGTCGAGACGAAGGA-3' Zhang and Hu (2007)
β-Tubulin AK072502 5'-GCTGACCACACCTAGCTTTGG-3' 5'-AGGGAACCTTAGGCAGCATGT-3' Zhang and Hu (2007)
UBC-E2 AK059694 5'-CCGTTTGTAGAGCCATAATTGCA-3' 5'-AGGTTGCCTGAGTCACAGTTAAGTG-3' Jain et al. (2006)
eIF-4α AK073620 5'-TTGTGCTGGATGAAGCTGATG-3' 5'-GGAAGGAGCTGGAAGATATCATAGA-3' Jain et al. (2006)
Eef-1α AK061464 5'-TTTCACTCTTGGTGTGAAGCAGAT-3' 5'-GACTTCCTTCACGATTTCATCGTAA-3' Zhang and Hu (2007)
UBQ10 AK101547 5'-TGGTCAGTAATCAGCCAGTTTGG-3' 5'-GCACCACAAATACTTGACGAACAG-3' Jain et al. (2006)
UBQ5 AK061988 5'-ACCACTTCGACCGCCACTACT-3' 5'-ACGCCTAAGCCTGCTGGTT-3 Jain et al. (2006)
GAPDH AK064960 5'-AAGCCAGCATCCTATGATCAGATT-3' 5'CGTAACCCAGAATACCCTTGAGTTT-3' Jain et al. (2006)
TIP41 - Like AK103511 5'-GTTTGGATGAACCCCGCAA-3' 5'-GGCAACAAGGTCAATCCGATC-3' Caldana et al. (2007)
Cyclophilin AK121304 5'-CCACCATCACAGATCGGATCTT-3' 5'-GCGGTCAGAGCGAAAGTAGCTA-3' Caldana et al. (2007)
OsAPX2 AK061715 5’-CTCTCCTACGCCGACTTCTAC-3’ 5’-AGGTGGTCAGAACCTTGTGT-3’ -
OsGR2 AK100446 5’-CACCTGTTGCACTGATGGAG-3’ 5’- GTTCACTCAAGCCCACTACTG-3’ -
OsCATC AK066378 5’-GTGATTGCCAAGGAGAACAAC-3’ 5’- GAGTGCGTCGATCCATCTCT-3’ -
OsSODCc1-Cu/Zn AK061662 5’-CTGATGATCTTGGAAAGGGTGG-3’ 5’- GTGCTGGGAGATGGAAGGT-3’ -
RT-qPCRs
The total volume of the RT-qPCRs was 12 μL, including 6.25 μL SYBR Green fluorophore (Applied Biosystems®), 0.25 μL 10 mM of each primer (forward and reverse), 1 μL cDNA (1:5 dilution previously defined), and 4.25 μL ultrapure water. The reactions were carried out in a Bio-Rad® CFX Real Time thermocycler, using the following amplification parameters: 95°C for 10 min, 40 95°C cycles for 15 s, 60°C for 1 min with insertion of the melting curve from 65° to 95°C, with a 5°C increase at every fluorescence measure. For each biological repetition, three (triplicate) technical repetitions were carried out, including samples for the control treatment as template-free controls.
Reference gene stability analyses
collections were used for each one of the genotypes. Normal programs for this type of analysis were used, such as geNorm (Vandesompele et al., 2002), NormFinder (Andersen et al., 2004), BestKeeper (Pfaffl et al., 2004), the ΔCt comparative method (Silver et al., 2006), and the RefFinder tool. The GeNorm algorithm first calculates an expression stability value (M) for each gene and then compares the variation of pairs (V) of this gene with the others. Genes with highly variable results have a high M value (>0.5), which indicates low expression stability.
NormFinder provides a ranking of the most stable to the least stable gene, based on the stability value of each one, which consists of a direct measure for the estimated variation of expression (Andersen et al., 2004). BestKeeper is a program based on Excel, which uses the gross values (Cq values) and efficiency of PCR to determine the most suitable reference gene, together with a coefficient index and determination of the value of P (Pfaffl et al., 2004). The ΔCt comparative method compares the relative expression of the genes in pairs within the samples in order to indicate the best reference gene (Silver et al., 2006). The RefFinder tool (http://fulxie.0fees.us/?type=reference) was also used, which integrates the geNorm, NormFinder, and BestKeeper programs, and the ΔCt comparative method, to compare and classify the candidate reference genes.
Validation analyses of the reference genes
In order to confirm the choice of potential reference genes as normalizers for subsequent analyses, the transcriptional profiles were observed of codifier genes of the isoforms of enzymes of the antioxidant system: ascorbate peroxidase (OsAPX2), glutathione reductase (OsGR2), catalase (OsCATC), and superoxide dismutase (OsSODCc1-Cu/Zn). These genes were quantified and normalized with the most stable gene (UBQ10) and less stable gene (eIF-1α). The amplification conditions for RT-qPCR were equal to those previously described. The relative expression data were calculated according to the 2-ΔΔCq
method (Livak and Schmittgen, 2001).
RESULTS
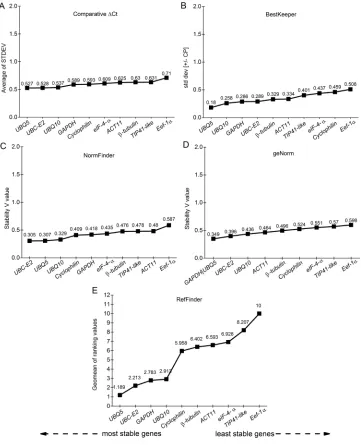
Reference genes, used for transcription level studies, should have a constant level of expression between the samples studied, and thus the values of the quantification cycle (Cq), also called the threshold cycle (Ct), were used to determine the fluctuation in the expression of the candidate reference genes evaluated in this study.
Observing the gross Cq values, via the BoxPlot graph, it is noted that for BRS Bojuru the genes with the lowest and highest variation around the average Cq were UBQ10 and
Eef-1α, respectively, observed by the size of the box (the bigger the box, the greater the variation), and so UBQ10 presents the best result (Figure 1A). For BRS Pampa, the UBQ10 gene presents the smallest variation between the maximum and minimum values, while for cyclophilin,
Eef-1α, and eIF-4α, the greatest variations were observed (Figure 1B).
Figure 1. Expression levels of the different candidate reference genes. The expression data are shown by the values
of the RT-qPCR quantification cycle (Cq), in the BRS Bojuru (A) and BRS Pampa (B) genotypes, in the vegetative stage under low temperature (13°C) stress. The line in the middle of the box represents the average expression.
The lower quartile is the value at 25% of the ordered sample. The upper quartile is the value at 75% of the ordered
sample. The extremities indicate the maximum and minimum values. The bigger the box, the greater the variation.
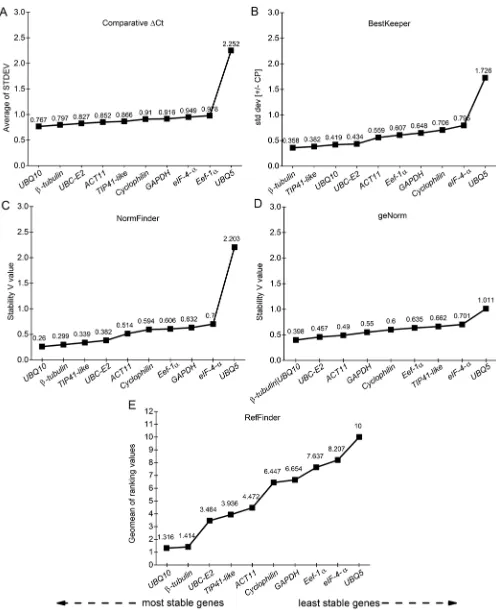
By analyzing only the BRS Bojuru genotype, it is observed that, according to the software, UBQ10 and β-tubulin are the most indicated genes as reference genes, due to the smallest variations presented by them. However, in contrast with what was observed by analyzing the genotypes together, UBQ5 was not the least stable gene, this instead being
Eef-1α (Figure 3).
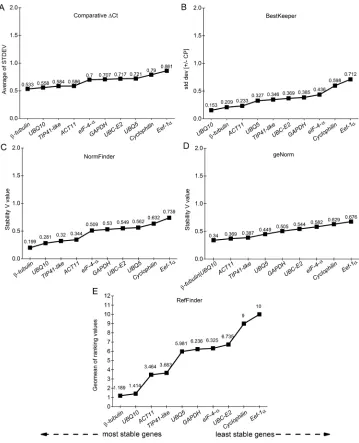
In the BRS Pampa genotype the results were the opposite of those that were observed by analyzing the genotypes together, given that for this genotype UBQ5 was indicated by all of the softwares as the gene with the smallest variation. In relation to the least indicated, the results were similar, revealing the Eef-1α gene to be the most variable (Figure 4).
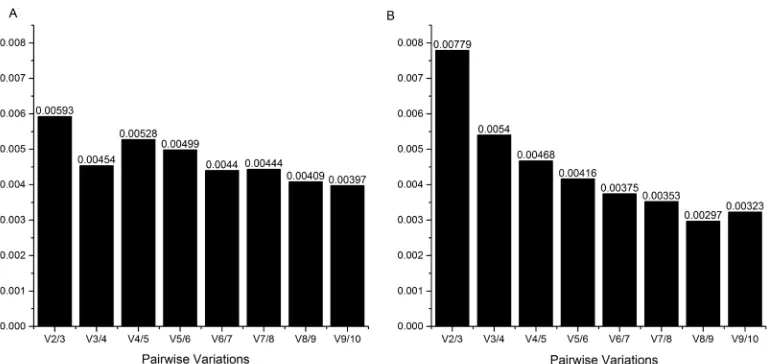
The geNorm software also indicated the minimum number of genes for the ideal reference genes, via the Pairwise calculation between two sequential normalization factors (Vn/Vn +1), and thus determined the need to add more normalization genes. Knowing that the minimum value to determine the need to add more normalization genes is 0.15, by observing this calculation in both genotypes analyzed together, it is believed that the use of two reference genes is sufficient, since the V2/3 value was 0.0078. If only one of the genotypes, BRS Bojuru or BRS Pampa, was used in the studies, two reference genes would also be sufficient given that V2/3 was lower than the cut-off point in both genotypes (Figure 5).
Figure 5. Pairwise variation (V) calculated by the geNorm algorithm to determine the minimum number of reference genes for adequate normalization in leaves of rice genotypes BRS Bojuru (A) and BRS Pampa (B), in the vegetative stage, subjected to low temperature (13 C) stress during different periods of time.
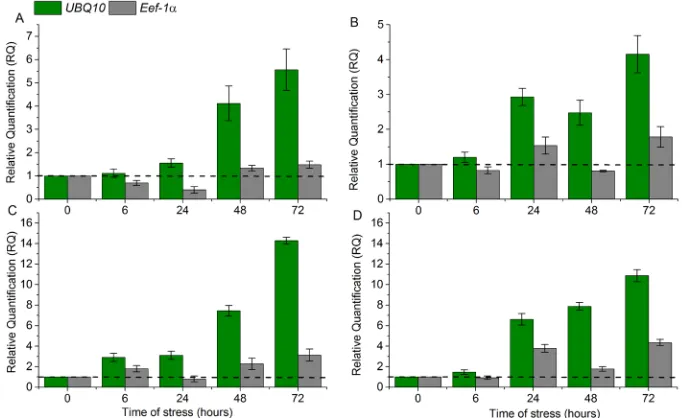
In order to validate and demonstrate the importance of adequate use of reference genes, the relative quantification (RQ) of expression value was calculated for some codifier genes of the isoforms of the enzymes ascorbate peroxidase (APX), glutathione reductase (GR), superoxide dismutase (SOD), and catalase (CAT), using the most and least indicated genes for normalization in each genotype.
For the gene of the APX2 isoform, both for Bojuru and BRS Pampa, the greatest difference in relative expression values was observed at 72 h. For the most indicated reference genes, UBQ10, the values were 13.21 and 10.88, and for the least indicated reference genes (Eef-1α), they were 3.07 and 3.70, respectively (Figure 6A and 6B). As for the gene that codifies the GR2 isoform in 72 h, for BRS Bojuru with UBQ10 the expression value was 3.25 and for BRS Pampa it was 5.63, while with the Eef-1α gene the RQ values were 0.73 and 2.92, respectively (Figure 6C and 6D).
Figure 6. Relative quantification (RQ) of expression of the genes that codify the APX2 (A and B) and GR2 (C and
D) isoforms in leaves of the rice genotypes BRS Bojuru (A and C) and BRS Pampa (B and D) subjected to a low temperature (13°C) in the vegetative stage. The most adequate reference genes (UBQ10) is represented in green, while the least indicated (eIF-1α) is represented in gray. The control samples were used as reference samples. The data show the average ± expression and standard deviation calculated based on three biological replicates.
DISCUSSION
Protein synthesis in eucaryotes basically occurs in three stages: initiation, elongation, and termination. For these three stages to be able to occur, not only ribosome, mRNA, and aminoacyl RNA transferase (aa-tRNA) are needed, but also many other soluble proteins that facilitate these processes. Once the translation is initiated, the first codon is linked to subunit 80C of the ribosome, followed by the elongation phase in which the peptide chain increases its length, cyclically adding one amino acid at a time. The aa-tRNA addition step is catalyzed by the 1α (eIF-1α) elongation complex. Besides this primordial function, studies have shown that this complex is involved in a variety of cellular processes (Sasikumar et al., 2012).
Relationships have been established between the organization of the cytoskeleton and the protein translation process. Actin is the principal component involved, playing a significant role in the regulation and efficiency of translation. It has been observed that small perturbations in the cells produce a negative effect on translation, although the levels of global components remained similar to those of the intact cells (Stapulionis et al., 1997). Since the discovery of the interaction between eIF-1α and actin (Yang et al., 1990), various studies have characterized and shown that cellular alterations, such as change of pH, decrease the affinity of actin with eIF-1α (Murray et al., 1996).
The eIF-1α gene has been identified as a stable reference gene in some species, including members of the Poaceae family, such as Brachiaria (Silveira et al., 2009), Lolium (Dombrowski and Martin, 2009), perennial ryegrass (Lee et al., 2010), and rice (Li et al., 2010). However, in our study, it is presented as the most unstable gene in both genotypes, which may be the result of the low temperatures, which physically (Almeida et al., 2016) and biochemically alter the cells. Similarly to this study, by evaluating rice plants subjected to saline stress, Moraes et al. (2015) showed that the eIF-1α gene presented considerable instability when used as a reference gene.
However, another structural gene evaluated, β-tubulin, was shown to have considerable stability in the BRS Bojuru genotype, and can thus serve as a reference gene for studies of the japonica subspecies involving low temperatures. Brunner et al. (2004), in a study on plants of the Populus genus, obtained significant results using tubulin genes as housekeeping. However, Expósito-Rodríguez et al. (2008) identified tubulin genes as the most unstable in studies of Solanum lycopersicum involving different organs and stages of development. Thus, we can perceive the plasticity of the reference gene function of these genes, which varies according to the species and situation studied, thus showing the importance of prior studies involving housekeeping in order to analyze transcripts.
Glyceraldehyde 3-phosphate dehydrogenase (GAPDH) is a key enzyme involved in glycolysis, and is also a gene that is commonly used as reference gene in RT-qPCR analyses (Goidin et al., 2001). In this study, it was verified that the level of stability in the expression of GAPDH was different between the O. sativa genotypes analyzed. For BRS Bojuru, the values obtained showed that this gene is among the most stable in low temperature conditions. On the other hand, for BRS Pampa, the stability values of GAPDH were better, with this being among the most indicated by the geNorm software. Thus, care should be taken when using the GAPDH gene as housekeeping, as it has already been shown that the transcript expression corresponding to genes that codify glycolytic enzymes is activated to maintain homeostasis in rice cells under stress conditions (Pareek et al., 1998).
of their main functions is to accelerate the isomerization reaction of the cis link to the trans link and facilitate the binding process (Romano et al., 2004a). However, due to their ubiquitous nature, it becomes difficult to limit the attribution of functions to cyclophilins. Nevertheless, it has been shown that the expression of cyclophilins in plants is induced in various stress situations, such as exposure to HgCl2, viral infections, and high and low temperatures, among others, with its role in the binding of proteins and its redox modulation appearing to be essential for inhibiting the detrimental effects resulting from these stress situations (Romano et al., 2004b). This claim supports the results obtained in our paper, which showed that the cyclophilin gene presented significant variations of expression, and consequently high instability values, especially in the BRS Bojuru genotype.
Ubiquitinization frequently occurs via the formation of an isopeptide link between C of the ubiquitin and the amino group of lysine residues of a substrate, marking the protein to be degraded via proteasome (Heride et al., 2014). Ubiquitin genes have been associated with the DNA repair mechanism, regulation of the cellular cycle, modification of kinase, endocytosis, and regulation of other cellular signaling pathways, in order to protect and control vegetal metabolism (Walton et al., 2016).
In our study, the genes related to ubiquitinization, UBQ10, UBQ5, and UBC-E2, were shown to be stable under abiotic stress conditions involving low temperatures, for both rice genotypes, possibly indicating that this environmental condition does not have a significant influence on the expression of these constitutive genes. A similar result was found in a study involving rice plants subjected to hydric deficit, in which UBQ5 and UBC-E2 were the most indicated reference gene (Auler et al., 2017).
The production of reactive oxygen species (ROS) occurs naturally and is associated with respiratory and photosynthetic metabolism, representing a normal metabolic condition of vegetal cells. In stress conditions, an alteration occurs in the cellular balance, causing an accumulation of ROS in the cell, and can thus result in oxidative damage (Ahmad et al., 2010a). It is known that in rice plants, genes exist that codify different isoforms of the enzymes involved in the antioxidant defense system, described as genetic families (Yamane et al., 2010).
In this paper, variations were observed in the relative expression values of the SODCc1-Cu/Zn, CATC, APX2, and GR2 genes when normalized with the most stable reference gene in comparison with the least stable. This observation shows that the use of inadequate genes as housekeeping leads to erroneous results and thus masks any real understanding of genetic behavior in the face of a particular condition.
CONCLUSION
relevance for subsequent analyses of genetic expression in rice leaves in low temperature conditions.
ACKNOWLEDGMENTS
Research supported by the following Brazilian funding agencies: Coordenação de Aperfeiçoamento de Pessoal de Nível Superior (CAPES) - student grants, Conselho Nacional de Desenvolvimento Científico e Tecnológico (CNPq) - E.J.B. Braga productivity grant, and Fundação de Amparo à Pesquisa do Estado do Rio Grande do Sul (FAPERGS).
REFERENCES
Almeida DM, Almadanim MC, Lourenço T, Abreu IA, et al. (2016). Screening for abiotic stress tolerance in rice: salt, cold, and drought. Methods Mol. Biol. 1398: 155-182. https://doi.org/10.1007/978-1-4939-3356-3_14
Ahmad P, Jaleel CA, Salem MA, Nabi G, et al. (2010a). Roles of enzymatic and nonenzymatic antioxidants in plants during abiotic stress. Crit. Rev. Biotechnol. 30: 161-175. https://doi.org/10.3109/07388550903524243
Andersen CL, Jensen JL and Ørntoft TF (2004). Normalization of real-time quantitative reverse transcription-PCR data: a model-based variance estimation approach to identify genes suited for normalization, applied to bladder and colon cancer data sets. Cancer Res. 64: 5245-5250. https://doi.org/10.1158/0008-5472.CAN-04-0496
Auler PA, Benitez LC, do Amaral MN, Vighi IL, et al. (2017). Evaluation of stability and validation of reference genes for
RT-qPCR expression studies in rice plants under water deficit. J. Appl. Genet. 58: 163-177. https://doi.org/10.1007/ s13353-016-0374-1
Brunner AM, Yakovlev IA and Strauss SH (2004). Validating internal controls for quantitative plant gene expression studies. BMC Plant Biol. 4: 14. https://doi.org/10.1186/1471-2229-4-14
Bustin SA (2002). Quantification of mRNA using real-time reverse transcription PCR (RT-PCR): trends and problems. J. Mol. Endocrinol. 29: 23-39. https://doi.org/10.1677/jme.0.0290023
Caldana C, Scheible W-R, Mueller-Roeber B and Ruzicic S (2007). A quantitative RT-PCR platform for high-throughput expression profiling of 2500 rice transcription factors. Plant Methods 3: 7. https://doi.org/10.1186/1746-4811-3-7
Chen IC, Hill JK, Ohlemüller R, Roy DB, et al. (2011). Rapid range shifts of species associated with high levels of climate warming. Science 333: 1024-1026. https://doi.org/10.1126/science.1206432
Chinnusamy V, Zhu J and Zhu JK (2007). Cold stress regulation of gene expression in plants. Trends Plant Sci. 12: 444-451. https://doi.org/10.1016/j.tplants.2007.07.002
Cotsaftis O, Plett D, Johnson AAT, Walia H, et al. (2011). Root-specific transcript profiling of contrasting rice genotypes
in response to salinity stress. Mol. Plant 4: 25-41. https://doi.org/10.1093/mp/ssq056
Cruz-Rus E, Amaya I, Sánchez-Sevilla JF, Botella MA, et al. (2011). Regulation of L-ascorbic acid content in strawberry fruits. J. Exp. Bot. 62: 4191-4201. https://doi.org/10.1093/jxb/err122
Czechowski T, Stitt M, Altmann T, Udvardi MK, et al. (2005). Genome-wide identification and testing of superior reference
genes for transcript normalization in Arabidopsis. Plant Physiol. 139: 5-17. https://doi.org/10.1104/pp.105.063743
Derveaux S, Vandesompele J and Hellemans J (2010). How to do successful gene expression analysis using real-time PCR.
Methods 50: 227-230. https://doi.org/10.1016/j.ymeth.2009.11.001
Dombrowski J and Martin R (2009). Evaluation of reference genes for quantitative RT-PCR in Lolium temulentum under abiotic stress. Plant Sci. 176: 390-396. https://doi.org/10.1016/j.plantsci.2008.12.005
Expósito-Rodríguez M, Borges AA, Borges-Pérez A and Pérez JA (2008). Selection of internal control genes for quantitative real-time RT-PCR studies during tomato development process. BMC Plant Biol. 8: 131. https://doi. org/10.1186/1471-2229-8-131
Gilmour SJ, Sebolt AM, Salazar MP, Everard JD, et al. (2000). Overexpression of the Arabidopsis CBF3 transcriptional activator mimics multiple biochemical changes associated with cold acclimation. Plant Physiol. 124: 1854-1865.
https://doi.org/10.1104/pp.124.4.1854
Goidin D, Mamessier A, Staquet MJ, Schmitt D, et al. (2001). Ribosomal 18S RNA prevails over glyceraldehyde-3-phosphate dehydrogenase and beta-actin genes as internal standard for quantitative comparison of mRNA levels in invasive and noninvasive human melanoma cell subpopulations. Anal. Biochem. 295: 17-21. https://doi.org/10.1006/ abio.2001.5171
thaliana. PloS Genet. 1: e26.
Heride C, Urbé S and Clague MJ (2014). Ubiquitin code assembly and disassembly. Curr. Biol. 24: R215-R220. https:// doi.org/10.1016/j.cub.2014.02.002
Jain M, Nijhawan A, Tyagi AK and Khurana JP (2006). Validation of housekeeping genes as internal control for studying gene expression in rice by quantitative real-time PCR. Biochem. Biophys. Res. Commun. 345: 646-651. https://doi. org/10.1016/j.bbrc.2006.04.140
Karki S, Rizal G and Quick WP (2013). Improvement of photosynthesis in rice (Oryza sativa L.) by inserting the C4 pathway. Rice (N. Y.) 6: 28. https://doi.org/10.1186/1939-8433-6-28
Kovach MJ, Sweeney MT and McCouch SR (2007). New insights into the history of rice domestication. Trends Genet. 23: 578-587. https://doi.org/10.1016/j.tig.2007.08.012
Lee JM, Roche JR, Donaghy DJ, Thrush A, et al. (2010). Validation of reference genes for quantitative RT-PCR studies of gene expression in perennial ryegrass (Lolium perenne L.). BMC Mol. Biol. 11: 8. https://doi.org/10.1186/1471-2199-11-8
Livak KJ and Schmittgen TD (2001). Analysis of relative gene expression data using real-time quantitative PCR and the
2(-Δ Δ C(T)) Method. Methods 25: 402-408. https://doi.org/10.1006/meth.2001.1262
Li Q, Sun S, Yuan D, Yu H, et al. (2010). Validation of candidate reference genes for the accurate normalization of real-time quantitative RT-PCR data in rice during seed development. Plant Mol. Biol. Report. 28: 49-57. https://doi. org/10.1007/s11105-009-0124-1
Ma Y, Dai X, Xu Y, Luo W, et al. (2015). COLD1 confers chilling tolerance in rice. Cell 160: 1209-1221. https://doi. org/10.1016/j.cell.2015.01.046
Maroufi A, Van Bockstaele E and De Loose M (2010). Validation of reference genes for gene expression analysis in
chicory (Cichorium intybus) using quantitative real-time PCR. BMC Mol. Biol. 11: 15. https://doi.org/10.1186/1471-2199-11-15
Moraes GP, Benitez LC, do Amaral MN, Vighi IL, et al. (2015). Evaluation of reference genes for RT-qPCR studies in the leaves of rice seedlings under salt stress. Genet. Mol. Res. 14: 2384-2398. https://doi.org/10.4238/2015.March.27.24
Munsky B, Neuert G and van Oudenaarden A (2012). Using gene expression noise to understand gene regulation. Science
336: 183-187. https://doi.org/10.1126/science.1216379
Murray JW, Edmonds BT, Liu G and Condeelis J (1996). Bundling of actin filaments by elongation factor 1 alpha inhibits polymerization at filament ends. J. Cell Biol. 135: 1309-1321. https://doi.org/10.1083/jcb.135.5.1309
Nakashima K, Ito Y and Yamaguchi-Shinozaki K (2009). Transcriptional regulatory networks in response to abiotic stresses in Arabidopsis and grasses. Plant Physiol. 149: 88-95. https://doi.org/10.1104/pp.108.129791
Pareek A, Singla SL and Grover A (1998). Protein alterations associated with salinity, desiccation, high and low temperature stresses and abscisic acid application in seedlings of Pusa 169, a high-yielding rice (Oryza sativa L.). Curr. Sci. 75: 1023-1035.
Pfaffl MW, Tichopad A, Prgomet C and Neuvians TP (2004). Determination of stable housekeeping genes, differentially
regulated target genes and sample integrity: BestKeeper--Excel-based tool using pair-wise correlations. Biotechnol. Lett. 26: 509-515. https://doi.org/10.1023/B:BILE.0000019559.84305.47
Radonić A, Thulke S, Mackay IM, Landt O, et al. (2004). Guideline to reference gene selection for quantitative real-time
PCR. Biochem. Biophys. Res. Commun. 313: 856-862. https://doi.org/10.1016/j.bbrc.2003.11.177
Rasmussen R (2001). Quantification on the LightCycler. In: Rapid cycle real-time PCR (Meuer S, Wittwer C and
Nakagawara KI, eds.). Methods and Applications, Springer, Berlin, 21-34.
Romano PG, Horton P and Gray JE (2004a). The Arabidopsis cyclophilin gene family. Plant Physiol. 134: 1268-1282.
https://doi.org/10.1104/pp.103.022160
Romano P, He Z and Luan S (2004b). Introducing immunophilins. From organ transplantation to plant biology. Plant Physiol. 134: 1241-1243. https://doi.org/10.1104/pp.103.900108
Sang T and Ge S (2007). Genetics and phylogenetics of rice domestication. Curr. Opin. Genet. Dev. 17: 533-538. https:// doi.org/10.1016/j.gde.2007.09.005
Sasikumar AN, Perez WB and Kinzy TG (2012). The many roles of the eukaryotic elongation factor 1 complex. Wiley Interdiscip. Rev. RNA 3: 543-555. https://doi.org/10.1002/wrna.1118
Silver N, Best S, Jiang J and Thein SL (2006). Selection of housekeeping genes for gene expression studies in human reticulocytes using real-time PCR. BMC Mol. Biol. 7: 33. https://doi.org/10.1186/1471-2199-7-33
Silveira ED, Alves-Ferreira M, Guimarães LA, da Silva FR, et al. (2009). Selection of reference genes for quantitative real-time PCR expression studies in the apomictic and sexual grass Brachiaria brizantha.BMC Plant Biol. 9: 84.
https://doi.org/10.1186/1471-2229-9-84
J. Biol. Chem. 272: 24980-24986. https://doi.org/10.1074/jbc.272.40.24980
Vandesompele J, De Preter K, Pattyn F, Poppe B, et al. (2002). Accurate normalization of real-time quantitative RT-PCR data by geometric averaging of multiple internal control genes. Genome Biol. 3: 0034.
Walia H, Wilson C, Condamine P, Liu X, et al. (2005). Comparative transcriptional profiling of two contrasting rice
genotypes under salinity stress during the vegetative growth stage. Plant Physiol. 139: 822-835. https://doi. org/10.1104/pp.105.065961
Walton A, Stes E, Cybulski N, Van Bel M, et al. (2016). It’s time for some “site”- seeing: novel tools to monitor the
ubiquitin landscape in Arabidopsis thaliana.Plant Cell 28: 6-16.
Wan H, Zhao Z, Qian C, Sui Y, et al. (2010). Selection of appropriate reference genes for gene expression studies by
quantitative real-time polymerase chain reaction in cucumber. Anal. Biochem. 399: 257-261. https://doi.org/10.1016/j. ab.2009.12.008
Yamaguchi-Shinozaki K and Shinozaki K (2006). Transcriptional regulatory networks in cellular responses and tolerance to dehydration and cold stresses. Annu. Rev. Plant Biol. 57: 781-803. https://doi.org/10.1146/annurev. arplant.57.032905.105444
Yamane K, Mitsuya S, Taniguchi M and Miyake H (2010). Transcription profiles of genes encoding catalase and ascorbate
peroxidase in the rice leaf tissues under salinity. Plant Prod. Sci. 13: 164-168. https://doi.org/10.1626/pps.13.164
Yang SY, Yang XY, Healy-Louie G, Schulz H, et al. (1990). Nucleotide sequence of the fadA gene. Primary structure of 3-ketoacyl-coenzyme A thiolase from Escherichia coli and the structural organization of the fadAB operon. J. Biol. Chem. 265: 10424-10429.
Yoshida S, Forno DA, Cock JH and Gomez KA (1976). Laboratory manual for physiological studies of rice. 3rd edn. International Rice Research Institutes, Manila, Philippines.
Zhang JZ, Creelman RA and Zhu JK (2004). From laboratory to field. Using information from Arabidopsis to engineer salt, cold, and drought tolerance in crops. Plant Physiol. 135: 615-621. https://doi.org/10.1104/pp.104.040295 Zhang Z and Hu J (2007). Development and validation of endogenous reference genes for expression profiling of medaka