A Parameter Based Heart Disease Detection
Technique using Mining Technique
P.Sambasiva Rao1 and Dr. T.Uma Devi2
I. INTRODUCTION
The heart or the cardiovascular diseases have a huge impact on the death rates in the world especially in the developing countries. Celtia et al in the year of 2000 have proven that cardiovascular diseases cause 25% of the deaths. The work presented by World Bank Country groups in the year of 2001, had cited the health rate by heart diseases around 25%. However the work of Mathers et al presented in the year of 2004, had analysed the death rate as 46%, which is a notable increase in the span of 4 years. It is predicted that in the year of 2020 an approximated 2.5 million people from India are likely to be severely affected by heart diseases. In spite of the best clinical practices and available medications, the death rates are increasing and expected to be 55% in India by the end of 2020.
The focus of this work is to demonstrate a Novel Multilayer Perceptron Model to Detect Heart Disease Severity and motivated by the work of Asha Gowda et al. [1].
Also this work analyses the recent research outcomes from the parallel works. The present research trends are directing towards a more specific and focused study of predictive models for determining the severity of the heart diseases based on the clinical results and best possible computing techniques in Data Mining [2][3][4][5][6].
The outcomes from work of Huyan Wang at al had proposed a traditional model for Chinese medical practitioners based on a computing model to diagnosis based on the Bayesian model.
Also the works been carried out with the perspective of generic algorithm in order to produce expert systems are notable for prediction and diagnosis of heart diseases [7]. The work of Assanelli et al in the year of 1993 demonstrates the use of ECG data to predict the heart diseases. Meanwhile, G. Ng et al has developed a chest pain expert system, which diagnoses the cause of chest pain leading towards the cardiac attacks.
Text classification techniques combined with a Naive Bayes classifier and relational learning algorithms are methods explained by Jennifer G et al [8] in the year of 1999. Hidden Markov Models are used in Craven in the year of 2001, but similar work to Rosario and Hearst was produced in the year of 2004, the research focus was entity recognition. A context based approach using MeSH term
1 GITAM University, Visakhapatnam- 530 045 2 GITAM University, Visakhapatnam – 530 045
e-ISSN:2278-621X
Abstract—With the recent outbound spread of chronicle heart diseases across the world, irrespective of gender and age, the medical practitioners are focusing on preventive measures rather than curing methods. Thus the modern research trends are bound to provide the preventive extension to the medical science. Although the medical practices can generate gigantic amount of relevant data pertaining to the diseases, however the medical science fail to deploy any technique to mine the data for predictive models. Thus the data mining and predictive models are the most suitable way to provide the necessary tools for predictive analysis. The work deploys a novel principle attribute analysis to understand the orientation of the attributes affecting the results. The work is based on UCI database and implements a novel approach to extract the parameters influencing disease detection. The final outcome of this work is to generate the most influencing heart Disease detecting parameters.
co-occurrences are used by Srinivasan and Rindflesch for relationship discrimination between diseases and drugs. A lot of work is focused on building rules used to extract relation. Feldman et al. used a rule-based system to extract relations that are focused on genes, proteins, drugs, and diseases and demonstrated in 2002. Friedman et al. go deeper into building a rule-based system by hand-crafting a semantic grammar and a set of semantic constraints in order to recognize a range of biological and molecular relations.
In biomedical literature, rule-based approaches have been widely used for solving relation extraction tasks. The main sources of information used by this technique are either syntactic: part-of-speech (POS) and syntactic structures; or semantic information in the form of fixed patterns that contain words that trigger a certain relation. One of the drawbacks of using methods based on rules is that they tend to require more human-expert effort than data-driven methods. The best rule-based systems are the ones that use rules constructed manually or semi automatically—extracted automatically and refined manually. A positive aspect of rule-based systems is the fact that they obtain good precision results, while the recall levels tend to be low. Syntactic rule-based relation extraction systems are complex systems based on additional tools used to assign POS tags or to extract syntactic parse trees. It is known that in the biomedical literature such tools are not yet at the state-of-the-art level as they are for general English texts, and therefore their performance on sentences is not always the best.
Henceforth this work can be visualized as the potential findings of work and guidelines for the performance of a framework that is capable to find relevant information about diseases and treatments in a medical domain repository. The results that obtained will show that it is a realistic scenario to use NLP and ML techniques to build a tool that capable to identify and disseminate textual information related to diseases and treatments.
Thus this work identifies the problems in the existing and parallel research outcomes as:
Firstly, a lot of data pertaining to cardiac Disease are available, but the datasets are over populated with multiple parameters. The outcome of processing multiple parameters leads to high computational complexity and processing less parameter may lead to lower order of accuracy in prediction. Hence, there is a clear demand for a technique to identify most appropriate set of parameters to be processed during predictive analysis [9] [10] [11] [12] [13] [14].
Secondly, there are various computation techniques deployed to timely predict with less computational complexity. However, the neural network based programming approaches are proven to be time efficient. Henceforth, there is also a demand for finding the optimal neural network setup for predictive analysis [15] [16] [17] [18].
II. PROPOSED FRAMEWORK FOR PRE-PROCESSING
The first step of this proposed work is the pre-processing framework for determining and extracting the influential parameters. The most appropriate algorithm for feature or attribute selection is a Genetic algorithm [1] [7], where initially all the attributes are considered as individual subsets and the final combination of the attributes or features are noted as optimal best feature subset. The framework is been proposed here:
Step-1.Calculate and Collect the list of attributes to be ordered in terms of significance:
)
[] (
1
n
M P pi
i
(1)
Where, M denotes the initial set of attributes, P denotes the total available list of attributes.
Step-2. Assign the selection vector as S[L] where L is the size of the initial attribute list. Initially the vector is filled with zeros to denote no optimal subset is selected.
Step-3.In this step of the algorithm, the fitness for all the attributes is been calculated so that the ranking can be provided for the features against all other attributes.
( )
1 ( , ),
( , ) ( 1, 1)
1 ( , ),
InfoGain Si
InfoGainClass Si i
if InfoGainClass Si i InfoGain Classi Si
InfoGainClass Si i Else
(3) Step-4. Once the attributes are been ranked, the final selected subset is produced.
[ ] ( Gain( ))
S m Highest Info M (4)
The work analyses the data set provided by UCI machine learning [19]. Each database has the same instance format. While the databases have 76 raw attributes. The descriptions of the dataset parameters are provided here [Table – 1]:
TABLEI:UCIHEART DISEASE DATABASES Serial
Number Parameter Names Parameter Descriptions
1 ID Patient identification number
2 CCF Social security number (I replaced this with a dummy value of 0)
3 AGE Age in years
4 SEX Sex (1 = male; 0 = female)
5 PAINLOC Chest pain location (1 = substernal; 0 = otherwise) 6 PAINEXER (1 = provoked by exertion; 0 = otherwise)
7 RELREST (1 = relieved after rest; 0 = otherwise) 8 PNCADEN (Sum of 5, 6, and 7)
9 CP
Chest pain type
-- Value 1 typical angina -- Value 2 atypical angina -- Value 3 non-anginal pain -- Value 4 asymptomatic
10 TRESTBPS Resting blood pressure (in mm Hg on admission to the hospital
11 HTN Not Defined
12 CHOL Serum cholestoral in mg/dl
13 SMOKE I believe this is 1 = yes; 0 = no (is or is not a smoker) 14 CIGS (Cigarettes per day)
15 YEARS (Number of years as a smoker)
16 FBS (Fasting blood sugar > 120 mg/dl) (1 = true; 0 = false) 17 DM (1 = history of diabetes; 0 = no such history)
18 FAMHIST Family history of coronary artery disease (1 = yes; 0 = no)
19 RESTECG
Resting electrocardiographic results -- Value 0 normal
-- Value 1 having ST-T wave abnormality (T wave inversions and/or ST
elevation or depression of > 0.05 mv)
-- Value 2 showing probable or definite left ventricular hypertrophy
20 EKGMO (month of exercise ECG reading) 21 EKGDAY (day of exercise ECG reading) 22 EKGYR (year of exercise ECG reading)
23 DIG (digitalis used furing exercise ECG 1 = yes; 0 = no) 24 PROP (Beta blocker used during exercise ECG 1 = yes; 0 = no) 25 NITR (nitrates used during exercise ECG 1 = yes; 0 = no)
26 PRO (calcium channel blocker used during exercise ECG 1 = yes; 0 = no) 27 DIURETIC (diuretic used used during exercise ECG 1 = yes; 0 = no)
28 PROTO
Exercise protocol 1 = Bruce 2 = Kottus 3 = mchenry 4 = fast Balke 5 = Balke 6 = Noughton
7 = bike 150 kpa min/min 8 = bike 125 kpa min/min 9 = bike 100 kpa min/min 10 = bike 75 kpa min/min 11 = bike 50 kpa min/min 12 = arm ergometer
29 THALDUR Duration of exercise test in minutes
30 THALTIME Time when ST measure depression was noted
31 MET Mets achieved
32 THALACH Maximum heart rate achieved 33 THALREST Resting heart rate
34 TPEAKBPS Peak exercise blood pressure (first of 2 parts) 35 PEAKBPD Peak exercise blood pressure (second of 2 parts)
36 DUMMY
37 TRESTBPD Resting blood pressure
38 EXANG Exercise induced angina (1 = yes; 0 = no) 39 XHYPO (1 = yes; 0 = no)
40 OLDPEAK ST depression induced by exercise relative to rest
41 SLOPE
The slope of the peak exercise ST segment -- Value 1 upsloping
-- Value 2 flat
-- Value 3 downsloping 42 RLDV5 Height at rest
43 RLDV5E Height at peak exercise
44 CA Number of major vessels (0-3) colored by flourosopy 45 RESTCKM Irrelevant
46 EXERCKM Irrelevant
47 RESTEF Rest raidonuclid Ejection fraction
48 RESTWM
Rest wall Motion abnormality 0 = none
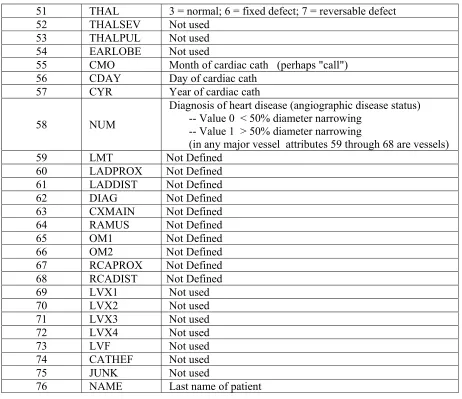
51 THAL 3 = normal; 6 = fixed defect; 7 = reversable defect 52 THALSEV Not used
53 THALPUL Not used 54 EARLOBE Not used
55 CMO Month of cardiac cath (perhaps "call") 56 CDAY Day of cardiac cath
57 CYR Year of cardiac cath
58 NUM
Diagnosis of heart disease (angiographic disease status) -- Value 0 < 50% diameter narrowing
-- Value 1 > 50% diameter narrowing
(in any major vessel attributes 59 through 68 are vessels)
59 LMT Not Defined
60 LADPROX Not Defined 61 LADDIST Not Defined
62 DIAG Not Defined
63 CXMAIN Not Defined 64 RAMUS Not Defined
65 OM1 Not Defined
66 OM2 Not Defined
67 RCAPROX Not Defined 68 RCADIST Not Defined
69 LVX1 Not used
70 LVX2 Not used
71 LVX3 Not used
72 LVX4 Not used
73 LVF Not used
74 CATHEF Not used
75 JUNK Not used
76 NAME Last name of patient
Henceforth, the proposed framework constructs a correlation matrix to rank the attributes most likely to influence the results. Bayes net structure is presented here [Table – 2]:
TABLE II: Bayes Net Structure MERIT SCALE
D Parameter Subsets
0.61438 0.80802 4 7 13 14 19 22 24 25 26 27 29 30 31 32 36 39 40 41 42 44 48 53 55 57 59 60 61 63 65 66 68 70 72 73
0.56553 0.59578 2 4 5 6 7 11 13 19 27 29 30 31 32 40 41 43 44 45 48 49 51 52 54 55 57 59 60 61 62 63 64 65 66 67 70 71 72 73
0.61334 0.80347 4 7 13 14 17 19 22 24 25 26 27 29 30 31 32 36 39 40 41 42 44 48 53 55 57 59 60 61 63 65 66 68 70 72 73
0.57217 0.62464 4 7 13 14 15 19 20 22 24 25 26 27 29 30 31 32 36 39 40 41 42 44 48 53 55 57 59 60 61 63 66 68 70 72 73
0.54682 0.51454 2 6 7 8 9 11 14 20 22 24 25 26 27 29 30 33 36 38 39 40 41 42 43 44 48 51 53 59 60 62 63 64 65 67 68 70 72 73
0.55164 0.53548 2 4 5 7 9 11 13 17 19 27 29 30 31 32 39 40 41 42 44 47 51 53 54 55 57 59 60 61 63 65 66 68 70 72 73
0.57864 0.65273 4 7 13 14 19 22 24 25 26 27 30 31 32 36 39 40 41 43 44 45 48 49 51 52 54 55 57 59 60 61 62 63 64 65 66 67 70 72 73
0.46084 0.14101 4 7 9 12 13 14 19 20 22 24 25 26 27 29 30 31 32 36 39 40 41 42 44 53 55 56 57 59 60 61 63 65 66 68 70 72 73
0.58916 0.69843 2 4 5 6 7 11 13 19 21 22 27 29 30 31 32 39 40 41 43 44 45 48 55 57 59 60 62 63 64 65 67 70 72
0.60163 0.75263 2 4 5 7 11 13 19 22 27 29 30 31 32 39 40 41 43 44 45 48 55 57 59 60 62 63 64 65 67 70 72 73
0.60201 0.75429 2 4 5 7 11 13 19 22 27 29 30 31 32 39 40 41 44 45 55 57 59 60 62 63 64 65 67 70 72 73
0.55207 0.53733 2 3 6 7 11 13 18 19 22 23 29 30 31 32 40 41 44 45 48 51 55 57 59 61 62 63 64 65 67 69 70 72
0.56235 0.58199 4 7 13 14 19 22 24 25 26 27 29 30 31 32 36 39 40 41 42 44 47 48 51 52 53 54 55 57 59 60 61 63 65 66 68 70 72 73
0.5808 0.66213 4 13 14 19 22 24 25 26 27 29 30 31 32 36 39 40 41 42 44 48 53 55 57 60 61 63 66 68 70 72 73
0.6035 0.76075 2 5 7 11 13 19 22 27 29 30 31 32 38 39 40 41 43 44 45 48 55 57 59 60 62 63 64 65 67 70 72
0.47965 0.22275 2 4 5 7 11 13 19 21 22 27 29 30 31 32 34 39 40 41 43 44 45 48 55 57 59 60 62 63 64 65 67 70 72 73
0.56274 0.58368 2 4 5 7 11 13 19 27 29 30 31 32 39 40 41 43 44 45 48 49 51 52 54 55 57 59 60 61 62 63 64 65 66 67 70 72 73
0.44954 0.09193 4 7 12 13 14 19 22 24 25 26 27 29 30 31 32 35 36 37 39 40 41 42 44 48 53 55 57 59 60 62 63 64 67 70 72 76
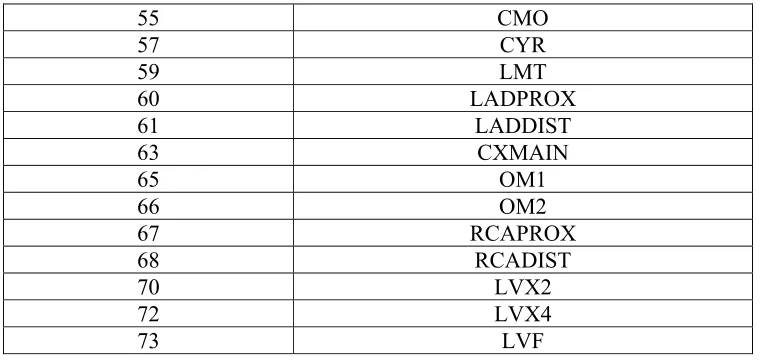
Thus, finally the list of most appropriate attributes influencing the Disease is been listed here [Table – 3]:
TABLE III: ATTRIBUTES INFLUENCING THE DISEASE
Serial Number Parameter Names
4 SEX
7 RELREST
12 CHOL
13 SMOKE
14 CIGS
19 RESTECG
22 EKGYR
24 PROP
25 NITR
26 PRO
27 DIURETIC
29 THALDUR
30 THALTIME
31 MET
32 THALACH
36 DUMMY
39 XHYPO
40 OLDPEAK
41 SLOPE
42 RLDV5
44 CA
48 RESTWM
55 CMO
57 CYR
59 LMT
60 LADPROX
61 LADDIST
63 CXMAIN
65 OM1
66 OM2
67 RCAPROX
68 RCADIST
70 LVX2
72 LVX4
73 LVF
As this work is intended to predict the heart Disease severity, hence the following parameters are also been included with the consideration of redundant attributes. Henceforth the optimal set of attributes for further analysis is listed.
III.RESULTS AND DISCUSSION
The objective of this work is to increase the accurately identify and cluster the dataset motivated by Volfer Rotz et al. [20] for multiple levels of Disease severity. Thus firstly, the categories of the severity are identified [Table – 4].
TABLE IV: CLUSTERS INFORMATION
Disease Severity Cluster Name
No Disease 0
Disease – 1 Major Blood Vessel Blocked 1 Disease – 2 Major Blood Vessels Blocked 2 Disease – 3 Major Blood Vessels Blocked 3 Disease – 4 Major Blood Vessels Blocked 4
After the analysis of the dataset, the following clustering results are been obtained [Table – 5]:
TABLE V: SEVERITY BASED CLUSTERING
Cluster Names 0 1 2 3 4
0 170 12 1 0 0
1 18 8 2 0 0
2 4 8 2 0 0
3 0 9 1 7 1
4 1 3 0 2 8
Henceforth, this work analyses the effect of selected parameters over heart Disease severity detection influences.
Figure 1: Time When St Measure Depression Was Noted for Selected Parameter after Reduction In the analysis this work demonstrates the appropriate distribution over nominal parameter with maximum heart rate achieved [Figure – 2].
Figure 2: Maximum Heart Rate Achieved for Selected Parameter after Reduction
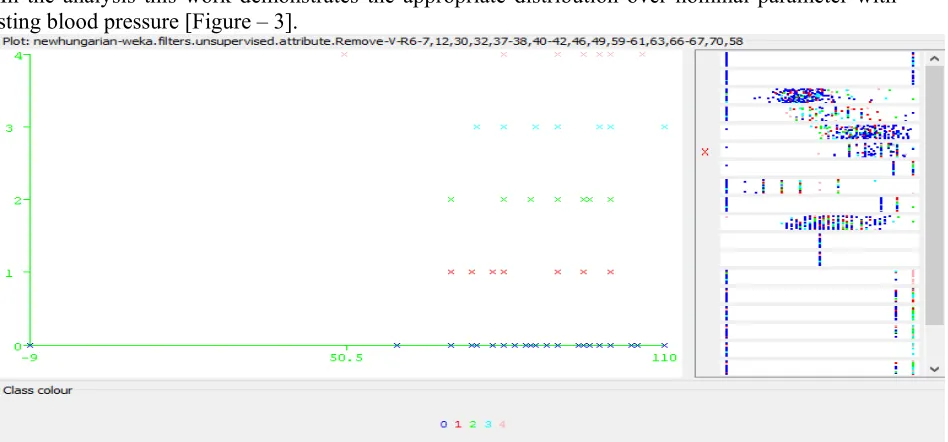
In the analysis this work demonstrates the appropriate distribution over nominal parameter with resting blood pressure [Figure – 3].
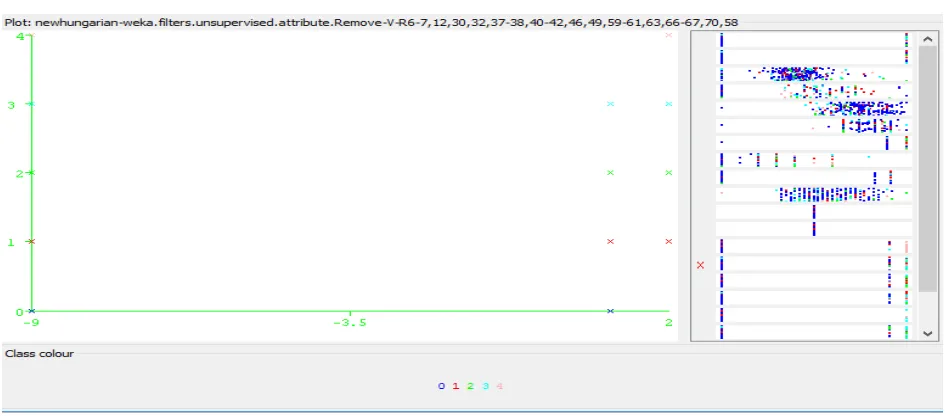
In the analysis this work demonstrates the appropriate distribution over nominal parameter with height at rest [Figure – 4].
Figure 4: Height At Rest for Selected Parameter after Reduction
In the analysis this work demonstrates the appropriate distribution over nominal parameter with major blood vessel branch [Figure – 5].
Figure 5: Major Blood Vessel Branch for Selected Parameter after Reduction
IV.CONCLUSION
REFERENCES
[1] Asha Gowda Karegowda and M.A. Jayaram, March 6-7, 2009. Cascading GA & CFS for Feature Subset Selection in Medical Data Mining. International Conference on IEEE International Advance Computing Conference (IACC’09), Thapar University, Patiala, Punjab India.
[2] I. H. Witten, E. Frank. 2005. Data Mining: Practical machine learning tools and techniques. 2nd Edition, Morgan Kaufmann, San Francisco.
[3] J. Han And M. Kamber. 2001. Data Mining: Concepts and Techniques. San Francisco, Morgan Kauffmann Publishers.
[4] D. Michie, D.J. Spiegelhalter, and C.C. Taylor, "Machine Learning, Neural and Statistical Classification", Ellis Horwood Series in Artificial Intelligence, 1994.
[5] J.R. Quinlan, C4.5: Programs for Machine Learning. Morgan Kaufmann, 1993. [6] Z. Haiyang, "A Short Introduction to Data Mining and Its Applications", IEEE, 2011
[7] D. Goldberg .1989. Genetic Algorithms in Search, Optimization, and Machine learning, Addison Wesley,
[8] Jennifer G. Dy. 2004. Feature Selection for Unsupervised Learning, Journal of Machine Learning, pp845-889.
[9] Manoranjan Dash, Kiseiok Choi, Petr Scheuermann, Huan Liu. 2002. Feature Selection for Clustering – a Filter Solution. In Proceedings of the Second International Conference on Data Mining.
[10] M. Dash 1, H. Liu2. March 1997. Feature Selection for Classification, Intelligent Data Analysis 1 (131–156, www.elsevier.com/locate/ida]
[11] Ron Kohavi, George H. John.1997. Wrappers for feature subset Selection, Artificial Intelligence, Vol. 97, No. 1-2. pp. 273-324.
[12] Shyamala Doraisamy ,Shahram Golzari ,Noris Mohd. Norowi, Md. Nasir B Sulaiman , Nur Izura Udzir. 2008. A Study on Feature Selection and ClassificationTechniques for Automatic Genre Classification of Traditional Malay Music. ismir2008.ismir.net/papers/ISMIR2008 256.pdf(2008).
[13] Mark A. Hall ,Correlation-based Feature Selection for Machine Learning, Dept of Computer science, University of Waikato .http://www.cs.waikato.ac.nz/ mhall/thesis.pdf
[14] Y.Saeys, I.Inza, and P. LarrANNaga,. 2007. A review of feature selection techniquesin bioinformatics, Bioinformatics, 23(19),, pp.2507-2517.
[15] M.A.Jayaram, Asha Gowda Karegowda.2007. Integrating Decision Tree and ANN for Categorization of Diabetics Data. International Conference on Computer Aided Engineering, December 13-15, 2007, IIT Madras, Chennai, India.
[16] P. J. Werbos, "Backpropagation Through Time: What It Does and How to Do It", IEEE, 1990 [17] H. Lu, R. Setiono, and H. Liu, "Effective Data Mining Using Neural Networks", IEEE, 1996 [18] Y. Bengio, J. M. Buhmann, M. Embrechts, and J. M. Zurada, "Introduction to the special
issue on neural networks for data mining and knowledge discovery," IEEE Trans. Neural Networks, vol. 11, pp. 545-549, 2000.
[19] UCI Machine Learning Repository: http://archive.ics.uci.edu/ml/datasets.html
About the Authors:
Mr.P.Sambasiva Rao is a Research Scholar in the Department of Computer Science and Engineering, GITAM University, Visakhapatnam, India. He has 11 years of experience in Teaching for Graduate and Post Graduate courses. His current research interests are Data Mining, Software Engineering and Cloud Computing.