ANOMALY DETECTION TECHNIQUES AND CHALLENGES ON
BIG DATA
Dr.T.Lalitha1, Dr.K.Kamaraj2 & Devan.M3
1. INTRODUCTION
1.1 Techniques Detect Anomalies in Big Data
Anomaly detection algorithms use machine learning, statistical analysis, and human insight to classify and solve problems hidden within terabytes of data. The challenge: to react and respond to critical events in real time.
Log management is often seen as the starting point for analyzing data that is generated by all IT and business systems with the intent to detect events in the data that are important to the operation of applications, IT infrastructure, and business systems. In short, it's one of the most important and broadest pillars of business intelligence (BI), helping analysts to imp rove system or application availability, prevent downtime, detect and avert fraud, and identify interesting changes in customer and application behavior. However, traditional operational analytics and log management tools fail to help users proactively discover events they don't anticipate, events that have not occurred before, and events that may have occurred before but are not understood. One challenge is that traditional log management methods rely on written rules or queries to detect events. In reality, the explosion in machine data makes it impossible for humans to write every rule. Most of these events are not known, new ones occur all the time, or they can't be described by rules or queries, which causes them to go undetected. Administrators need a mechanism that allows the data to automatically "tell" users what is happening. New techniques for anomaly detection are being launched to address anomalies at the speed with which they occur in business, before they lead to application or system availability and performance issues, breaches, or outages.
1.2 Deciphering the Known and the Unknown
These techniques are now embodied in solutions for anomaly detection[1], which derive their power by combining a predictive and an investigative component.
The main objectives of these anomaly-detection engines are three-fold:
uncover unknown events enable humans to enrich them share that knowledge with others
These engines are designed to detect events across an enterprise's application and operational infrastructure, and they are conveniently classified as either known or unknown. If a business analyst observes an event that she is familiar with, she can remediate against it and set up an alert to find such incidents in the future. The challenge is that the bulk of the events that occur are unknown and as such, unfamiliar. Therefore, the goal of anomaly detection is to discover previously unknown events, surface them for investigation, and convert them into known events -events that we know how to handle.
Over time, someone in product development, operations, or security facing these anomalies will discover more events she didn't know existed. A typical methodology is to detect the anomaly, classify and document the event based on relevance and severity, and embed human knowledge into the data stream to specify what to do if the event occurs again. In anomaly detection, as in some other leading-edge technologies, the jargon of the trade is new. When we talk about an anomalous event
1Asso.Prof/MCA, Sona College of Technology, Salem-5.Tamilnadu 2
Professor/Comp.Sci, SSM College of Arts and Science, Komarapalayam
3
II MCA, Sona College of Technology, Salem-5.
International Journal of Latest Trends in Engineering and Technology
Vol.(9)Issue(3), pp.095-099
DOI: http://dx.doi.org/10.21172/1.93.18
e-ISSN:2278-621X
Abstract- One of the signature traits of big data is that large volumes are created in short periods of time. This data often comes from connected devices, such as mobile phones, vehicle fleets or industrial machinery. The reasons for generating and observing this data are many, yet a common problem is the detection of anomalous behaviour. This may be a machine in a factory that is on the verge of malfunctioning, say due to the imminent breaking of some part, or a member of a vehicle fleet that has experienced unusual or hazardous environmental conditions.Performing predictive modeling, such as anomaly detection, in Big Data is a difficult task. This problem is compounded as more and more sources of Big Data are generated from environmental sensors, logging applications, and the Internet of Things. Further, most current techniques for anomaly detection only consider the content of the data source, i.e. the data itself, without concern for the context of the data. As data becomes more complex it is increasingly important to bias anomaly detection techniques for the context, whether it is spatial, temporal, or semantic.
today, we may refer to terminology in the common parlance, saying that it's one that builds on a crescendo of certain individual events that occur, often suddenly, at approximately the same time.
In any case, it's clear that anomalies can play a big role, for the better or worse, in optimizing system availability and performance; when a process, application, or infrastructure component fails or slows down, it's typically presaged by usually multiple types of events happening simultaneously or in quick succession. Anomaly detection deciphers how this series of events and their patterns vary from the norm and enables experts to quickly determine what it means to the business. The power behind anomaly detection is neither a single technology nor a single technique. It's typically a set of algorithms that work synergistically, leveraging machine learning techniques as well as mathematical and statistical analysis. The algorithms are developed specifically for anomaly detection -- for example, the Sumo Logic implementation of anomaly detection uses no "off the shelf" algorithms.
1.3 The Best of Human Plus Machine
An anomaly detection engine benefits greatly from a combination of an intuitive visual interface and the expertise of the analyst interacting with the data and the interface.
The visual interface enables analysts to review anomalies in real time, investigate details of contributing events, make informed decisions with all data at their fingertips, and provide feedback to the anomaly detection engine. In short, the visual interface is the key to productivity, success, and capturing feedback for continuous improvement of the anomaly detection engine.
Anomaly detection algorithms alone can only scratch the surface. It is the combination of those algorithms and human expertise in a specific domain that is much more powerful. This is especially the case if the anomaly detection engine can capture and encode experts' feedback and use it to better detect future events and equip other users with the captured knowledge. This is particularly powerful if the expertise can be collected and applied across different domains, use cases, and individual organizations in order to reuse context and knowledge the enterprise has acquired.
1.4 Upping the Ante for Big Data Management
Machine logs are the output of every application, website, server, and supporting IT infrastructure component in the enterprise. The sheer volume of machine data in the enterprise is expected to grow 15X between 2013 and 2020.
The anomaly detection engine must scale to handle hundreds of gigabytes or terabytes of data, and to handle sudden or unpredictable increases in data. The anomaly detection engine must work continuously and in real time, to handle the aggregate data output of the enterprise, heading off the risks of both benign and malicious events, either as or before they occur. The anomaly detection engine must be designed to discover anomalies without the benefit of having rules to guide it – and, ideally, without the need for training users.
It's a tall order, geared towards seizing control of data that has always been there but is only now being exploited to solve some of the thorniest problems in the complex, expanding enterprise.
2. ANOMALY DETECTION AND METRICS
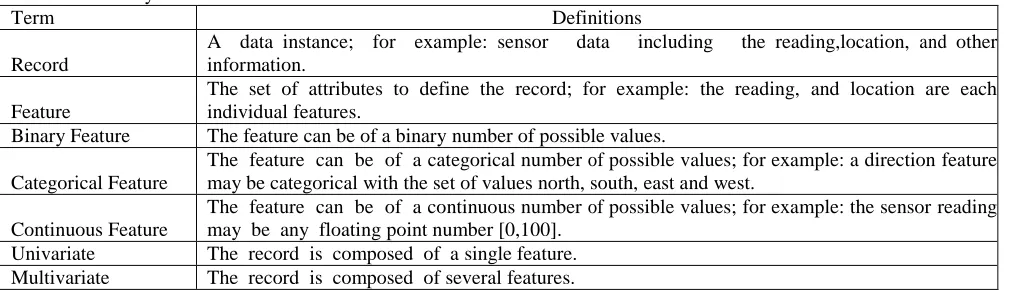
Anomaly detection can be categorized by three attributes: input data, availability of data labels (anomalous versus normal), and domain specific restraints. To begin, Table 1 introduces common terminology that is used to describe the first attribute: input data. One of the major considerations in using an anomaly detection algorithm is based on the type of features present within the set of records, i.e. categorical, continuous, and binary. Further, another consideration are the relationships existing within the data itself. Many applications assume that there exist no relationships between the records; these are generally considered point anomaly scenarios. Other applications assume that relationships may exist; these are generally referred to as contextual anomalies.
Table .1 Anomaly Detection Definitions
Term Definitions
Record
A data instance; for example: sensor data including the reading,location, and other information.
Feature
The set of attributes to define the record; for example: the reading, and location are each individual features.
Binary Feature The feature can be of a binary number of possible values.
Categorical Feature
The feature can be of a categorical number of possible values; for example: a direction feature may be categorical with the set of values north, south, east and west.
Continuous Feature
The feature can be of a continuous number of possible values; for example: the sensor reading may be any floating point number [0,100].
Dr.T.Lalitha, Dr.K.Kamaraj & Devan.M 097 2.1 Anomalies or outliers come in three types.
Point Anomalies. If an individual data instance can be considered as anomalous with respect to the rest of the data (e.g. purchase with large transaction value)
Contextual Anomalies, If a data instance is anomalous in a specific context, but not otherwise ( anomaly if occur at certain time or certain region. e.g. large spike at middle of night)
Collective Anomalies. If a collection of related data instances is anomalous with respect to the entire data set, but not individual values. They have two variations.
1. Events in unexpected order ( ordered. e.g. breaking rhythm in ECG)
2. Unexpected value combinations ( unordered. e.g. buying large number of expensive items)
3. ANOMALY DETECTION TECHNIQUES
Anomaly detection can be approached in many ways depending on the nature of data and circumstances. Following is a classification of some of those techniques.
3.1 Static Rules Approach
Most simple, and may be the best approach to start with, is using static rules. The Idea is to identify a list of known anomalies and then write rules to detect those anomalies. Rules identification is done by a domain expert, by using pattern mining techniques, or a by combination of both.
Static rules are used with the hypothesis that anomalies follow the 80/20 rule where most anomalous occurrences belong to few anomaly types. If the hypothesis is true, then we can detect most anomalies by finding few rules that describe those anomalies.
Implementing those rules can be done using one of three following methods.
1. If they are simple and no inference is needed, you can code them using your favourite programming language 2. If decisions need inference, then you can use a rule-based or expert system (e.g. Drools)
3. If decisions have temporal conditions, you can use a Complex Event Processing System (e.g. WSO2 CEP, Esper) Although simple, static rules based systems tend to be brittle and complex. Furthermore, identifying those rules is often a complex and subjective task. Therefore, statistical or machine learning based approach, which automatically learn the general rules, are preferred to static rules.
3.2 When we have Training Data
Anomalies are rare under most conditions. Hence, even when training data[2] is available, often there will be few dozen anomalies exists among millions of regular data points. The standard classification methods such as SVM or Random Forest will classify almost all data as normal because doing that will provide a very high accuracy score (e.g. accuracy is 99.9 if anomalies are one in thousands).
Generally, the class imbalance is solved using an ensemble built by resampling data many times. The idea is to first create new datasets by taking all anomalous data points[3] and adding a subset of normal data points (e.g. as 4 times as anomalous data points). Then a classifier is built for each data set using SVM or Random Forest, and those classifiers are combined using ensemble learning. This approach has worked well and produced very good results.
If the data points are auto correlated with each other, then simple classifiers would not work well. We handle those use cases using time series classification techniques or Recurrent Neural networks.
3.3 When there is no Training Data
If you do not have training data, still it is possible to do anomaly detection using unsupervised learning and semi-supervised learning. However, after building the model, you will have no idea how well it is doing as you have nothing to test it against. Hence, the results of those methods need to be tested in the field before placing them in the critical path.
Point anomalies will only have a one field in the data set. We use percentiles to detect point anomalies with numeric data and histograms to detect Detecting point anomalies in categorical data. Either case, we find rare data ranges or field values fro m the data and predict those as anomalies if it happens again. For example, if 99.9 percentile of my transaction value is 800$, one can guess any transaction greater than that value as the potential anomaly. When building models, often we use moving averages instead of point values when possible as they are much more stable to noise.
3.3.2 No Training Data: Univariate Collective Outliers
Time series data are the best examples of collective outliers in a univariate dataset. In this case, anomalies happen because values occur in unexpected order. For example. the third heart beat might be anomalous not because values are out of range, but they happen in a wrong order.
There are three several approaches to handle these use cases.
Solution 1: build a predictor and look for outliers using residues: This is based on the heuristic that the values not explained by the model are anomalies. Hence we can build a model to predict the next value, and then apply percentiles on the error ( predicted value – actual value) as described before. The model can be built using regression, time series models, or Recurrent Neural Networks.
Solution 2: Markov chains and Hidden Markov chains can measure the probability of a sequence of events happening. This approach builds a Markov chain for the underline process, and when a sequence of events has happened, we can use the Markov Chain to measure the probability of that sequence occurring, and use that to detect any rare sequences.
For example, let’s consider credit card transactions. To model the transactions using Markov chains, let’s represent each transaction using two values: transaction value (L, H) and time since the last transaction (L, H). Since Markov chain’s states have to be finite, we will choose two values Low (L), High (H) to represent variable values. Then Markov chains would represent by states LL, LH, HL, HH and each transaction would be a transition from one state to another state. We can build the Markov chain using historical data and use the chain to calculate sequence probabilities. Then, we can find the probability of any new sequence happening and then mark rare sequences as anomalies.
3.3.3 No Training Data: Multivariate Collective Outliers ( Unordered)
Here data have multiple reading but does not have an order. For example, vitals collected from many people are such a multi-variate but not ordered dataset. For example, higher temperatures and slow heartbeats might be an anomaly even though both temperature and heartbeats by itself are in a normal range.
Dr.T.Lalitha, Dr.K.Kamaraj & Devan.M 099
Then to detect anomalies we will cluster the data, and calculate the centroids and density of each cluster found. When we receive a new data point, we calculate the distance from the new data point to known large clusters and if it is too far, then decide it as an anomaly.
Furthermore, we can improve upon the above approach by first manually inspecting ranges of each cluster and labelling each cluster as anomalous or normal and use that while doing anomaly check for a data point.
Approach 2: Nearest neighbour techniques – the underline assumption is new anomalies are closer to known anomalies. This can be implemented by using distance to k-anomalies or using the relative density of other anomalies near the new data point. While calculating the above, with numerical data, we will break the space into hypercubes, and with categorical data, we will break the space into bins using histograms.
3.3.4 No Training Data: Multivariate Collective Outliers (Ordered)
This class is most general and consider ordering as well as value combinations. For example, consider a series of vital readings taken from the same patient. Some reading may be normal in combination but anomalous as combinations happen in wrong order. For example, given a reading that has the blood pressure, temperature, and heart beat frequency, each reading by itself may be normal, but not normal if it oscillates too fast in a short period of time.
Combine Markov Chains and Clustering – This method combines clustering and Markov Chains by first clustering the data, and then using clusters as the states in a Markov Chain and building a Markov Chain. Clustering will capture common value combinations and Markov chains will capturing their order.
4. CONCLUSION
This paper has discussed the abnormal behavior detection techniques on Big Data. Anomaly detection in the medical and public health domains typically work with patient records. The data can have anomalies due to several reasons such as abnormal patient condition or instrumentation errors or recording errors. Thus the anomaly detection is a very critical problem in this domain and requires high degree of accuracy. The availability of Big Data, low-cost commodity hardware, and new information management and analytic software have produced a unique moment in the history of data analysis. The convergence of these trends means that we have the capabilities required to analyze astonishing data sets quickly and cost-effectively for the first time in history. These capabilities are neither theoretical nor trivial. They represent a genuine leap forward and a clear opportunity to realize enormous gains in terms of efficiency, productivity, revenue, and profitability.
5. REFERENCES
[1] Agrawal D., Bernstein P., Bertino E., Davidson S., Dayal U., Franklin M.,Widom J. (2012).Challenges and Opportunities with Big Data:,
http://cra.org/ccc/resources/ccc-led-whitepapers.
[2] Visual Analytics of Anomaly Detection in Large Data Streams Ming C. Hao, Umeshwar Dayal, Daniel A. Keim* Hewlett-Packard Palo Alto
Laboratories, Palo Alto, CA University of Konstanz, Germany.