Reduction in Resources and Cost
for Gastroenteritis Through
Implementation of Dehydration
Pathway
Jessica K. Creedon, MD, Matthew Eisenberg, MD, MPH, Michael C. Monuteaux, ScD, Mihail Samnaliev, PhD, Jason Levy, MD
abstract
OBJECTIVES:Management decisions for patients with gastroenteritis affectresource use within pediatric emergency departments (EDs), and algorithmic care using evidence-based guidelines (EBGs) has become widespread. We aimed to determine if the implementation of a dehydration EBG in a pediatric ED resulted in a reduction in intravenous (IV)fluid administration and the cost of care.
METHODS:In a single-center quality improvement initiative between 2010 and
2016, investigators aimed to decrease the percentage of patients with gastroenteritis who were rehydrated with IVfluids. The EBG assigned the patient a dehydration score with subsequent rehydration strategy on the basis of presenting signs and symptoms. The primary outcome was
proportion of patients receiving IVfluid, which was analyzed using statistical process control methods. The secondary outcome was cost of the episode of care. Balancing measures included ED length of stay, admission rate, and return visit rate within 72 hours.
RESULTS:A total of 7145 patients met inclusion criteria with a median age of 17
months. Use of IVfluid decreased from a mean of 15% to 9%
postimplementation. Average episode of care–related health care costs decreased from $599 to $410. For our balancing measures, there were improvements in ED length of stay, rate of admission, and rate of return visits.
CONCLUSIONS:Implementation of an EBG for patients with gastroenteritis led to a decrease in frequency of IV administration, shorter lengths of stay, and lower health care costs.
Gastroenteritis-related dehydration accounts for frequent visits to medical providers, including emergency departments (EDs). Consequently, management involving rehydration strategies and disposition will affect resource use, costs, and throughput.
The American Academy of Pediatrics has published practice guidelines for the treatment of dehydration secondary to gastroenteritis that advocates for the
use of oral rehydration therapy (ORT) over intravenous (IV) rehydration because it provides the appropriate use of resources without the need for procedures. In a Cochrane review involving 17 trials and 1811 children with acute gastroenteritis, it was demonstrated that ORT had equivalent success rates when compared with IV rehydration.1However, variation in practice patterns with regard to rehydration strategies still exists,2and
Boston Children’s Hospital, Boston, Massachusetts
Dr Creedon conceptualized and designed the analysis and drafted the initial manuscript; Drs Levy and Eisenberg helped conceptualize and design the analysis; Dr Samnaliev performed the economic analysis; Dr Monuteaux helped design the analysis and performed the statistical analysis; and all authors reviewed and revised the manuscript, approved thefinal manuscript as submitted, and agree to be accountable for all aspects of the work.
DOI:https://doi.org/10.1542/peds.2019-1553 Accepted for publication Mar 11, 2020
Address correspondence to Jessica K. Creedon, MD, Division of Emergency Medicine, Boston Children’s Hospital, 300 Longwood Ave, Boston, MA 02115. E-mail: [email protected]
PEDIATRICS (ISSN Numbers: Print, 0031-4005; Online, 1098-4275).
Copyright © 2020 by the American Academy of Pediatrics
FINANCIAL DISCLOSURE:The authors have indicated they have nofinancial relationships relevant to this article to disclose.
FUNDING:Supported by the Michael Shannon Research Grant, Boston Children’s Hospital, Division of Emergency Medicine.
POTENTIAL CONFLICT OF INTEREST:The authors have indicated they have no potential conflicts of interest to disclose.
ORT is widely underused.3–5At our institution, our quality improvement (QI) group identified that 15% of noncomplex patients presenting with signs and symptoms of gastroenteritis were receiving IV rehydration, with wide variability among practitioners (Supplemental Fig 10). In a previous report, Rutman et al6showed a decrease from 48% IV rehydration to 44% over a 12-year period after implementation of a gastroenteritis “pathway.”Freedman et al7conducted a prospective cohort study of children 3 to 48 months of age who presented to 11 EDs with acute gastroenteritis and found that 23% of patients received IV rehydration, with substantial variability across
institutions (6%–66%). Although our intravenousfluid (IVF)
administration rate is relatively lower, we aimed to improve our own practice and align our management with national standards to decrease resource use for children with mild to moderate dehydration related to gastroenteritis.
Our SMART (specific, measurable, achievable, relevant, and time-bound)
aim was to decrease the use of IVF administration to,10% in previously healthy patients presenting to the ED with mild to moderate gastroenteritis-related dehydration within 12 months.
METHODS
Context
Our setting is the ED of a quaternary care, freestanding children’s
hospital with∼60 000 visits per year. The ED is staffed by board-certified pediatric emergency medicine physicians, general pediatricians, pediatric emergency medicine fellows, pediatric and emergency medicine residents, and physician assistants.
Quality Intervention
Planning the Intervention
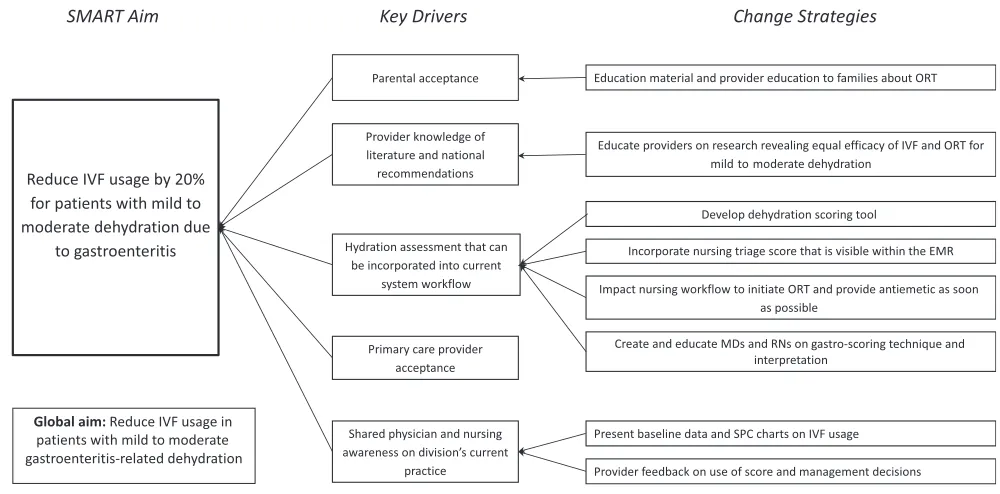
The initial planning involved assembling a multidisciplinary team of physicians, nurses, and QI experts within the Division of Emergency Medicine. The team convened for several brainstorming sessions in 2010 to identify key drivers of IVF
usage for gastroenteritis (Fig 1). Each key driver then mapped to a specific change strategy, with the exception of primary care provider acceptance because it was not within our locus of control. The primary intervention was the development and
implementation of an evidence-based guideline (EBG) for
management of gastroenteritis and dehydration. Implementation began in December 2011 and was led by the ED Guideline Implementation Team, made up of pediatric emergency physicians, nurses, a QI consultant, a data analyst, and a QI administrator.
Patient Population
To best target children who would benefit from ORT, the triage algorithm included patients aged 6 months to 6 years of age who presented to the ED with vomiting and/or diarrhea and presumed gastroenteritis (Fig 2). This age group was selected given existing data validating the reliability of clinical
findings in determining the degree of dehydration.8
FIGURE 1
EBG and Dehydration Score
Our EBG used a dehydration score to create a uniform transparent
assessment tool that quantified a patient’s degree of dehydration, dictated the type of rehydration, and determined a time-based treatment algorithm for all providers. We based the EBG on the initial dehydration score because it could be calculated easily at triage and displayed with the patient’s triage vital signs, thereby allowing for a common language of assessment for both nurses and physicians. The score, derived from
Gorelick et al8using the highest-quality evidence available, was ideally suited for use at triage because it did not require the incorporation of laboratory values but rather was based on the following elements: urine output, activity level, heart rate, respirations, capillary refill, dry mucous membranes, tear production, whether eyes appeared sunken, skin turgor, and abnormal pulses or perfusion. The algorithm’s initial treatment recommendation is based on the patient’s dehydration score (out of 10 total points): oral
rehydration for patients with a score
,3; oral rehydration with reassessment after 30 minutes to determine if patient is drinking adequately for a score of 3–6; and IVF for a score.6. The EBG also provided time-based targets for reassessments and relative admission criteria based on initial dehydration scores (see Fig 2).
Patients were excluded from the application of the EBG by the initial bedside provider if they were deemed ill-appearing or hypotensive to avoid delays in care for potentially critically ill children, if the provider felt they had significant comorbid conditions, or if they had signs or symptoms of a bowel obstruction.
Integration With Electronic Medical Record
The tool was embedded in the electronic medical record (EMR). Nurses were trained to use the scoring system at ED triage and were educated on which patients met inclusion criteria. Once the tool was completed, the score would populate in the EMR adjacent to the vital signs. A standardized rehydration electronic order set was introduced in January 2010 that mirrored the EBG recommendations. Specifically, it organized the options for treatment (anti-emetics, IVF, etc) in a way that recommended medications and interventions on the basis of the patient’s dehydration score, thus reinforcing EBG
recommendations.
Implementation Strategies
Dehydration scoring and nursing education was implemented in January 2010, before formal EBG implementation in December 2011. Although not provided with a set of distinct conditions, nursing was asked to use their clinical judgment to exclude patients who had significant comorbidities.
Our initial plan-do-study-act cycles were focused on increasing awareness of frontline staff around
FIGURE 2
recommendations for use of ORT in conjunction with an introduction of a dehydration score to guide clinical decision-making. (See Fig 3 for timing of our interventions.) For our implementation strategies, a series of presentations were arranged. Nursing education included face-to-face sessions on how to assign the score in real time as well as how to teach caregivers to orally rehydrate patients. Presentation settings included weekly teaching conferences with emergency medicine fellows and faculty in addition to monthly physician faculty and nursing meetings. At the commencement of the intervention, reminders about the clinical decision pathways laid out in the EBG were distributed throughout the department. The department’s collective adherence to EBG guidelines was shared with all providers. Each provider received individualized feedback from the Division Chief of Emergency Medicine during yearly reviews on their frequency of use of IVFs for patients with mild and moderate dehydration. Physicians and nurses were updated and reminded of EBG efforts by using electronic and face-to-face communication as well as signage in
charting areas and office spaces of the department.
Study of the Intervention
Data Collection
A data warehouse was queried for all patients aged 6 months to 6 years of age presenting to the ED between January 1, 2010, and January 31, 2016, with one of theInternational Classification of Diseases, Ninth Revision(ICD-9) andInternational Classification of Diseases, 10th Revision(ICD-10) codes consistent with the diagnosis of gastroenteritis (see Supplemental Information for full list of codes). Patients were excluded from this analysis retrospectively if they had a coexisting medical condition (identified from the patient’s electronic problem list or diagnosis codes) that might lead a provider to choose a different treatment strategy or would frequently present with vomiting for reasons other than gastroenteritis (see Supplemental Table 2 for list of exclusion codes). Patients were also excluded if they were admitted to a subspecialty medical unit, surgical unit, or ICU or had ED lengths of stay.10 hours
because this latter group is often composed of admitted patients who remained in the ED because of lack of inpatient bed availability. The data from a patient’s second return visit to the ED for gastroenteritis-related symptoms were excluded as well if the second visit was within 72 hours. Patients were excluded on the basis of coding information or disposition information directly from the EMR and manual review and exclusion did not occur.
Eligible encounters were extracted from the EMR using Patient360, an enterprise data warehouse that stores patient care information extricated from the hospital’s EMR. MicroStrategy was used to generate reports that provided demographic and clinical factors, including IVF use, laboratory studies, antiemetic usage, ED disposition, and presence of a return visit within 72 hours. For cost data, we used the hospital’s decision-support system, which relies on activity-based costing to generate costs for each billable unit. These are multiplied by the respective quantities and summed to estimate costs of each stay and encounter. The available cost data werefirst available in October 2010 until present time.
FIGURE 3
Measures
The main outcome measures were (1) the percentage of patients receiving IVF during the ED visit and (2) health care cost per episode. We estimated the costs associated with the entire episode of care (EOC), including the initial ED encounter, any ED revisits within 72 hours, and any admission associated with those ED encounters. The EOC also included costs associated with inpatient care for patients who were admitted and overhead costs, which in our institution are spread over individual billable units. All costs were inflation adjusted to 2016
dollars by using the consumer price indices for hospital care from the Bureau of Labor Statistics.
Percentage of patients who received a dehydration score served as our process measure. Balancing measures were ED length of stay, admission rate, and return visit rate within 72 hours.
Analysis
A before and after cohort design was used, and differences in outcome (IVF usage and average monthly EOC costs), process (use of dehydration score), and balancing measures (ED length of stay, rate of admission, and
rate of return within 72 hours) between the 2 time periods were assessed by statistical process control (SPC) methodology. January 2010 was selected as the start date because demographic and clinical data through Patient360 was not available before that date. Standard rules for construction of SPC charts and shift of the center line were followed.9 Patient-specific variables, including age, sex, insurance type, race, laboratory measures, Emergency Severity Index score, and antiemetic use were compared between the pre-EBG and post-pre-EBG group by using x2tests for categorical variables and
Mann-Whitney tests for continuous variables. A subset cohort analysis of outcome and balancing measures was performed on patients who received a mild or moderate dehydration score (0–6) at triage by using SPC methodology because traditional strategies around ORT should be largely successful in this subgroup.
SPC charts were constructed by using SQCpack version 7.0 (PQ Systems, Dayton, OH). We used SAS (version 0.4; SAS Institute, Inc, Cary, NC) for the economic analysis. We used SPSS (version 24.0, IBM SPSS Statistics, IBM Corporation, Armonk, NY) for all other analyses.
Ethical Considerations
The institutional review board at Boston Children’s Hospital reviewed and approved our study protocol.
RESULTS
We identified 14 662 records of patients aged 6 months to 6 years presenting with signs and symptoms of gastroenteritis, from which 7145 patients met inclusion criteria after excluding patients because of comorbidities, need for subspecialty, or critical care (2373 [33%] before EBG implementation and 4772 [67%] after implementation). (See
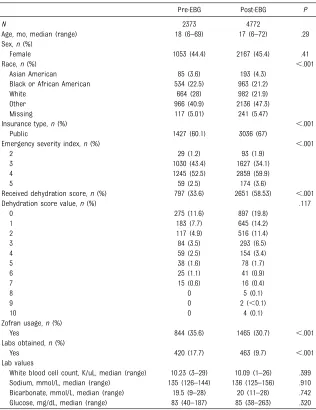
Supplemental Fig 11 for data extractionflowsheet). Demographic and clinical data are displayed in Table 1Demographic Comparison of the Pre- and Post-EBG Groups
Pre-EBG Post-EBG P
N 2373 4772
Age, mo, median (range) 18 (6–69) 17 (6–72) .29 Sex,n(%)
Female 1053 (44.4) 2167 (45.4) .41
Race,n(%) ,.001
Asian American 85 (3.6) 193 (4.3)
Black or African American 534 (22.5) 963 (21.2)
White 664 (28) 982 (21.9)
Other 966 (40.9) 2136 (47.3)
Missing 117 (5.01) 241 (5.47)
Insurance type,n(%) ,.001
Public 1427 (60.1) 3036 (67)
Emergency severity index,n(%) ,.001
2 29 (1.2) 93 (1.9)
3 1030 (43.4) 1627 (34.1)
4 1245 (52.5) 2859 (59.9)
5 59 (2.5) 174 (3.6)
Received dehydration score,n(%) 797 (33.6) 2651 (58.53) ,.001
Dehydration score value,n(%) .117
0 275 (11.6) 897 (19.8)
1 183 (7.7) 645 (14.2)
2 117 (4.9) 516 (11.4)
3 84 (3.5) 293 (6.5)
4 59 (2.5) 154 (3.4)
5 38 (1.6) 78 (1.7)
6 25 (1.1) 41 (0.9)
7 15 (0.6) 16 (0.4)
8 0 5 (0.1)
9 0 2 (,0.1)
10 0 4 (0.1)
Zofran usage,n(%)
Yes 844 (35.6) 1465 (30.7) ,.001
Labs obtained,n(%)
Yes 420 (17.7) 463 (9.7) ,.001
Lab values
Table 1. There were differences in demographic or clinical information between groups with respect to race, insurance, and Emergency Severity Index score.
Outcome Measures
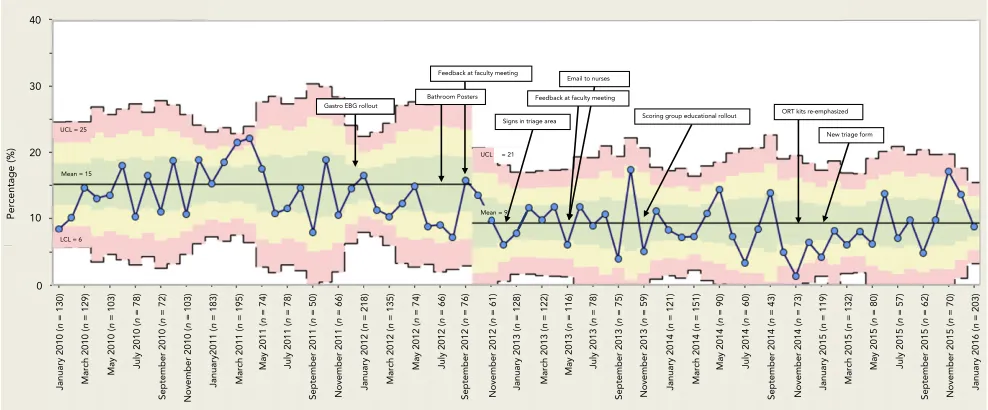
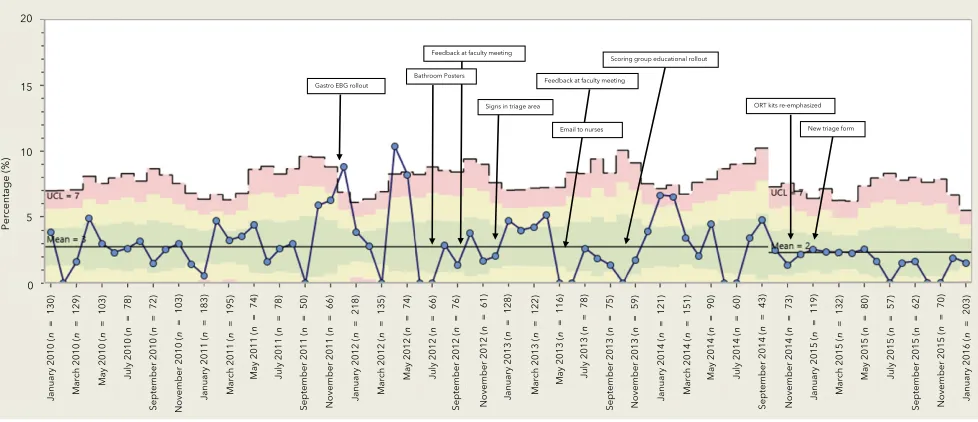
IVF usage in patients with
gastroenteritis-related dehydration decreased by 60%, from a mean of
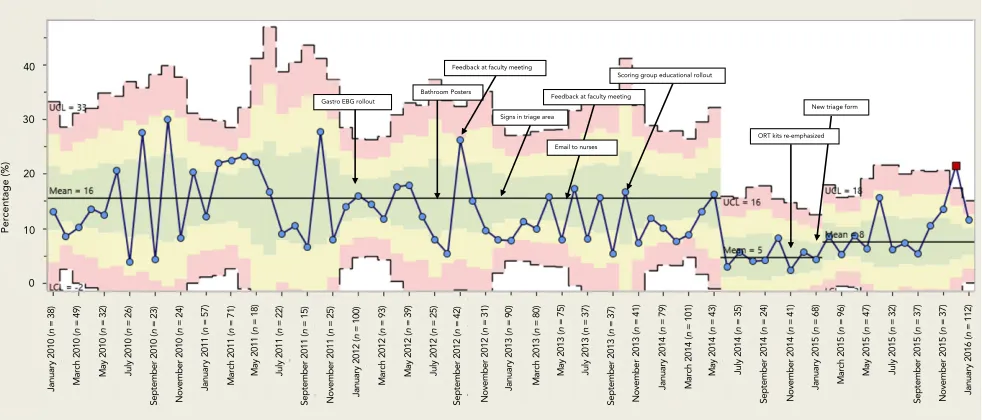
15% to 9%; see Fig 3. For the subset of patients with mild to moderate dehydration (score,7, Fig 4), there was also a decrease of 50% in IVF usage after EBG implementation, from a mean of 16% to 8%. Total health care costs associated with an EOC were $599 before implementation of the EBG
and reduced by $189 after implementation; see Fig 5.
Process Measures
Thirty-four percent and 53% of the patients during the pre- and post-EBG periods, respectively, received a dehydration score (see Fig 6).
FIGURE 4
SPC chart showing the IVF usage for children with a mild to moderate dehydration score (,7) presenting with gastroenteritis pre- and post-implementation of a gastroenteritis EBG over the study period. LCL, lower control limit; UCL, upper control limit.
FIGURE 5
Balancing Measures
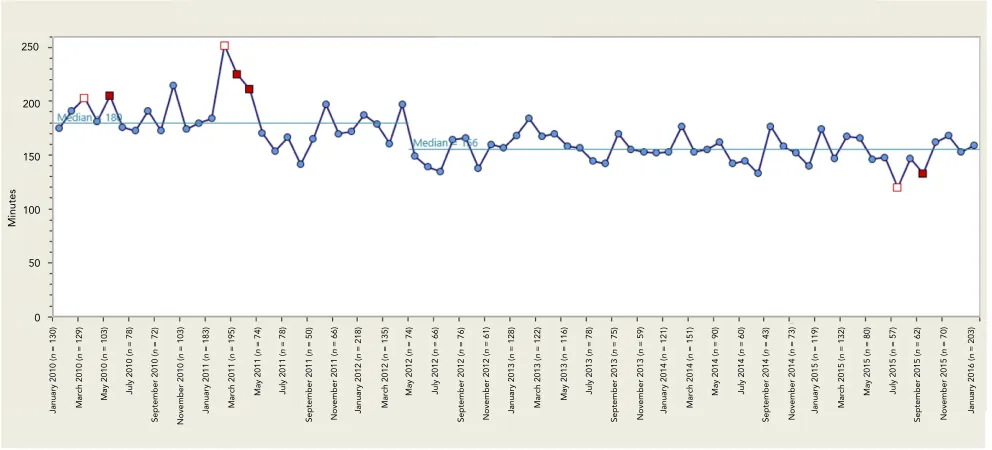
ED length of stay decreased among the entire cohort from a median of 180 to 156 minutes; see Fig 7. For patients with mild to moderate dehydration scores, length of stay similarly decreased from 183 to 156 minutes (see Supplemental Fig 12). We saw no increase in our balancing measure of admission rate and the rate of return visit within 72 hours; see Figs 8 and 9.
DISCUSSION
We designed and implemented a QI initiative centered around the introduction of an EBG for the management of children presenting with signs and symptoms of acute gastroenteritis in a pediatric ED. These efforts were associated with a sustained decrease in IVF usage without a concurrent increase in admission or return visit rate. There was also a sustained decrease in ED length of stay after implementation of the EBG. Finally, we uniquely demonstrated a significant reduction in cost related to implementation of our EBG. If thesefindings can be extrapolated to the 1.7 million ED visits per year for
gastroenteritis,10–13similar QI initiatives may result in significant reduction in the cost of care in this population nationally.
The decrease in IVF usage represents an improved alignment with accepted EBGs for rehydration management in this patient population.5,8ORT has demonstrated outstanding success rates, faster time to initiation of therapy, and potential improved parental satisfaction.14Additionally, peripheral IV placement is often painful and has potential complications.15Moreover, the reduction in health care costs by 32% may have been driven not only by the lower IV rates but also by the fact that IV placement may have resulted in increased skilled nursing time, supply use, potential IV medications,
laboratory evaluations, and increased room occupancy.16Indeed, in our population we found a decrease in anti-emetic usage and laboratory studies in the post-EBG population.
Despite concerns of clinicians in previous studies about the greater time associated with ORT,4we demonstrated a significant decrease in length of stay after EBG
implementation. Patients in the post-EBG period spent an average of 24 fewer minutes in the ED. A decrease in IVF usage likely mediated a portion of this decrease because of the increased time needed to obtain IV access, start and infusefluids, and subsequently determine if a patient is able to tolerate enteralfluids before discharge. Thesefindings align with those of Spandorder et al14who previously demonstrated that initiation of ORT occurs more quickly than IV rehydration. In addition, our guideline recommended time-sensitive evaluations and decision-making after ORT was initiated. A busy ED environment may result in less-frequent provider reassessment and evaluations of ORT success. Consequently, part of the EBG strategy was focused on prompting these timely reminders. Patients and caregivers are more satisfied with shorter visits,15and ED crowding can lead to poor patient outcomes.17–21As a result, any initiative that leads to shorter lengths of stay may improve room turnover and mitigate the effects of high ED census.
The treatment of gastroenteritis-related dehydration relies on clinicians’abilities to estimate the degree of dehydration. Unlike severe dehydration and shock, milder forms of dehydration can be difficult to discern, and several clinical dehydration scales have been developed to help guide clinical assessment. Although their validity and reliability have been studied with variable outcomes,22–25we used the highest-quality evidence available to
develop a score that could be applied during triage assessment8(see Fig 2). Our triage scoring tool used information that could be gathered easily at triage, scored within the EMR, and incorporated and displayed with the patient’s triage vital signs. With this visibility, it could be interpreted by all providers, thereby allowing for both EBG implementation at the time of initial patient contact and a common language of assessment for both nurses and physicians. Given the volume of dehydrated pediatric patients presenting to nonpediatric EDs, we believe providing a decision-support tool to assess hydration status that can be incorporated into regular workflow facilitates
streamlined shared medical decision-making and renders ourfindings generalizable.
In our analysis, we decided to include all patients with gastroenteritis regardless of whether they received a dehydration score at triage to capture any potential cultural change in rehydration strategies. We felt that the absence of a documented score from nursing triage may not be indicative of nonuse of the EBG by physician trainees and faculty. The score may only be inputted by nursing staff at triage and could not be entered by other care providers. However, the EBG remained an accessible reference to all providers, and the ordering sentences based on scoring still remained within the EMR. Physician EBG review and ordering did not rely on the
assignment of a dehydration score by nursing at triage. Regardless, we did appreciate an increase in the percentage of patients who received a dehydration score. The rollout of our guideline was multifaceted and included extensive and frequent provider educational interventions. There was also a sustained change implemented into the EMR ordering system with reminders on
providers went to order diagnostics, medications, or IVFs for patients presenting with gastroenteritis and dehydration. Additionally, EBGs were posted in charting areas and accessible on the divisional Web site and were frequently used as teaching tools for medical students and residents.
Our study has several limitations. First, given that it is a single-center
study at a tertiary care pediatric hospital, outcomes may not be generalizable to other EDs or outpatient settings. However, we included otherwise healthy children without comorbidities and chose to focus on an extremely prevalent disease process that is seen across multiple different care settings. Furthermore, management decisions were driven by a dehydration score
based on commonly assessed signs and symptoms that could be applied universally. Second, although we were able to track who received
a dehydration score, we did not have a means to determine if providers reviewed and incorporated the score into clinical decision-making. Third, our center has a robust ED quality program, and the acceptance and uptake of the intervention may be
FIGURE 6
SPC chart showing the percentage of children presenting with gastroenteritis who received a dehydration score pre- and postimplementation of a gastroenteritis EBG over the study period. LCL, lower control limit; PEMA, pediatric emergency medicine attending physicians; UCL, upper control limit.
FIGURE 7
more challenging in other settings. Fourth, we were not able to include visits to other care settings and therefore may have underestimated the rate of return visits. We have no reason to believe, however, that visit rates to other EDs would have been different before and after the implementation of the EBG. Additionally, we were unable to determine the level of dehydration
for patients who were not assigned a dehydration score. Although Emergency Severity Index scores were statistically higher in the post-EBG group, there was no difference between groups with respect to plasma bicarbonate, serum sodium, or glucose values, suggesting at least some clinical equivalence by objective measures. Finally, our cost analysis did not incorporate any costs
associated with EBG implementation. These include the time costs
associated with education to providers of the already developed EBG. We expect these to be relatively small and incurred only one time by institutions planning to implement an EBG. Furthermore, our savings estimate is likely conservative because it does not include the costs incurred for physician services, which
FIGURE 8
SPC chart showing the percentage of children presenting with gastroenteritis who were admitted pre- and postimplementation of a gastroenteritis EBG over the study period. UCL, upper control limit.
FIGURE 9
are not part of the hospital accounting system.
CONCLUSIONS
Our QI initiative, which developed and implemented an evidence-based algorithm centered on use of a clinical dehydration score for patients with gastroenteritis, led to a decrease in frequency of IVF administration and shorter ED lengths of stay. The gastroenteritis EBG appears to be a cost-effective strategy resulting in a 32% reduction in total cost of care.
ABBREVIATIONS
EBG: evidence-based guideline ED: emergency department EMR: electronic medical record EOC: episode of care
ICD-9:International Classification of Diseases, Ninth Revision ICD-10:International Classification
of Diseases, 10th Revision IV: intravenous
IVF: intravenousfluid
ORT: oral rehydration therapy QI: quality improvement SPC: statistical process control
REFERENCES
1. Bellemare S, Hartling L, Wiebe N, et al. Oral rehydration versus intravenous therapy for treating dehydration due to gastroenteritis in children: a meta-analysis of randomised controlled trials.BMC Med. 2004;2:11
2. Freedman SB, Sivabalasundaram V, Bohn V, Powell EC, Johnson DW, Boutis K. The treatment of pediatric
gastroenteritis: a comparative analysis of pediatric emergency physicians’ practice patterns.Acad Emerg Med. 2011;18(1):38–45
3. Reis EC, Goepp JG, Katz S, Santosham M. Barriers to use of oral rehydration therapy.Pediatrics. 1994;93(5):708–711
4. Conners GP, Barker WH, Mushlin AI, Goepp JG. Oral versus intravenous: rehydration preferences of pediatric emergency medicine fellowship
directors.Pediatr Emerg Care. 2000; 16(5):335–338
5. Ozuah PO, Avner JR, Stein REK. Oral rehydration, emergency physicians, and practice parameters: a national survey.Pediatrics. 2002;109(2):259–261
6. Rutman L, Klein EJ, Brown JC. Clinical pathway produces sustained improvement in acute gastroenteritis care.Pediatrics. 2017;140(4):e20164310
7. Freedman SB, Gouin S, Bhatt M, et al; Pediatric Emergency Research Canada. Prospective assessment of practice pattern variations in the treatment of pediatric gastroenteritis.Pediatrics. 2011;127(2). Available at: www. pediatrics.org/cgi/content/full/127/2/e287
8. Gorelick MH, Shaw KN, Murphy KO. Validity and reliability of clinical signs in the diagnosis of dehydration in children.Pediatrics. 1997;99(5). Available at: www.pediatrics.org/cgi/ content/full/99/5/E6
9. Benneyan JC, Lloyd RC, Plsek PE. Statistical process control as a tool for research and healthcare improvement. Qual Saf Health Care. 2003;12(6):458–464
10. King CK, Glass R, Bresee JS, Duggan C; Centers for Disease Control and Prevention. Managing acute gastroenteritis among children: oral rehydration, maintenance, and nutritional therapy. MMWR Recomm Rep. 2003;52(RR):1–16
11. McConnochie KM, Conners GP, Lu E, Wilson C. How commonly are children hospitalized for dehydration eligible for care in alternative settings?Arch Pediatr Adolesc Med. 1999;153(12):1233–1241
12. Glass RI, Lew JF, Gangarosa RE, LeBaron CW, Ho MS. Estimates of morbidity and mortality rates for diarrheal diseases in American children.J Pediatr. 1991; 118(4, pt 2):S27–S33
13. Freedman SB, Adler M, Seshadri R, Powell EC. Oral ondansetron for gastroenteritis in a pediatric emergency department.N Engl J Med. 2006;354(16):1698–1705
14. Spandorfer PR, Alessandrini EA, Joffe MD, Localio R, Shaw KN. Oral versus intravenous rehydration of moderately dehydrated children: a randomized, controlled trial. Pediatrics. 2005;115(2):295–301
15. Cummings EA, Reid GJ, Finley GA, McGrath PJ, Ritchie JA. Prevalence and
source of pain in pediatric inpatients. Pain. 1996;68(1):25–31
16. Nager AL, Wang VJ. Comparison of nasogastric and intravenous methods of rehydration in pediatric patients with acute dehydration.Pediatrics. 2002; 109(4):566–572
17. Kennebeck SS, Timm NL, Kurowski EM, Byczkowski TL, Reeves SD. The association of emergency department crowding and time to antibiotics in febrile neonates.Acad Emerg Med. 2011;18(12):1380–1385
18. Pines JM, Hollander JE. Emergency department crowding is associated with poor care for patients with severe pain.Ann Emerg Med. 2008; 51(1):1–5
19. Pines JM, Localio AR, Hollander JE, et al. The impact of emergency department crowding measures on time to antibiotics for patients with community-acquired pneumonia.Ann Emerg Med. 2007;50(5):510–516
20. Kulstad EB, Kelley KM. Overcrowding is associated with delays in percutaneous coronary intervention for acute myocardial infarction.Int J Emerg Med. 2009;2(3):149–154
21. Chatterjee P, Cucchiara BL, Lazarciuc N, Shofer FS, Pines JM. Emergency department crowding and time to care in patients with acute stroke.Stroke. 2011;42(4):1074–1080
22. Goldman RD, Friedman JN, Parkin PC. Validation of the clinical dehydration scale for children with acute
gastroenteritis.Pediatrics. 2008;122(3): 545–549
23. Jauregui J, Nelson D, Choo E, et al. External validation and comparison of three pediatric clinical dehydration scales.PLoS One. 2014;9(5):e95739
24. Tam RK, Wong H, Plint A, Lepage N, Filler G. Comparison of clinical and
biochemical markers of dehydration with the clinical dehydration scale in children: a case comparison trial.BMC Pediatr. 2014;14:149
25. Freedman SB, Vandermeer B, Milne A, Hartling L. Diagnosing clinically significant dehydration in children with acute gastroenteritis
DOI: 10.1542/peds.2019-1553 originally published online June 2, 2020;
2020;146;
Pediatrics
and Jason Levy
Jessica K. Creedon, Matthew Eisenberg, Michael C. Monuteaux, Mihail Samnaliev
Dehydration Pathway
Reduction in Resources and Cost for Gastroenteritis Through Implementation of
Services
Updated Information &
http://pediatrics.aappublications.org/content/146/1/e20191553 including high resolution figures, can be found at:
References
http://pediatrics.aappublications.org/content/146/1/e20191553#BIBL This article cites 23 articles, 8 of which you can access for free at:
Subspecialty Collections
sub
http://www.aappublications.org/cgi/collection/quality_improvement_ Quality Improvement
e_management_sub
http://www.aappublications.org/cgi/collection/administration:practic Administration/Practice Management
sub
http://www.aappublications.org/cgi/collection/emergency_medicine_ Emergency Medicine
following collection(s):
This article, along with others on similar topics, appears in the
Permissions & Licensing
http://www.aappublications.org/site/misc/Permissions.xhtml in its entirety can be found online at:
Information about reproducing this article in parts (figures, tables) or
Reprints
DOI: 10.1542/peds.2019-1553 originally published online June 2, 2020;
2020;146;
Pediatrics
and Jason Levy
Jessica K. Creedon, Matthew Eisenberg, Michael C. Monuteaux, Mihail Samnaliev
Dehydration Pathway
Reduction in Resources and Cost for Gastroenteritis Through Implementation of
http://pediatrics.aappublications.org/content/146/1/e20191553
located on the World Wide Web at:
The online version of this article, along with updated information and services, is
http://pediatrics.aappublications.org/content/suppl/2020/06/01/peds.2019-1553.DCSupplemental Data Supplement at:
by the American Academy of Pediatrics. All rights reserved. Print ISSN: 1073-0397.