©2015 WEJ Journal
Identification of Promising Porphyry Copper
Mineralization Areas in 1:100,000 Ahar Sheet Using Data
Driven Spatial Analysis Method
(emphasis on weights of evidence model)
Mohammadi Mahrou Sadat
1, Gasemi Reza
21. Geology Group, Science College, Tehran, Iran
2. Shahrood University of Technology, School of Mining, Petroleum & Geophysics Engineering
ABSTRACT: The study area is located in East Azerbaijan province in the North West of Iran. The purpose of this study is to create a mineral potential map of area by using GIS techniques in information synthetic. One of these methods is weights of evidence method that finds unknown mineral indices according the characteristics of known mineral indices. In this study area, known mineral indices, geophysics aerial, satellite imagery, geological map, hydrothermal alteration and geochemical stream sediment have used in the calculation and after the calculation of the weights of evidence and obtain binary maps, the combination and integration of data is done and finally predictive mineral potential map and likelihood of mineralization in any locations have been made. Finally, selected area has visited by field working, and a lot of mineralization have found. After Sampling, by chemical analysis and section study, investigation results accepted.
Keywords: component; GIS, Mineral potential model, weights of evidence, predictive map, porphyry copper, information synthetic
INTRODUCTION
The study area is the 1:100,000 scale geological sheet map of Ahar. This area is located in East Azerbaijan province in the North West of Iran. This map is located between 47° 00' to 47° 30' longitude and 38° 00' to 38° 30' latitude on the Urmia-Dokhtar volcanic belt [1]. The aim of this study was to develop a preliminary model to predict the location of porphyry copper deposits based on previous works using data driven spatial analysis method.
In this study, using a Geographic Information System (GIS) by taking multiple spatial data types, such as geology, geochemistry, geophysics and remote sensing answers the two basic questions 1. What are the characteristics of a particular situation? And 2. In cases where the combination of these features and there are areas of potential mineralization has been identified [2].
In applying GIS to the mapping of mineral potential, deposit models play a role both in the selection and derivation of maps that are likely to be good predictors of the deposit-type under consideration, and for the assignment of weights to the various predictor maps. The assignment of weights can either be carried out using statistical criteria, using an actual study region to estimate the spatial relationships between predictor maps and the response map (estimated with known mineral deposits, or sometimes with anomalous geochemical zones), or the weights can be estimated on the basis of expert opinion. These two types are sometimes called "driven" and "knowledge-driven" models. In data-driven modeling, the various input maps are combined using models such as logistic regression, weights of evidence or neural network analysis [4].
GEOLOGICAL BACKGROUND
In quadrangle geological map of Ahar the outcrop of different kinds of volcanic, plutonic and sedimentary rocks is seen. The volcanic and plutonic rocks have mainly outcrops in the northeast and central to the east of study area. The lithological units in this area have the ages of the late Cretaceous to recent [1].
23 A. Volcanic rocks:
Ep : This unit includes Tuff breccia and ignimbrite shear with a few subordinate pyroxene to trachyandesite. The composition of the tuff is more acidic and it is between Rhyodacite to dacite. Spread the unit in this map is fairly high [1].
Eb : This unit includes basic lava as olivine basalt, basaltic andesite and pyroxene bearing andesite that accompanying pyroclastic rocks as highly silisified and seresitic acidic tuff and crystal tuff [1].
Epa : This unit includes Andesitic basalt and pyroxene andesite lava that are exposed to a low in the northeast region. This unit is completely crushed and Kaolinite and alunite phenomena due to the influence of hydrothermal solutions almost common and oxidation of iron compounds is a consequence of this phenomenon [1].
B. Intrusive rocks:
These rocks are massive granite to granodiorite rock with granular texture. The granite in some places due to weathering processes have become grain granite. Apophyse of these bodies can be seen in the adjacent rocks (gra). Another of the lithological composition of the granite is separable Anzan massive (gra) is granite to granodiorite Khankandi (grk) [1].
Also another bulk of the intrusive rocks series includes Monzosyenite to monzodiorite bearing Pseudoleucite Rzgah (Snr) is exposed. Development of the mass is about 15 to 20 km2 [1].
C. Hydrothermal Alteration units:
Alteration units have been divided with the time and in the form of separate origin. This classification is based on the texture of the rock that their main buildings have been lost by hydrothermal solution. The solution flow along faults can also cause decomposition of the host rock [1].
The most decomposition zone of hydrothermal solutions can be seen in igneous rocks such as trachyte to trachyandesite (Epa) and Miocene (Ngt) [1].
METHODOLOGHY
Weights of evidence is a quantitative method for combining evidences in support of a hypothesis. Assume that for a particular region, a series of binary maps are known and are to be used as predictors of mineral potential of a particular type. Further, assume that the locations of a number of mineral deposits, or occurrences, are known. The occurrences are treated as points. The binary predictor maps can be thought of as input maps; the desired end-products are output maps showing probability estimates [5].
Weights of evidence is The most common bivariate model . Assume that for a particular region, a series of binary maps are known, and are to be used as predictors of mineral potential of a particular type. Further, assume that the location of a number of mineral deposits or occurrences, are known. The occurrence are treated as points. The binary predictor maps can be thought of as input maps; the desired end-products are output maps showing probability of occurrence and the associated uncertainty of the probability estimate [5].
According to this method, The conditional probability of choosing a cell with an occurrence, given that the cell contains pattern B is: [2], [5]
the conditional probability of finding an index as D witnessed such B (Geophysical or Geochemical anomaly or etc.) based on Bayesian probability theory can be explained by the following equation: [2], [5]
(1)
P(D|B) =P(D ∩ B) P(B)
In this equation P(D|B) the probability of a mineral deposit (D) related to the binary pattern (B) (Binary pattern map is composed only of two class and every position on it either appropriate or not appropriate). In equation (1), P(D|B)
equals to the total area occupied by D and B. The conditional probability P(D|B) equals to the ratio of the B binary pattern that is covered by reserves. Since this equation uses unity, consequently, if a witness is available to track, the search area is reduced and thus the risk of detection is high. If the conditional probability of B as a binary pattern in the presence of a deposit as D, be defined as the following equation: [2],[5]
P(D|B) =P(B∩D)
P(D) (2)
since P(B ∩ D) is the same as P(D ∩ B) then : [2], [5]
(3)
P(D|B) = P(D)P(B|D) P(B)
24
P(D|B̅) = P(D)P(B̅|D)
P(B̅) (4)
Obviously, the chance to find a deposit where there isn't an evidential theme less than where there is a evidential theme. As regards N(T) denotes a count of the number of unit cells and the number of training points is denoted as N(D), Suppose the evidential theme is denoted by B, N(B) is the area in unit cells of the region where B is present (class value=1, for example). Similarly, N(B̅) is the area in unit cells where B is absent (class value = 0, for example). If there is no missing data, then: [2]
𝑁(𝐵) + 𝑁(𝐵̅) = 𝑁(𝑇) (5)
According to the equation, It can be achieved the weights as W+ and W- that provide a measure of spatial association between the points and the evidential theme. A weight is calculated for each class of the evidential theme such as all geological units in a geological map. A positive value of the weight indicates that there are more points on that class than would occur due to chance; conversely a negative value indicates that fewer points occur than expected. A value of zero, or very close to zero, indicates that the training points are distributed randomly with respect to that class. For binary maps with only two classes (the labeling of class by a value is arbitrary), W+ is used for the weights where the evidential theme is present (value=2 in this instance), W- is used for the weights sign, except if they both equal zero.[2]
In general, the weights for binary themes are given by the ratio of the following conditional probabilities. Where P() denotes probability and in denotes natural logarithms. It is assumed that probabilities are estimated as simple area proportions, so that: [2]
𝑊+= LnP(B|D) P(B|D̅)= Ln
(B∩D)/D (B∩D̅)/D̅ (5)
W−= LnP(B̅|D) P(B̅|D̅)= Ln
(B̅∩D)/D (B̅∩D̅)/D̅ (6)
where (B ∩ D) is the number of training points on theme B, etc. The following working formula for W+ is:
𝑊+= 𝐿𝑛 𝑁(𝐵∩𝐷)/𝑁(𝐷)
[𝑁(𝐵)−𝑁(𝐵∩𝐷)]/[𝑁(𝑇)−𝑁(𝐷)] (7)
And similar expression for W-. It is interesting to note that if the area of the unit cell becomes very small, this expression approximately satisfies: [2]
W+= LnN(B∩D)/N(D)
N(B)/N(T) (8) The difference between the weights is known as the contrast, C. Thus: C = W+ - W- (9)
The contrast is an overall measure of spatial association between the training points and the evidential theme, combining the effects of the two weights. Sometimes, W+ can be close to zero, yet W- is strongly negative. This situation arises if the presence of the theme is not particularly predictive of training points, but the absence of the theme provides strong evidence that points are unlikely to occur. Conversely there can be an imbalance between the absolute values of W+ and W- in the other direction; or the two weights can have absolute values in about the same range [5].
In general, absolute weights values between 0 and 0.5 are mildly predictive; values between 0.5 and 1 are moderately predictive; values between 1 and 2 are strongly predictive, and greater than 2 are extremely predictive.[2]
The above equations are used for the case that we have only one evidential theme, but usually over a number of maps and evidential theme are seen. So these equations should be generalized for n evidence: [2]
P(D|B1, B2, … , Bn) =
P(D).P(B1|D).P(B2|B1,D)…P(Bn|Bn−1,…,B2,B1)
P(B1).P(B2|B1)…P(Bn|Bn−1,…,B2,B1) (10)
In this equation, the presence of any evidence is related to the presence of all previous evidence that by assumption of conditional independence in weights of evidence when several evidences (Bi) are present, so: [2]
P(D|B1, B2, … , Bn) = P(D). ∏
P(Bi|D) P(Bi)
n
i=1 (11)
After the calculation of the weights of the evidence and select the highest contrast, a binary map is drawn for each map. After that, these maps are combined and the P(D|B) values are calculated for all unit cells. Finally a plan is developed which represents the empirical probability distribution of a mining index per unit area (each cell) of the study area [2].
DATA ANALYSIS
25 The process used in the weights of evidence modeling is essentially a quantitative version of the inspection method of overlaying several different map themes to identify areas where mineralization may be present. In the inspection method, the larger number and magnitude of appropriate overlapping anomalies in data map such as geochemistry, geology or others, the qualitative indication that mineralization may be present. [3]
In this study, five binary predictive maps are used to as the input maps and end product is an output map showing the probability of occurrence and associated uncertainty of the probability estimates. [3]
1- Binary map of favorable host lithologies (Fig.1).
2- Binary map of favorable first derivative of aeromagnetic data derived from total aeromagnetic intensity (Fig.2). 3- Binary map of favorable faults derived from geological, remote sensing and geophysical faults (Fig.3).
4- Binary map of favorable hydrothermal alteration area derived from satellite imagery (Fig.4).
5- Binary map of favorable anomalous geochemical area of Cu, Au, Zn and Mn that have been chosen due to geochemical correlation of results of geochemical data (Fig.5).
6- Four Copper porphyry known deposits
WEIGHTS OF EVIDENCE ANALYSIS
In the weights of evidence modeling, the importance of theme layers in delineating areas with potential for deposits is determined mathematically by how it compares with the spatial distribution of the known mineral occurrences. When several themes are combined, the areas with the greatest coincidence of weights of produce the greatest probability of occurrence of undiscovered mineralization [2]. Three maps representing favorable host lithology, first derivative of total magnetic map and structural features are created and used for the weights of evidence analysis. Statistical values calculated to select the optimum classes that the best spatial correlation with the known mineral occurrence, then three binary maps are created. Two maps representing favorable geochemical features and alteration zones prepared as binary maps by the methods explained . At least the five binary maps are combined to create predictive GIS model [3]. A. Analysis of host lithology:
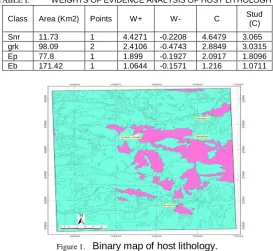
The weights of evidence analysis were used to determine the spatial association between the known mineral occurrences and the geological units (Table 1). [3]
The three units of Snr, grk and Ep were selected within the predictive pattern, based on calculated weights and contrast values equal to 2.0 or greater (Table 1). When contrast value is greater than 2, the association is considered extremely predictive [4]. Based on Table 1, a binary map of geological units was prepared (Fig 1), in which a value of 1 was attributed to inside predictive pattern (Pink area) and a value of 0 to outside predictive pattern (Green area) [3].
TABLE I. WEIGHTS OF EVIDENCE ANALYSIS OF HOST LITHOLOGHY
Stud (C) C W- W+ Points Area (Km2) Class 3.065 4.6479 -0.2208 4.4271 1 11.73 Snr 3.0315 2.8849 -0.4743 2.4106 2 98.09 grk 1.8096 2.0917 -0.1927 1.899 1 77.8 Ep 1.0711 1.216 -0.1571 1.0644 1 171.42 Eb
Figure 1. Binary map of host lithology. B. Analysis of first derivative of total aeromagnetic intensity data
26 of 7 were selected on the basis of the contrast value greater than 2 (Table 2) and then a binary map of first derivative of aeromagnetic data, which is a predictive pattern was prepared (Fig 2). In this map, again inside predictive pattern has a value of 1 (Pink area) and outside predictive pattern has a value of 0 (Green area) [3].
TABLE II. WEIGHTS OF EVIDENCE ANALYSIS OF FIRST DERIVATIVE OF AEROMAGNETIC DATA. Stud (C) C W- W+ Points Area (Km2) Class 1.2224 1.1235 -0.519 0.6044 3 804.41 7 0.6001 0.6776 -0.1036 0.574 1 276.24 6 0.5697 0.6399 -0.475 0.1649 4 1651.37 8
Figure 2. Binary map of first derivative of aeromagnetic data Figure 3.
C. Analysis of favorable faults
Faults which have spatial association with known mineralization were digitized from the 1:100,000 geological map of Ahar area. In addition, some other lineaments were obtained from the interpretation of landsat ETM+ data and aeromagnetic intensity data of the area. The lineaments digitized from the geological map were combined with those obtained from the landsat ETM+ image and aeromagnetic intensity data. The resulting structural domain was rasterized, buffered at distances of 100 meters wide bands extending in all directions from each fault to 1500 meters and crossed with the raster mineral occurrence point map to estimate the weights of evidence of the domain (Table 3). The optimum resulting buffer the maximum value of C was defined at 200 meters. Based on the result of weights of evidence analysis, binary map of faults, which is a predictive pattern with a 200 meters radius surrounding all faults, was prepared (Fig 4). In this map also a value of 1 was attributed to inside predictive pattern (Pink area) and a value of 0 to outside predictive pattern (green area) [3].
27 Figure 4. Binary map of Faults
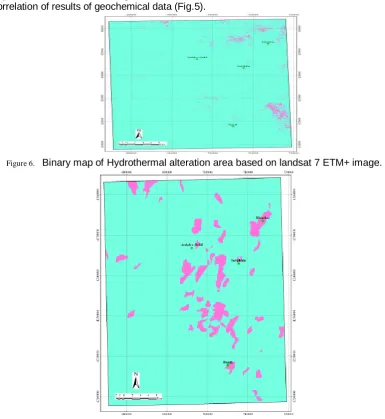
Figure 5. D. Hydrothermal alteration and Geochemical anomalous area
The binary map of favorable areas based on hydrothermal alteration area derived from satellite imagery (Fig.4). Also binary map of favorable anomalous geochemical area of Cu, Au, Zn and Mn that have been chosen due to geochemical correlation of results of geochemical data (Fig.5).
Figure 6. Binary map of Hydrothermal alteration area based on landsat 7 ETM+ image.
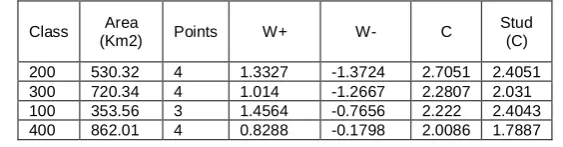
28 INTEGRATING PATTERNS FOR PREDICTING GIS EXPLORATION MODEL
The predictive exploration model was generated by summing the evidential patterns of five binary maps (Binary maps of host lithological units, first derivative of aeromagnetic data, faults, alteration zones and geochemical anomalies) representing the Cu porphyry recognition criteria in Ahar area. Figure 6 shows a predictive GIS model which has the posterior probability occurrence of ore indication in each unit cell. In figure 6 the highest probabilities of ore indication existence belong to areas where more recognition criteria exist.[3]
Figure 8. Predictive GIS model for Cu porphyry
FIELD WORKING
Sampling of area number 2 carried out after determining the appropriate distribution for the formation of porphyry copper mineralization type and the most promising areas. This area is located on the road of Ahar-Meshkin shahr near the Niaz village. The granodiorite is exposed in this place that is served argillic, potassic and phyllic alteration on surface.
Copper mineralized veins and veinlets within aplitic granite and monzonite host of malachite, azurite and other copper oxides are clearly visible in hand specimens (Fig. 7)[3].
29 Figure 10. Mineralization of Malachite (Green), Azurite (Blue) and other Copper oxides (black) as veinlets in the
granodiorite bedrock
Figure 11. Pyrite grains (Py) scattered in Hematite (Hm) in polish section.
Figure 12. Hematite grains (Hm), Magnetite (Mgn), Malachite (Ma) and Pyrite (Py) CONCLUSION
As the time and cost of the parameters that play a role in the economic sense of exploration projects, thus we should try to minimize these parameters. The usual method of determining the initial exploration area of potential geological map is surveying area, that may not be covered the all of region. Because, the area maybe covered with overburden and plants that cannot studied about alteration zones. All of these reasons lead to waste of time and money. Using GIS can make initial studies more precise in the office and can continue by carry out large-scale exploration maps, sampling, and analysis and were focused on the target area. This method also reduces the time and cost of exploration operations and also reduces the risk of exploration [3].
REFRENCES
[1] N. Alavi Tehran, A. Amani Fazl, and M. Mahdavi, "Report of geoogical map of Ahar – Scale 1:100,000", Tehran, Geological survey of Iran,
1988.
[2] M. Yousefi, A. Kamkar Rouhani., Principal of mineral potential modeling techniques (In geographical information system), Vol. 01, Tehran,
Amir Kabir University publications, 2010, pp. 137-142.
[3] M. Mohammad, "Introduction to promising mining areas within the region of 1:100,000 sheet Ahar using of data driven spatial analysis
method (emphasis on weights of evidence model)", Master Thesis, Payam-e-Noor university, Tehran, 2012, pp. 90-135.
[4] G.F. Bonham-Carter, "Geographic information system for Geoscientists, Modelling with GIS", vol.01, Canada, Geological survey of
Canada ,1994. p.269
[5] G.F. Bonham-Carter, F. P. Agterberg, and D. F. Wright, "Weights of evidence modelling: a new approach to mapping mineral potential",