Finite Element Analysis of J-Integral for Surface Cracks in
Round Bars under Combined Mode I Loading
A.E Ismail
1*, A.K Ariffin
2, S. Abdullah
2, M.J Ghazali
21Department of Engineering Mechanics, Faculty of Mechanical and Manufacturing Engineering, 86400 Batu Pahat,
Johor, MALAYSIA.
2Department of Mechanical and Materials Engineering, Faculty of Engineering, Universiti Kebangsaan Malaysia,
43400 Bangi, Selangor, MALAYSIA.
Received 5 March 2017; accepted 2 April 2017, available online 2 April 2017
1.
Introduction
In modern engineering, shaft is generally used to transfer mechanical power from one component to another. During in-service task, the shaft is exposed to the environmental harshness such as corrosion and material defects such as voids and pores. These defects will grow if no appropriate action is taken. According to Lin & Smith [1], any arbitrary shapes of cracks take semi-elliptical shape during growing processes. Then, linear elastic fracture mechanics approach is used to analyze the crack driving force for example stress intensity factor (SIF) [2-4]. Other solutions of other types of crack can be found in [5-6]. However, if the plasticity is sufficient, the use of SIF is not recommended [7-9]. Then, J-integral is appropriately implemented [10-12].
The solutions of SIFs for a wide range of geometries have been reported widely [11, 13]. However, it is not for the case of J-integral [14-15]. The solutions of J-integral is paramount important since mechanical components can be broke down due to excessive plastic deformation [7]. However, it is limited for the surface crack embedded in plates [16-19] and tubes [15, 20].
In this present study, surface crack in round bar subjected to combined loading is analyzed and discussed. Firstly, the present model is validated with the previous model using SIFs approach since limited solutions of J-integral are available. After, J-J-integral is calculated along the crack front for various types of crack geometries. Considering the first part of this paper, the analytical model is developed and the predicted values of J-integral are then compared.
Recently, an elastic-plastic analysis of surface crack become an important work especially when the cracked components are subjected to combine loading [2, 3].
2.
Numerical Modelling
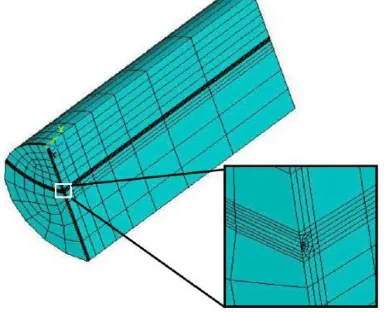
The geometry of the crack shown in Fig. 1 can be described by the dimensionless a/D and a/b, the so-called relative crack depth and crack aspect ratios, where D, a and b are the diameter of the bar, the crack depth and the major diameter of the ellipse, respectively. Any arbitrary points on the crack front can also be normalized as x/h, where h is the crack width, and x is the arbitrary distance of P from the symmetry axis. The outer diameter of the cylinder is 50 mm and the total length is 200 mm. Due to the symmetrical analysis involved, a quarter finite element model is constructed, in which the surface crack was situated at the center of the cylinder.
A finite element model is developed with special attention given to the crack tip by employing 20-node iso-parametric quadratic brick elements. The square-root singularities of stresses and strains are modelled by shifting the mid-point nodes to the quarter-point locations around the crack-tip region. The detail of the finite element model is shown in Fig. 2 with the associated singular finite elements around the crack tip. In order to remotely apply loadings to the structural component, a rigid element or multi-point constraint (MPC) elements was used to connect the nodes at a circumferential line at the end of the component, to an independent node. Fig. 3 shows a technique for constructing the independent node connected to the model using rigid beam elements.
The bending moment, My is directly applied to this
node, whereas the axial force is directly applied in the direction-x on the cross-sectional area of the bar. At the other end, the component is constrained appropriately. In order to obtain a suitable finite element model, it is necessary to compare the proposed model with other published models [11, 16, 17]. In this work SIFs results are used for the validation purposes. Since, it is hard to find the result of J-integral results for these particular
Abstract: This paper numerically discusses the role of J-integral along the surface crack front in cylindrical bar under combined mode I loading. It is also verified the analytical model derived from the first part of this paper by comparing the results obtained numerically using ANSYS finite element program. It is found that the proposed model capable to predict the J-integral successfully along the crack front but not for the area away from the deepest crack depth. This is probably due to the fact that the problem of singularity.
crack geometries. Fig. 4 shows a comparison of the dimensionless SIFs under bending moment, FI,b and axial
force, FI,a. The findings of this study are in good
agreement with those of previous models.
For modelling plastic behavior of the component, multilinear isotropic hardening (MISO) is used. MISO used von Mises criterion associated with isotropic hardening with a flow rule. The material stress-strain followed the Ramberg-Osgood relation as the following expression:
n
o o o
(1)
where o = Eo is a 0.2% of proof stress, is a material
constant and n is a strain hardening exponent. Two values of n are used, 5 and 10 represent the higher and lower strain hardening material models, respectively. All the model construction, linear and non-linear analyses are programmed into ANSYS APDL (Ansys Parametric Design Language).
Fig. 1 Nomenclature of a semi-elliptical surface crack.
Fig. 2 Quarter finite element model with associated singular element at the crack tip.
Fig. 3 Remotely applied moments using an MPC184 element.
(a)
(b)
Fig. 4 Validation of finite element model, (a) bending and (c) tension loadings.
3.
Results and Discussion
SIFs under bending and tension loadings involved only mode I failure mechanisms. Therefore, a superposition method can be explicitly used to combine SIFs as the following expression [2]:
*
, ,
I I a I b
K K K
Substituting the SIFs stated in the first part of this to yield the following expression:
*
, ,
I I a a I b b
K F aF a
(3)
Given that:
b a
(4)
where is the ratio between bending and tension stresses. Substituting Eq. (4) into Eq. (3) produces the following expression:
*
, ,
I a I a I b
K
a F
F
(5)
Rearrange Eq. (5) as the expression below:
* *
, ,
I
I I a I b
a K
F F F
a
(6)
Eq. (6) can be divided into two different expressions:
* *
, , ,
I I a I b I EQ
F
F
F
F
(7) * , * * , I FE
I I FE
a K F F a
(8)where a is a tension stress. Eq. (7) is used explicitly to
combine the SIF from bending and tension loadings and it is called as F*
I,EQ. Then, Eq. (8) is used to determine
combined SIF directly from FEA and it is called F* I,FE.
In ANSYS, it is hard to have combined SIFs directly because the SIFs are given in terms of KI, KII and KIII.
Therefore, an elastic J-integral was used by assuming that a single value of J-integral under the combined loading represented an unified SIFs consisting of KI, KII and KIII.
This is because in ANSYS, if J-integral is used in the elastic or plastic regions, it calculates only a single value of integral even under combined loadings. The elastic J-integral, Je. Rearrange it into the term of SIF, K for plain
strain condition yields the following expression:
* 2 1 FE e E K J
(9)
Eq. (9) is used to convert the J-integral into combined SIF, K*
FE, under combined loadings using FEA, and it
was then substituted into Eq. (8).
4.
Results and Discussion
Combination of FI,b and FI,a is conducted using Eq.
(7) where it is formulated analytically using a superposition method proposed by Newmann and Raju [13]. The dimensionless SIFs, FI,b and FI,a can also be
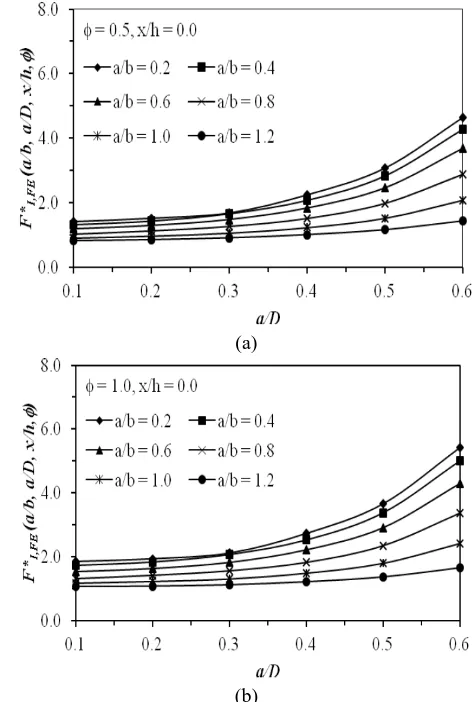
obtained in Ismail et al. [28], respectively. Results of combined SIFs calculated using Eq. (8) are presented in Fig. 8 for different loading ratio, at the deepest crack depth, x/h = 0.0.
(a)
(b) Fig. 5 Behaviour of F*
I,FE against a/D, (a) = 0.5 and (b) = 1.0.
Fig. 5(a) shows that for the SIFs dominated by the bending moment, all the SIFs seem to converge at a/D = 0.1. However, when the tension stress plays an important role the dispersion of the curves increased as shown in Fig. 5(b). This is indicated that is an important factor in determining the evolution of crack propagation processes. The comparisons between the SIFs combined explicitly and from FEA are showed in Fig. 6. Both results produce an excellent agreement to each other and the developed SIFs methodology can be successfully used to combine SIF for a similar type of failure mode.
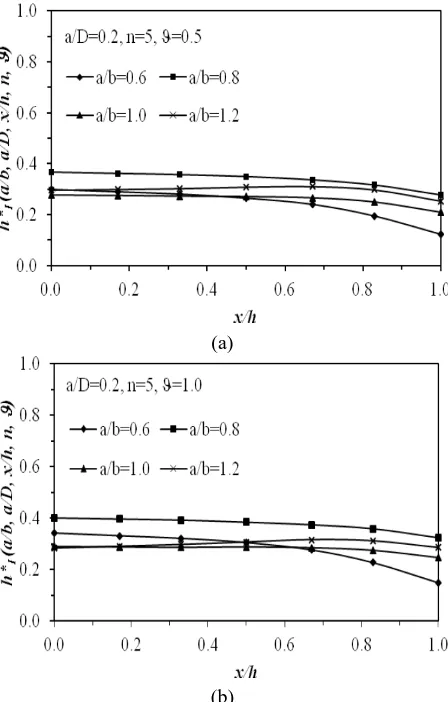
Fig. 7 shows a linear relationship between Jp-FE and Jp-normal obtained from six points along the crack front under combined loadings. Relative crack depth, a/D = 0.2 is considered in this work because the pattern of the curves are almost identical to each other for different a/D except different in magnitudes. For combined loadings dominated by tension force ( = 0.5) as shown in Fig. 8(a), h*
I function is lower than if = 2.0 is used as
compared with the Fig. 8(c). It is also showed that the h* I
before h*
I has turned down when it is reached x/h 0.7.
The decrement of h*
I in that region become significant if > 2.0 is used as revealed in Fig. 8(b).
(a)
(b) Fig. 6 Comparison of F*
I, (a) a/b= 0.2 and (b) a/b = 0.6.
Fig. 7 Relationship between Jp-FEand Jp-normal for a/b = 0.6
and a/D = 0.2 subjected to combined loadings.
This is related to the reduction of crack width with the increment of a/D. It meant that the deeper the cracks with shorter crack width are capable to reduce the propagating rate of the crack. When n = 10 is used instead of 5, the curve pattern of h*
I is almost similar to each other as
shown in Fig. 9. However, h*
I obtained using n = 10 is
lower than when n = 5 is used. This is due to the fact that n = 5 is a material assumed to behave lower strain behaviour. Up to this date, no such works available on this similar analysis to compare with. Therefore, no comparison is conducted to validate the present results.
(a)
(b) Fig. 8 Effect of h*
I against x/h for a/D = 0.2 and n = 5
with varied a/b subjected to different loading ratio, (a) = 0.5 and (b) = 1.0.
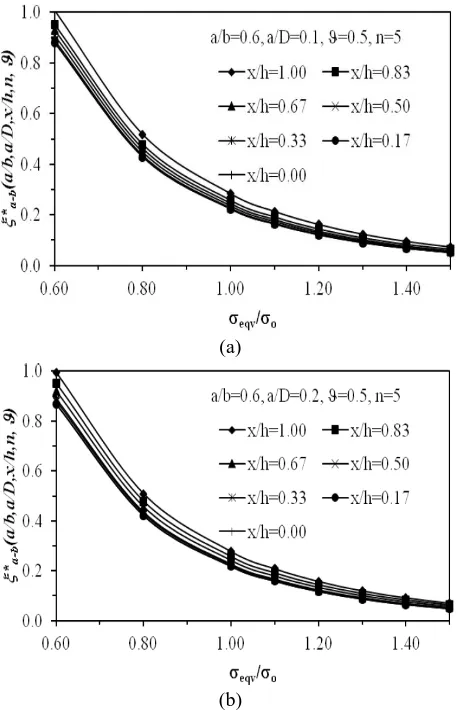
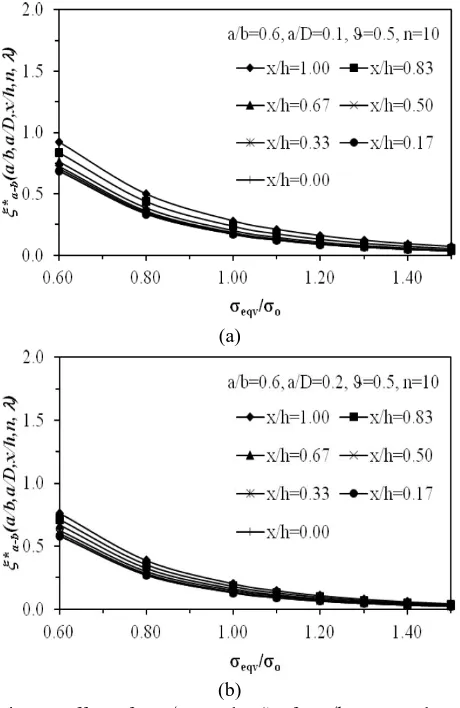
The characteristics of limit load, a-b under combined
loadings are presented in Figs. 10 and 11 for n = 5 and 10, respectively. In general, the limit load reduced as the a/D is increased. This is due to the fact that when a/D increased, the cross-sectional area of the bar is decreased. Consequently, it is affected the resistant capability of the bar therefore reduced the limit load. Normalised load, eqv/0 is also played an important role in determining the
limit load where it is reduced asymptotically as the normalised load increased.
The curve patterns of the limit loads are typically observed for all crack geometries that have considered. Therefore for this reason, the crack with a/b = 0.6 is considered to be discussed in this work. It is found that the limit load distributions can be divided into two distinct regions, eqv/0 < 1.0 (low load level) and eqv/0
> 1.0 (high load level). For the case eqv/0 < 1.0, the
indicated that the elastic J-integral is not suitable to be used in calculating the limit load.
(a)
(b) Fig. 9 Effect of h*
I against x/h for a/D = 0.2 and n = 10
with varied a/b subjected to different loading ratio, (a)
= 0.5 and (b)
= 1.0.The effect of Jeis still existed even it is omitted from
the calculation. In order to eliminate the effect of Je, it
should be minimised as possible. Compared with the region of eqv/0 > 1.0, the plastic J-integral has
dominated around the crack tip. This condition produced insignificant limit load fluctuations. This is also indicated that, plastic J-integral alone must be used in order to have accurate limit load of any cracked structures. When a/D is increased causing the limit load reduction. This is true for the fact that when a/D increased, it will reduce the crack ligament area. Consequently, increasing the plastic J-integral along the crack fronts. The effect of loading ratio, shown in Fig. 12 on the combined limit load is significant and found that by increasing the loading ratio has dispersed the limit load distribution.
The behaviour of combined limit load can be described by observing the J/Je pattern along the crack front. This
expression is derived as functions bar geometry, loading and material properties as follows:
(a)
(b)
Fig. 10 Effect of eqv/o on the a-b for a/b = 0.6 and n = 5
when a/D are varied (a) a/D = 0.1 and (b) a/D = 0.2.
1 * 1
2
2 *
1 2
1
1 n a
I o
e I
x x
J h
h h
x a x
J F
h R h
(10)
where:
J = Je+ Jp,
2
2 3
1
4 cos
2 4 3
F*
I = FI,a+ FI,b.
In Eq. (10), parameter x/h is assumed to be varied and others parameters are kept constant throughout the
analysis. Therefore, J/Je is determined by
2* *
1
I I
h F for
variety crack geometries under considerations. The
behaviour of *
* 2 1I I
h F against x/h for n = 5 and 10 are
shown in Figs. 13 and 14, respectively using different
loading ratios. Fig. 13(a) shows the *
* 2 1I I
= 0.1 with a/b are varied. It is found that the flattened
curves of *
* 2 1I I
h F occurred in the region x/h < 0.4.
This is indicated that a single value of limit load capable to predict J-integral. However, the predictions are limited within the specified region. The effects of on the curves are minimal. By increasing a/D produced the region of constancy shorter compared with lower value of a/D.
(a)
(b)
Fig. 11 Effect of eqv/o on the a-b for a/b = 0.6 and n =
10 when a/D are varied (a) a/D = 0.1 and (b) a/D = 0.2.
The distribution of hI*
1FI* 2is observed to divergesignificantly if = 2.0 is used showing the tensile stress dominated the stress condition in the bar. Therefore, it is induced lower plasticity effect and consequently, it is reduced the capability of the combined limit load to predict J-integral efficiently as shown in Figs. 13(b). However, the influence of become significant with the increment of a/D more than 0.2 especially for = 0.5.
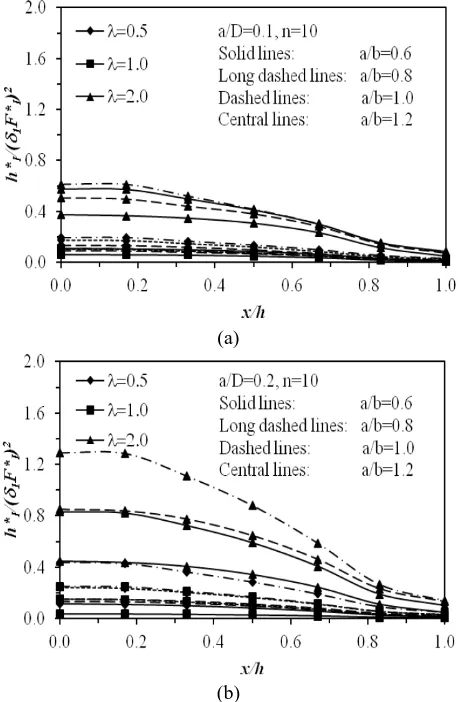
Fig. 14 shows the behaviour of *
* 2 1I I
h F which is
plotted against x/h using n = 10. It is found that the
magnitude of *
* 2 1I I
h F is higher than if n = 5 is used.
However, it is obviously revealed that the patterns of curves are almost the same as in the Fig. 13.
(a)
(b)
Fig. 12 Effect of eqv/o on the a-b for a/b = 0.6 and n = 5
using different loading ratios, (a) = 0.5, (b) = 1.0 dan = 2.0 for n = 5.
It is also found that the constancy of *
* 2 1I I
h F can
be observed clearly mainly for
1.0. In the same time, the constancy for a/D = 0.3 is limited within the region of x/h < 0.3 compared with the x/h < 0.6 for a/D 0.2. These characteristics are paramount important in order to predict J-integral using the proposed limit load. In general, for the combined bending and tension loadings, different limit load must be used to predict the J-integral for different points on the crack front. This isdue to the fact that the constancy of the *
* 2 1I I
h F is
difficult to occur and it is limited to the certain region of the x/h on the crack front.
5.
Summary
agreement to each other. For elastic-plastic analysis, J-integral is used as the fracture driving force and the solutions are calculated along the crack front for various crack geometries. Plastic influence function, h*I under
combined loadings are determined according to the EPRI formulation using different loading ratio, . It is showed that h*I is strongly related to the x/h, a/b, a/D, n and .
Since no available solutions of h*I under combined
loadings are available in the literature.
(a)
(b)
Fig. 13 Behaviour *
* 2 1I I
h F against x/h for, (a) a/D =
0.1 and (b) a/D = 0.2 for n = 5 using three different loading ratios.
Therefore, it is assumed that the model have produced acceptable results. The limit load in this work is based on the reference stress method. Then, the relation between integral and limit is established to investigate the J-integral prediction along the crack fronts. It is found that, the present limit load is not fully satisfied to predict the J-integral for all crack geometries considered in this work. Different limit loads should be used for different points along the crack front to predict J-integral. However, the prediction of J-integral can be performed for limited points on the crack fronts and it is strongly affected by a/D and .
(a)
(b)
Fig. 14 Behaviour *
* 2 1I I
h F against x/h for, (a) a/D =
0.1 and (b) a/D = 0.2 for n = 10 using three different loading ratios.
References
[1] Findley, K.O., Koh S.W., Saxena, A., J-integral expressions for semi-elliptical cracks in round bars. International Journal of Fatigue, Vol. 29, (2007), pp. 822-828.
[2] Ismail, A.E, Arrifin, A.K., Abdullah, S., Ghazali, M.J., Stress intensity factors for surface cracks in round bar under single and combined loadings. Meccanica, Vol. 47, (2012), pp. 1141 – 1156. [3] Ismail, A.E., Mode I stress intensity factors for
slanted cracks in round bars. International Review of Mechanical Engineering, Vol. 8, (2014a), pp. 511-516.
[4] Ismail, A.E., Multiple crack interaction in bi-material plates under mode I tension loading. Applied Mechanics and Materials, Vol. 629, (2014b), pp.57-61.
[5] Ismail, A.E., Ariffin, A.K., Abdullah, S., Ghazali, M.J., Off-set crack propagation analysis under mixed mode loadings. International Journal of Automotive Technology, Vol. 12, (2011a), pp. 225-232.
bar under mode III loadings. Research Journal of Applied Science, Engineering and Technology, Vol. 7, (2014a), pp. 1985-1993.
[7] Ismail, A.E., Ariffin, A.K., Abdullah, S., Ghazali, M.J., Ungkapan kamiran-J retak permukaan pada bar silinder padu kenaan beban ragam I. Jurnal Teknologi, Vol. 68, (2014b), pp. 7-17.
[8] Ismail, A.E., Ariffin, A.K., Abdullah, S., Ghazali, M.J., Daud, R., J-Integral Analysis of Surface Cracks in Round Bars under Combined Loadings. Advanced Material Research, Vol. 214, (2011b), pp. 187-191. [9] Kim, Y.J., Shim, D.J., Choi, J.B., Kim, Y.J.,
Approximate J estimates for tension-loaded plates with semi-elliptical surface cracks. Engineering Fracture Mechanics, Vol. 69, (2002a), pp.1447-1463.
[10]Lei, Y., J-integral and limit load analysis of semi-elliptical surface cracks in plates under combined tension and bending. International Journal of Pressure Vessel and Piping, Vol. 81, (2004a), pp. 31-41.
[11]Lei, Y., J-integral and limit load analysis of semi-elliptical surface cracks in plates under tension. International Journal of Pressure Vessel and Piping, Vol. 81, (2004b), pp. 21-30.
[12]Lei, Y., J-integral and limit load analysis of semi-elliptical surface cracks in plates under bending. International Journal of Pressure Vessel and Piping, Vol. 81, (2004c), pp. 43-56.
[13]Lei, Y., A review of limit load solutions for cylinders with axial cracks and development of new solutions. International Journal of Pressure Vessel and Piping, Vol. 85, (2008), pp. 825-850.
[14]Lei, Y., Budden, P.J., Limit load solutions for thin-walled cylinders with circumferential cracks under combined internal pressure, axial tension and
bending. Journal of Strain Analysis, Vol. 39, (2004), pp. 673-683.
[15]Lin X.B, Smith. R.A., Shape growth simulation of surface cracks in tension fatigue round bars. International Journal of Fatigue, Vol. 19, (1997), pp. 461–469.
[16]Newman, Jr. J.C., Raju, I.S., An empirical stress-intensity factor equation for the surface crack. Engineering Fracture Mechanics, Vol. 15, (1981), pp. 185-192.
[17]Raju I.S., Newman, J.C., Stress intensity factors for circumferential surface cracks in pipes and rods under tension and bending loads. Fracture Mechanics: ASTM Special Technical Publication Vol. 905, (1986), pp. 789–805.
[18]Rice, J.R., A Path Independent Integral and the Approximate Analysis of Strain Concentration by Notches and Cracks. Journal of Applied Mechanics, Vol. 35, (1968), pp. 379-386.
[19]Sattari-Far, I., Dillstrom, P., Local limit load solutions for surface cracks in plates and cylinders using finite element analysis. International Journal of Pressure Vessel and Piping, Vol. 81, (2004), pp. 57-66.
[20]Shih, C.F., Moran, B., Nakamura, T., Energy release rate along a three-dimensional crack front in a thermally stressed body. International Journal of Fracture, Vol. 30, (1986), pp. 79-102.