M E T H O D O L O G Y
Open Access
Maximum linkage space-time permutation scan
statistics for disease outbreak detection
Marcelo A Costa
1*and Martin Kulldorff
2Abstract
Background:In disease surveillance, the prospective space-time permutation scan statistic is commonly used for the early detection of disease outbreaks. The scanning window that defines potential clusters of diseases is cylindrical in shape, which does not allow incorporating into the cluster shape potential factors that can contribute to the spread of the disease, such as information about roads, landscape, among others. Furthermore, the cylinder scanning window assumes that the spatial extent of the cluster does not change in time. Alternatively, a dynamic space-time cluster may indicate the potential spread of the disease through time. For instance, the cluster may decrease over time indicating that the spread of the disease is vanishing.
Methods:This paper proposes two irregularly shaped space-time permutation scan statistics. The cluster geometry is dynamically created using a graph structure. The graph can be created to include nearest-neighbor structures, geographical adjacency information or any relevant prior information regarding the contagious behavior of the event under surveillance.
Results:The new methods are illustrated using influenza cases in three New England states, and compared with the cylindrical version. A simulation study is provided to investigate some properties of the proposed arbitrary cluster detection techniques.
Conclusion:We have successfully developed two new space-time permutation scan statistics methods with irregular shapes and improved computational performance. The results demonstrate the potential of these methods to quickly detect disease outbreaks with irregular geometries. Future work aims at performing intensive simulation studies to evaluate the proposed methods using different scenarios, number of cases, and graph structures.
Keywords:Spatial scan statistics, Space-time permutation, Sequential Monte Carlo
Background
The prospective space-time permutation scan statistic [1] is a widely-used method for early disease outbreak detection surveillance systems [2,3]. As opposed to the retrospective evaluation of disease cluster [4], its aim is to quickly detect an emerging infectious disease out-break in a prospective manner through daily or weekly data feeds and repeated statistical analyses. The statistic requires no information regarding the underlying popula-tion at risk. Rather, it compared the recent geographical distribution of cases in comparison to historical counts, searching for space-time interaction clusters, and adjust-ing for any purely spatial or purely temporal variation in
the counts. A cylinder structure with variable radius and height is used to scan the space-time region in order to select the candidate cluster with the maximum likelihood ratio statistic. The base of the cylinder represents the spatial component, and its height defines the time interval at which the cluster is allegedly located. A Monte Carlo simulation is performed to estimate the p-value using a data permutation procedure under the null hypothesis of no cluster.
A key component of the spatial scan statistic is the geometry of the scanning window. Originally, squares or rectangular windows were the primary shapes proposed [5]. Subsequent works applied circles, ellipses [6] and triangles [7,8]. More recently, spatial scan statistics have been applied using non-parametrical windows that take very irregular shapes [9-16].
* Correspondence:[email protected] 1
Department of Production Engineering, Universidade Federal de Minas Gerais, Belo Horizonte, Brazil
Full list of author information is available at the end of the article
Extensions of the irregular shaped scan statistic to the space-time setting have been a challenge. To augment the flexibility of the search procedure to handle an irregular shaped scanning window in three dimensions, requires more complex algorithms and more elaborated data structures. Consequently, more computing effort is needed. In disease surveillance, it is important to detect disease outbreaks as soon as the data are available, and therefore, computationally efficient methods must be designed. Takahashi et al. [17] proposed one such method using a nonparametric definition of the spatial extent of the cluster. It relies on a cylinder scanning window in which the base of the cylinder also assumes non-circular shapes. In brief, if the base is composed of a maximum of K regions and the center of the base is region i then irregular shapes, which must include regioni, are created using the combinations of the remaining K−1 regions. The method does not consider cluster candidates in which the regions are not connected, nor clusters that change its geographical size and shape over time.
In this paper, we propose an irregular shaped space-time permutation scan statistic that allow for two types of flexibility in the cluster shape. In the first proposal the cluster can be irregular only in space, which means that the spatial extent of the cluster is the same during the whole time period of the cluster. In the second proposal the cluster can be flexible in both space and time. This latter type is more informative, since it tries to incorporate the differential spatial extent of the cluster over time.
The two proposed methods were evaluated by mimick-ing a prospective surveillance system for influenza events during 2005, using daily data from Harvard Pilgrim Health Care, and using a simulation study. The methods were compared to the cylindrical space-time permutation scan statistic. Results show that all methods provided good outbreak detection. The irregular shaped versions pro-vide more details about the spatial and temporal extent of the outbreak. The cylindrical version is much faster computationally. This is so because the computational effort to create cylindrical shapes are much smaller than
creating irregular candidates. Due to the computational complexity, the standard Monte Carlo inference repre-sents a major burden in the time required to perform the disease surveillance with irregular shapes. Alterna-tively, we apply sequential Monte Carlo which provides an early stop of the Monte Carlo simulations if there is enough evidence from the simulated values that the null hypothesis is rejected. Consequently, it reduces the computational burden in the irregular cluster detection.
Results and discussion
Case study: influenza outbreak detection
We evaluated the new methods by mimicking a daily prospective analysis of historical cases of influenza in patients aged 13 and over who (i) went to a hospital emergency department in or around Boston, USA, and who (ii) had health insurance coverage from Harvard Pilgrim Health Care. Data from January 1, 2005, to December 31, 2005, were used with a total of 249 reported cases in 206 counties in Massachusetts, New Hampshire and Rhode Island. The data was provided by the Harvard Pilgrim Health Care Insurance Company. Figure 1 shows the daily number of visits.
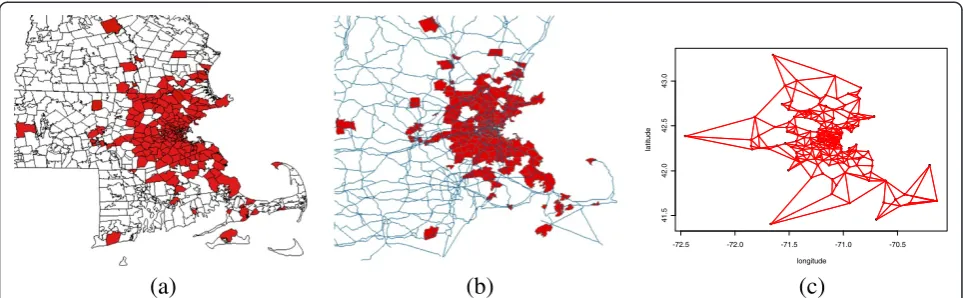
Figure 2a shows locations by ZIP code. Some of the areas in which cases were reported are scattered across the geographic region depicted. Consequently, if the graph structure is built just based on geographic adja-cency, then some areas will not be connected in the graph. In order to create an alternative graph structure in which each area is connected to at least two other areas, the adjacency structure was partially merged with the main transportation routes (Figure 2b) and the two nearest-neighbors. The final graph structure is shown in Figure 2c.
In disease surveillance and outbreak detection systems, graph structures are extremely useful, since they allow to incorporate a variety of information in the same structure. In this application, further information such as data on trains, buses or subways could have been used. It is of special interest if the graph information is strongly correlated to the event under surveillance. For
example, main roads were used as an upgrade to the spatial graph due to the fact that automobiles are the most common transportation system in the studied region.
For the monitoring system, a historical window of one year was used to estimate the marginal and expected number of cases in the candidate clusters under the null. The maximum temporal window length was set as seven days. The maximum geographical size of the cluster was chosen to be 50% of the total number of cases for the cylindrical method, and 100 zip-code areas for the two irregular mlink methods. The number of Monte Carlo simulations was set to 9,999 for the cylindrical scan statistic. The irregular shape procedures used sequential MC parameters h = 50 and n = 999. It is worth noting that the irregular geometry search procedures do not necessarily consider all possible cylindrical subsets as candidates. Therefore, a signal detected by the cylinder approach is not necessarily detected by the irregular mlinkmethods, and vice versa.
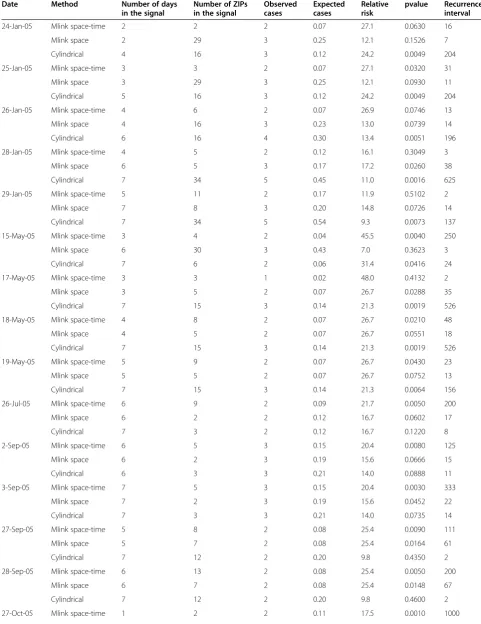
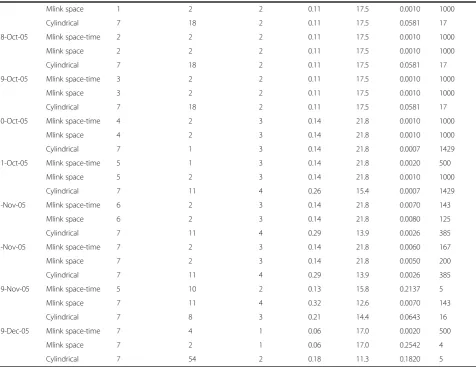
Table 1 shows the results for the surveillance system for Influenza during 2005. Overall, 41 days presented signals with recurrence interval greater than 100 days. If we account time overlap among the signal then 13 distinct signals were found. We only evaluated detected clusters with more than one case, even though clusters with only one case may present a high Recurrence Interval. There-fore, Table 1 shows 23 days with recurrence intervals greater than 100 days and 9 distinct overlapping signals.
From January 24, 2005, to January 29, 2005, the cylinder method detected a sequence of overlapping signals, as can be seen by the progressive increase of their temporal length. The arbitrary shape methods did not detect any strong signals during this period.
On May 15, 2005 the mlink space-time detected a signal which was later detected by the cylindrical method on May, 17, 18, and 19, 2005, respectively. The mlink space-timemethod also detected a signal on July 26 with 2 cases and Recurrence Interval of 200 days.
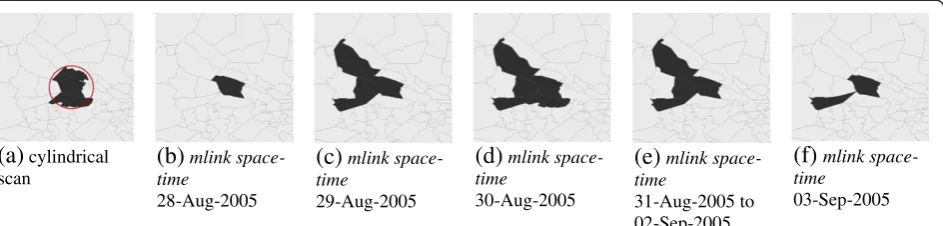
From September 2, 2005 to September 3, 2005, two overlapping signals were detected by the mlink space-time. Figure 3 shows the detected clusters using the cylindrical and the mlink space-time methods on September 3, 2005. The base of the cylindrical cluster is shown in Figure 3a whereas Figures 3b to 3f shows the temporal dynamics of the cluster found withmlink space-time in which the arbitrary cluster starts with one ZIP code, and it gradually increases until it reaches five ZIP codes. Then the cluster begins to vanishing on September 3, 2005.
Overlapping signals were also found by the arbitrary shape methods from September 27 to September 28, 2005. Themlink space-time methoddetected both signals.
From October 27, 2005 to October 31, 2005, a new sequence of overlapping signals was simultaneously detected by all methods. In particular, the mlink space-time and mlink space methods were the first to detect the signal. From November 1, 2005 to November 2, 2005, all methods detected the same signal.
Finally, one signal was detected by mlink-space on November 19, 2005, and one signal was detected by mlink space-timeon December 19, 2005.
Figure 4 compares the patterns of the signals detected by the cylindrical, themlink-space, and themlink space-time permutation scan statistics. In general, the shapes of the curves are different, and all methods share some regions in which the same signal is detected.
Simulation study
In order to investigate some properties of the proposed arbitrary cluster detection techniques, we designed the following simulation study. We first evaluated the number of cases within the period of one year from December 31st2004 to December 30th, 2005. The total number of cases in the period is 254 with a daily average of 0.69 cases/day. Second, under the null hypothesis of no spatial temporal clusters we randomly sampled with replacement 254 ZIP codes which showed at least one
(a)
(b)
(c)
-72.5 -72.0 -71.5 -71.0 -70.5
41.5
42.0
42.5
43.0
longitude
latitude
Table 1 Mimicking real-time analysis of emergency department visits due to influenza for individuals age 13 and over using cylindrical and irregular shaped space-time permutation scan statistics (mlink-spaceandmlink space-time) Date Method Number of days
in the signal
Number of ZIPs in the signal
Observed cases
Expected cases
Relative risk
pvalue Recurrence interval
24-Jan-05 Mlink space-time 2 2 2 0.07 27.1 0.0630 16
Mlink space 2 29 3 0.25 12.1 0.1526 7
Cylindrical 4 16 3 0.12 24.2 0.0049 204
25-Jan-05 Mlink space-time 3 3 2 0.07 27.1 0.0320 31
Mlink space 3 29 3 0.25 12.1 0.0930 11
Cylindrical 5 16 3 0.12 24.2 0.0049 204
26-Jan-05 Mlink space-time 4 6 2 0.07 26.9 0.0746 13
Mlink space 4 16 3 0.23 13.0 0.0739 14
Cylindrical 6 16 4 0.30 13.4 0.0051 196
28-Jan-05 Mlink space-time 4 5 2 0.12 16.1 0.3049 3
Mlink space 6 5 3 0.17 17.2 0.0260 38
Cylindrical 7 34 5 0.45 11.0 0.0016 625
29-Jan-05 Mlink space-time 5 11 2 0.17 11.9 0.5102 2
Mlink space 7 8 3 0.20 14.8 0.0726 14
Cylindrical 7 34 5 0.54 9.3 0.0073 137
15-May-05 Mlink space-time 3 4 2 0.04 45.5 0.0040 250
Mlink space 6 30 3 0.43 7.0 0.3623 3
Cylindrical 7 6 2 0.06 31.4 0.0416 24
17-May-05 Mlink space-time 3 3 1 0.02 48.0 0.4132 2
Mlink space 3 5 2 0.07 26.7 0.0288 35
Cylindrical 7 15 3 0.14 21.3 0.0019 526
18-May-05 Mlink space-time 4 8 2 0.07 26.7 0.0210 48
Mlink space 4 5 2 0.07 26.7 0.0551 18
Cylindrical 7 15 3 0.14 21.3 0.0019 526
19-May-05 Mlink space-time 5 9 2 0.07 26.7 0.0430 23
Mlink space 5 5 2 0.07 26.7 0.0752 13
Cylindrical 7 15 3 0.14 21.3 0.0064 156
26-Jul-05 Mlink space-time 6 9 2 0.09 21.7 0.0050 200
Mlink space 6 2 2 0.12 16.7 0.0602 17
Cylindrical 7 3 2 0.12 16.7 0.1220 8
2-Sep-05 Mlink space-time 6 5 3 0.15 20.4 0.0080 125
Mlink space 6 2 3 0.19 15.6 0.0666 15
Cylindrical 6 3 3 0.21 14.0 0.0888 11
3-Sep-05 Mlink space-time 7 5 3 0.15 20.4 0.0030 333
Mlink space 7 2 3 0.19 15.6 0.0452 22
Cylindrical 7 3 3 0.21 14.0 0.0735 14
27-Sep-05 Mlink space-time 5 8 2 0.08 25.4 0.0090 111
Mlink space 5 7 2 0.08 25.4 0.0164 61
Cylindrical 7 12 2 0.20 9.8 0.4350 2
28-Sep-05 Mlink space-time 6 13 2 0.08 25.4 0.0050 200
Mlink space 6 7 2 0.08 25.4 0.0148 67
Cylindrical 7 12 2 0.20 9.8 0.4600 2
case in the time period. The probability of the sampling was proportional to the number of cases in each ZIP code. Third, we also sampled with replacement 254 dates which were also selected from the observed dates in the time period. The probability of sampling was also pro-portional to the number of cases in each day. Then, we matched the sampled ZIP codes with the sampled dates. By doing so, the marginal distributions of the observed and the simulated data sets are the same.
We simulated separately one irregular dispersed cluster and one compact cluster. The spatial geometries of the clusters are shown in Figure 5. The irregular cluster has an irregular base as shown in Figure 5b. The geographical locations of the simulated clusters are close to the detected clusters in the case study data set. The time period of the clusters is from October 6th2010 to October 12th, or seven days. The irregular cluster has 5 ZIP codes and the compact cluster has 6 ZIP codes.
For the irregular and compact clusters the number of cases in the clusters was generated from a Poisson distri-bution with the mean parameter of 4.83, or 7 times the daily average of cases in the simulated period. Therefore, our simulations assume a relative risk of 7 in both the cylin-drical and irregular clusters. The value of the relative risk equal to 7 was chosen based on the minimum observed relative risk found in our analysis using the real data set.
We generated 1,000 simulated data sets for the compact cluster and 1,000 simulated data sets for the irregular cluster. For each simulated data set we mim-icked a surveillance system from October 1st to 30th. Therefore, for each simulated data base we performed daily surveillance for 30 consecutive days using the cylindrical, mlink-space, and the mlink space-time permutation scan statistics.
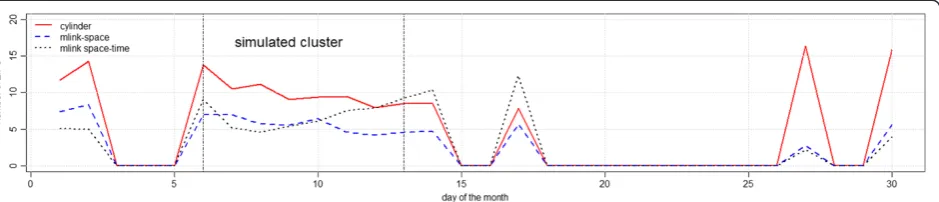
Figure 6 shows the number of simulations with p-values below 0.05 for the cylindrical, mlink-space and mlink
Table 1 Mimicking real-time analysis of emergency department visits due to influenza for individuals age 13 and over using cylindrical and irregular shaped space-time permutation scan statistics (mlink-spaceandmlink space-time)
(Continued)
Mlink space 1 2 2 0.11 17.5 0.0010 1000
Cylindrical 7 18 2 0.11 17.5 0.0581 17
28-Oct-05 Mlink space-time 2 2 2 0.11 17.5 0.0010 1000
Mlink space 2 2 2 0.11 17.5 0.0010 1000
Cylindrical 7 18 2 0.11 17.5 0.0581 17
29-Oct-05 Mlink space-time 3 2 2 0.11 17.5 0.0010 1000
Mlink space 3 2 2 0.11 17.5 0.0010 1000
Cylindrical 7 18 2 0.11 17.5 0.0581 17
30-Oct-05 Mlink space-time 4 2 3 0.14 21.8 0.0010 1000
Mlink space 4 2 3 0.14 21.8 0.0010 1000
Cylindrical 7 1 3 0.14 21.8 0.0007 1429
31-Oct-05 Mlink space-time 5 1 3 0.14 21.8 0.0020 500
Mlink space 5 2 3 0.14 21.8 0.0010 1000
Cylindrical 7 11 4 0.26 15.4 0.0007 1429
1-Nov-05 Mlink space-time 6 2 3 0.14 21.8 0.0070 143
Mlink space 6 2 3 0.14 21.8 0.0080 125
Cylindrical 7 11 4 0.29 13.9 0.0026 385
2-Nov-05 Mlink space-time 7 2 3 0.14 21.8 0.0060 167
Mlink space 7 2 3 0.14 21.8 0.0050 200
Cylindrical 7 11 4 0.29 13.9 0.0026 385
19-Nov-05 Mlink space-time 5 10 2 0.13 15.8 0.2137 5
Mlink space 7 11 4 0.32 12.6 0.0070 143
Cylindrical 7 8 3 0.21 14.4 0.0643 16
19-Dec-05 Mlink space-time 7 4 1 0.06 17.0 0.0020 500
Mlink space 7 2 1 0.06 17.0 0.2542 4
Cylindrical 7 54 2 0.18 11.3 0.1820 5
space-timemethods, for the irregular cluster simulations. The maximum number of detected signals was 513 which happened at the end of the time period of the simulated clusters. Both cylinder andmlink-spacemethods achieved similar results in detecting the cluster. All methods detected false signals after the 15th day, nevertheless bothmlink-spaceandmlink space-timemethods detected more false signals than the cylinder method.
Figure 7 shows the average number of ZIP codes which were falsely detected, that is, the average number of ZIP codes that do not belong to the real cluster, with p-values smaller than 0.05. Results show that the cylinder method detected, on average, larger clusters of false ZIP codes as compared tomlink-space andmlink space-timemethods. The mlink-space clusters presented smaller number of false ZIP codes, on average. Just after the simulated cluster
(a) cylindrical versus mlink-space recurrence intervals
(b) cylindrical versus mlink space-time recurrence intervals
Figure 4Comparison of the Recurrence Intervals (1/p-value) for signals detected in 2005 for methods: cylindrical scan statistic versus
mlink-space(a), and cylindrical scan statistic versusmlink space-time(b).
(a) cylindrical
scan
(b)
mlink space-time28-Aug-2005
(c)
mlink space-time29-Aug-2005
(d)
mlink space-time30-Aug-2005
(e)
mlink space-time31-Aug-2005 to 02-Sep-2005
(f)
mlink space-time03-Sep-2005
period, themlink space-timedetected a larger number of false ZIP codes, on average.
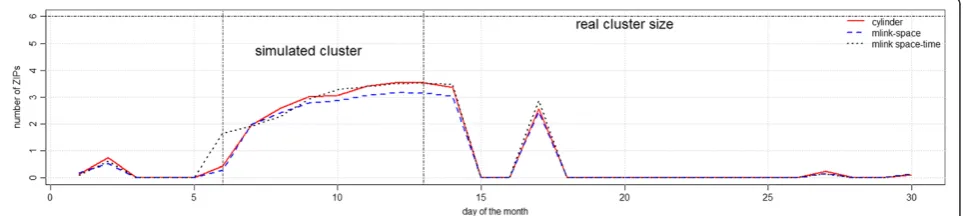
Figure 8 shows the average number of ZIP codes which belong to the real cluster, with p-values smaller than 0.05. In general, bothmlink-spaceand the cylinder methods detected the same number of ZIP codes, on average; whereas, the mlink-space timedetected a larger number of ZIP codes from the real cluster.
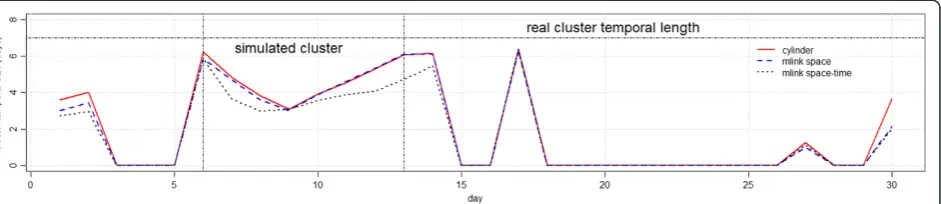
Figure 9 shows the average number of days, or the temporal length, of the detected clusters with p-values smaller than 0.05. In general, all methods detected clus-ters with temporal length that were smaller than the real temporal cluster length. Furthermore, false signals de-tected immediately after October 15th, on October 17th, overlap with the simulated clusters which indicate a latter detection of the true cluster.
Similar results were found for the simulated compact cluster as shown in Figures 10, 11, 12 and 13. In general, the cylindrical andmlink-spacemethods detected similar and higher number of signals than the mlink space-time method, as shown in Figure 10. The maximum number of detected signals was 514 which happened at the end of the time period of the simulated clusters. Figure 11 shows that the cylinder detected significant clusters with a larger number of false ZIP codes as compared to the mlink spaceand mlink space-time, on average. Just after the simulated cluster period, the mlink space-time detected a larger number of false ZIP codes, on average. Figure 12 shows that the cylinder and mlink space-time detected a higher number of ZIP codes from the real cluster, on average. The temporal length of the detected
clusters for all methods were smaller than the real clus-ter, on average, as shown in Figure 13.
In general, our simulation study suggests that detected signals that last for one day may represent false signals. In addition, based on the fact that the simulated irregular and circular clusters have similar geographical sizes and locations as compared to some of the detected clusters in the original data base, our simulation study suggests that the mlink space and circular scan statistics share similar statistical power. Nevertheless, the simulations also suggest that themlink spaceandmlink space-timescan statistics detects smaller clusters as compared to the circular scan statistic. Furthermore, clusters detected usingmlinkare closer to the real cluster size. In addition, if the real cluster is compact then mlink-space and cylinder methods detect more elements of the real cluster than mlink space-time, on average. Otherwise, if the real cluster is irregular then mlink space-time detects more elements of the real cluster than the cylinder andmlink spacemethods, on average.
Conclusion
The performance of the prospective irregular shaped space-time permutation scan statistics, named mlink-spaceand mlink space-time, is promising. The proposed methods provide clusters detection in which the shape of the cluster can be irregular in space, and equally important, its spatial extent may shift over time. Another contribution of our proposed methods is its capacity to integrate a wide variety of information during the clus-tering process. The surveillance analysis can be adapted
(a)
simulated cylinder cluster(b)
simulated irregular clusterFigure 5Spatial geometries of simulated clusters.The compact cluster(a)has 6 ZIP codes and the irregular cluster(b)has 5 ZIP codes.
to specific aspects of the event under study such as social networks, transportation routes, and landscape information. By doing so, it is expected that an Euclidian based surveillance system and our proposed methods may detect different clusters, and both types may be used in parallel.
The simulation findings are similar to those previously found using the purely spatialmlink[16]. If the emphasis is on statistical power for cluster detection, the cylinder scan statistic is attractive. If the emphasis is on the accurate determination of the cluster size, shape and boundaries, maximum linkage space and space-time are more suitable choices. Therefore, irregular based methods, such as the mlink scan statistics, provide more accurate results regarding shapes and boundaries than circular or cylinder scan statistic.
The comparative conclusion of this paper on space-time clusters is similar to prior work on purely spatial clusters [16]. Takahashi et al. [17] is the only other paper we could find on irregular shaped space-time scan statis-tic. Briefly, all irregular scan statistics share the problem of computing burden which is crucial for epidemic surveillances. For instance, Takahashi et al. evaluate all possible irregular clusters within a predefined circle, but the circle cannot be too big for computational reasons. The twomlinkmethods evaluate fewer configurations of irregular clusters, not allowing for super irregular clus-ters. By doing so, they reduce the computing time and allows the detection of larger clusters.
As previously mentioned, our proposed methods do rely on intensive computing resources. Although our proposed
methods were implemented using C\C++ language, the time required by the mlink space-timefor a total of 999 Monte Carlo simulations is 480 seconds (or 8 minutes), on average, using a Intel i7 1.73GHz with 8GB. The cylinder approach is much faster and requires 24 seconds for a total of 999 Monte Carlo simulations. Formlink, the sequential Monte Carlo procedure reduces the number of simulations to 50, or 24 seconds, on average. The sequen-tial Monte Carlo procedure can also be applied to the cylinder method which reduces the number of simulations to 50, or 1.2 seconds, on average. Nevertheless, if there is evidence that the null hypothesis is false during the sequential Monte Carlo, then the complete Monte Carlo simulation is required, and the sequential approach does not provide any time savings.
Alternatively, we evaluated the use of the Gumbel distribution as proposed by Abrams, Kulldorff and Kleinman [18] which fits the Gumbel distribution to a smaller set of simulated test statistics, say 499, and then estimate the p-value. However, the number of cases in our case study is very small, and as a consequence the distribution of the test statistic is mostly discrete. Thus, the Gumbel distribution did not fit properly to the distri-bution of the simulated test statistic.
While the focus on this paper has been on prospective surveillance systems for disease outbreak detection, the proposed methods can easily be adapted and applied to retrospective space-time analyses, where a historical data set is only analyzed once in order to detect space-time clusters during any time period covered by the data. Such analyses are used when there is less interest in the Figure 7Average number of ZIP codes which were falsely detected, with p-value smaller than 0.05 for irregular cluster simulations.
immediate public health need to detect emerging out-breaks, and more interest in understanding the general nature of the disease by studying its historical behavior.
For this paper, we generated the neighborhood struc-ture using purely geographical information and main transportation routes. Other community characteristics such as socio-economic status (SES) could also be incor-porated when defining close neighbors. For example, two poor communities may be closely connected even if they are not geographically adjacent, and combined geographical-SES based neighborhood structure could potentially help identifying health disparities generated clusters.
When doing actual surveillance to detect disease out-breaks, no statistical method can be expected to perform well unless the surveillance data is of high quality. For example, a reasonable proportion of the population in the surveillance area must be covered; a sufficient pro-portion of the covered individuals must be captured when they get sick; and it is critically import to be able to distinguish between one individual having two differ-ent health care encounters versus two differdiffer-ent individ-uals having one encounter each [19].
In summary, we have successfully developed two new space-time permutation scan statistics methods with irregular shapes and improved computational perform-ance, although the two proposed methods were not extensively evaluated for a wide variety of examples and in different scenarios. The methods were illustrated by
mimicking a real daily influenza surveillance system. The results demonstrate the potential of these methods to quickly detect disease outbreaks with irregular geometries. Future work aims at performing intensive simulation studies to evaluate the proposed methods using different scenarios, number of cases, and graph structures.
Methods
The space-time permutation scan statistic
The prospective space-time permutation scan statistic [1] uses the historical number of cases instead of the population at risk to estimate the expected number of cases in geographical locations. Furthermore, the space time permutation scan statistic automatically adjusts for any purely spatial and purely temporal variation in the data, such as different health utilizations rates in differ-ent geographical locations, seasonal patterns of disease incidence and day-of-week variations.
The method uses a very large number of overlapping cylinders of different shapes and sizes to scan cluster candidates. The circular base of the cylinder represents space, and is typically centered at any of a large number of pre-defined centroids and has a continuously variable radii. The height of the cylinder represents time, which can be short or long. If the method is applied to retro-spective studies, then the temporal component can have any start and end time. In this paper, we only consider the prospective version in which analyses are repeated Figure 9Average number of days in detected clusters with p-value smaller than 0.05 for irregular cluster simulations.
on a daily or weekly basis as new data arrives. Thus, the end of the cylinder is always at the current time, while its start time varies corresponding to different possible start times of the disease outbreak.
To select a final cluster candidate, the method first estimates the expected number of cases inside each cylinder as the following. Letcztrepresents the observed number of cases in area zduring timet. The total num-ber of cases is
C¼X
z X
t czt
The expected number of cases in a particular area z and time t is calculated based on the observed marginals,
μzt¼
1
C
X
t czt
! X
z czt
!
Next, the expected number of cases for a cylinder can-didate A placed in a particular region and time interval is the sum of the expected number of cases for each temporal-area inside the cylinder,
μA¼
X
z;t
ð Þ∈A
μzt
The test statistic is based on a Poisson approxima-tion to the hypergeometric distribuapproxima-tion of the observed
number of cases in the cylindercA. The Poisson gener-alized likelihood ratio,κis
κð Þ ¼A cA
μA
cA C−c A C−μA ðC−cAÞ
The cylinder candidate is the one with maximum likeli-hood ratio. To test the null hypothesis of space-time ran-domness, a Monte Carlo simulation [20] is performed. For each individual, the spatial location is held fixed, while a new random time is selected from the times observed over all individuals. This procedure does not change the spatial and temporal marginals. A large number of random per-mutations generate an empirical distribution under the null. The p-value is the proportion of simulated statistics higher than the observed one, that is, p = (R + 1)/(n+ 1), where R is the rank of the observed test statistic, andnis the number of Monte Carlo simulations. This procedure maintains the alpha level exactly, as long asα⋅(n+ 1) is an integer [21]. For recurrent analyses in a prospective surveil-lance system, we prefer to report the recurrence interval (RI) rather than the p-value. If analyses are done on a daily basis on daily data, RI = 1/p. If the null hypothesis is true, then the expected number of signals with RI > D is exactly one during any period of D days. For example, if the recur-rence interval is 2 years and 6 months, then under the null, the expected number of signals of the same strength or greater, during a 2 ½ year period of daily analyses, is one. Figure 11Number of ZIP codes which were falsely detected, with p-value smaller than 0.05 for compact cluster simulations.
Maximum linkage space-time permutation scan statistic
The maximum linkage irregular shaped space time per-mutation scan statistic is a generalization of the max-imum linkage irregular shaped purely spatial scan statistic [16]. It is sometimes abbreviated as mlink. The mlink method creates cluster candidates based on adja-cency graph structures. The method first considers each area as the initial cluster candidate and continuously evaluates the areas connected to the cluster by means of one or more edges. The criterion for selecting new areas is twofold. First, the method searches for the area that is the most connected to the current cluster or, equiva-lently, the area sharing the largest number of edges or connections to the current cluster. If two or more candi-dates share the same maximum number of connections, then the one capable of most increasing the likelihood ratio statistic is aggregated into the cluster; otherwise, the most connected area is automatically aggregated to the cluster. Furthermore, if the candidate areas do not contribute to increasing the cluster likelihood, then the one that least decreases the likelihood ratio statistic is selected. This process guarantees that at each step, the cluster incorporates one additional area. This continues until the cluster reaches a maximum size defined a priori by the user. The maximum number of connec-tions or maximum linkage (mlink) criterion introduces a subtle but necessary and efficient constraint in the likeli-hood function. Duczmal and Assunção [9] and Assunção et al. [12] showed that if the increase of the likelihood statistic is the only criterion for selecting the next area to aggregate to the cluster, then detection power is com-promised, and the detected clusters are usually oversized and oddly shaped, with many octopus-like tentacles going in different directions.
Figure 14 illustrates the growing process of the spatial component of the cluster. In this example, information on geographical adjacency was used to design the graph structure. Dark areas represent the current cluster, and gray areas are potential candidates for aggregation. The candidate areas share exactly two connections with the cluster. The selection decision is based on the likelihood maximization or on the least decrease in likelihood.
The outline of themlinkalgorithm is as follows.
The maximum linkage algorithm
Step 1. Start with one single area as the current cluster.
Step 2. Using the graph structure, sort neighbors according to their number of connections to the current cluster.
Step 3. Aggregate into the cluster the neighboring area with the maximum number of connections to the current cluster. That is, add the area outside the cluster that is connected to the most number of areas inside the cluster.
Step 4. If two or more neighbors share the same maximum number of connections, select the one that maximizes the likelihood function as compared to the other(s). If the candidate areas do not increase the likelihood, choose the one that least decreases the likelihood.
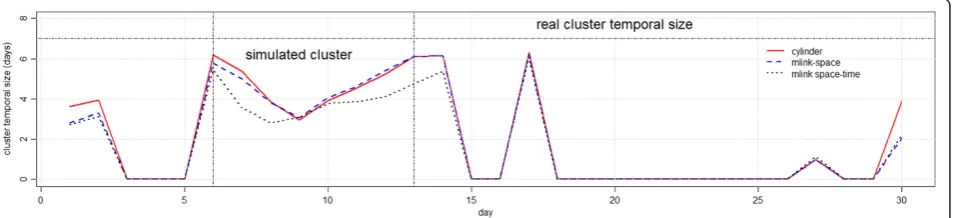
Figure 13Average number of days in detected clusters with p-value smaller than 0.05 for compact cluster simulations.
Step 5. Repeat steps 2 to 4 until the cluster reaches the maximum predetermined size.
Step 6. Repeat steps 1 to 5, until each area has been used as the start of the cluster.
Step 7. Note the cluster with the maximum likelihood ratio, obtained over all iterations in steps 1 to 6.
Creating cylindrical cluster candidates with irregular base using mlink
Our first proposal of an irregular space-time permuta-tion scan statistic is to use the mlinkalgorithm to build cylindrical candidates in which the base of the cylinder is irregular. Figure 15 illustrates the growing process of the cluster candidate. Suppose the height of the cylinder is fixed. Then, the standard cylindrical cluster algorithm varies the center and radius of the base, which is a circle. This is shown in Figure 15a. Our first mlink proposal, hereafter named mlink-space, creates cylinders with ir-regular base by applying themlinkalgorithm to the base of the cylinder as shown in Figure 15b. The base of the cluster candidate is created applying the mlink algo-rithm, which requires the graph structure generated from spatial adjacency.
Creating cluster candidates irregular in space and time using mlink
Our second proposal, hereafter named mlink space-time creates cluster candidates which are irregular in space and time using the mlink algorithm. The process of growing cluster candidates is shown in Figure 16. Figure 16a illustrates a regular grid of 9 areas and the adjacency graph structure. First, we assume that the adjacency structure does not change in time. We do so because the space-time permutation procedure assumes that the spatial marginal distribution does not change in
time under the null hypothesis. Therefore, for different times we have the same graph structure as shown in Figure 16b. Each vertex, or node shown in Figure 16b represents one areaiof the studied regions at timetand the vertices are the adjacency structure. Second, we con-nect the graph structures. That is, each areaiat timetis connected to its corresponding areaiat times: t+ 1 and timet−1, as shown in Figure 16c. Finally, each areaiat time t is also connected to its adjacent neighbors at times: t+ 1 and timet−1, as shown in Figure 16d. That is, neighbors in space are also neighbors in adjacent times. The final graph structure is composed of K×T edges in which the edges are the areas of the studied re-gion for the different times, and the vertices represents a set of spatial and space-time adjacency structures. Fur-thermore, the final graph structure can be easily scanned with the standard mlink algorithm, since both temporal and spatial components no longer exist. Constraints on the temporal height of the cluster are set by allowing the cluster to aggregate only nodes which are within the pre-specified range of time. Alternatively, the growing process stops if cluster candidates reach the maximum number of nodes, previously defined by the user.
Monte Carlo inference
After detecting the most likely cluster, it is important to evaluate how significant the candidate cluster is as com-pared to the null hypothesis of no space-time cluster. To do so, a set of replications of the original dataset is cre-ated under the null hypothesis randomization or permu-tation procedures. For each instance, the most likely cluster is found and its test statistic is accumulated gen-erating an empirical distribution. Inference is carried out by estimating the p-value as the ratio of the number of simulations in which the simulated statistic is higher
cylindrical cluster candidate
(b)
cluster candidate with irregular base(a)
than the observed one over the total number of simula-tions plus one. This Monte Carlo procedure implies that the cluster search procedure is executed as many times as the resolution required for the p-value. Therefore, one of the possibilities for optimizing computing time includes decreasing the number of Monte Carlo simula-tions. However, if the number of simulations is reduced, then inference precision is compromised. Nevertheless, statistical procedures such as sequential Monte Carlo [21-23] can replace the conventional method and de-crease the number of simulations.
Sequential Monte Carlo P-values
The main drawback of the proposed algorithms is the computational cost. At each step, the algorithm must se-lect a subset of the most connected areas and evaluate
the likelihood statistic for each one of them. In addition, a Monte Carlo simulation procedure tests the null hy-pothesis of the random occurrence of the cluster, further increasing the time required for this data analysis. In general, the more arbitrary is the cluster search geom-etry and the larger are the spatial and temporal compo-nents, the more intense is the computing. In particular, for disease outbreak detection and daily surveillance the space-time permutation scan statistic is commonly ap-plied on a daily basis. In some cases, multiple data streams analysis is required. Therefore, the computa-tional burden is a critical component in the design of a daily surveillance system that promptly detects clusters with arbitrary shapes.
To efficiently reduce computational costs, we apply se-quential Monte Carlo which reduces the expected
1 1.2 1.4 1.6 1.8 2 2.2 2.4 2.6 2.8 3
1 1.2 1.4 1.6 1.8 2 2.2 2.4 2.6 2.8 3
x-coodinate
y-coor
di
nat
e
(a)
1 1.5
2 2.5
3
1 1.5 2 2.5 3 1 2 3
x-coodinate y-coordinate
ti
m
e
(b)
1 1.5
2 2.5
3
1 1.5 2 2.5 3 1 2 3
x-coordinate y-coordinate
tim
e
(c)
1 1.5
2 2.5
3
1 1.5 2 2.5 3 1 2 3
x-coordinate y-coordinate
tim
e
(d)
number of Monte Carlo simulations under the null hy-pothesis. Briefly, the method searches for evidence that the null hypothesis is true from a smaller set of simula-tions. If it is found to be true, then the simulations are stopped; otherwise, the simulations are carried out using the conventional Monte Carlo analysis.
Sequential Monte Carlo sampling [21-23] optimizes computational costs assuming that the maximum num-ber of simulations is a random variable. Let U defines the test statistic; udefine the observed value; and F de-fine its null distribution. The conventional Monte Carlo compares the value ofuto the largestnrandom samples generated from F. If u is the r-th largest value from a total ofnvalues, then the p-value is estimated as (r + 1)/ (n + 1), which represents the significance level for the re-jection of the null hypothesis. However, if there is evi-dence that the null hypothesis will not be rejected from a small sample of simulations, then the generation of large samples from the null hypothesis is both effortless and computationally expensive. In this situation, it is im-perative to stop simulations as early as possible.
The sequential Monte Carlo produces exact p-values under the null hypothesis. The simulations are inter-rupted ifhsimulated values greater than the observedu are obtained; otherwise, it produces a maximum number of simulations (n). Let l be the number of Monte Carlo simulations in which h simulated values greater than u are obtained,l<n, the p-value is estimated as:
ps¼ h=l; if g¼h gþ1
ð Þ=ðnþ1Þ; if g<h
where g is the number of simulated values greater than
u, andhis the sequential parameter, Silva, Assunção and Costa [21] proved that for h = 50, there is no loss in power when compared to the exact test. Furthermore, in this situation, the expected number of simulations under the null hypothesis is equal to 115 [22].
Competing interests
The authors declare that they have no competing interests.
Authors’contributions
MAC led the effort to draft the manuscript. MK guided the manuscript's development. MAC and MK read and approved the final manuscript.
Acknowledgements
This work was supported by MIDAS (National Institutes of Health (NIH) grant # 1U01GM076672-03) and FAPEMIG.
Author details
1
Department of Production Engineering, Universidade Federal de Minas Gerais, Belo Horizonte, Brazil.2Department of Population Medicine, Harvard Medical School and Harvard Pilgrim Health Care Institute, Boston, USA.
Received: 29 March 2014 Accepted: 23 May 2014 Published: 10 June 2014
References
1. Kulldorff M, Heffernan R, Assunção R, Mostashari F:A space-time permutation scan statistic for disease outbreak detection.PLoS Med2005,2:216–224. 2. Stelling J, Yih WK, Galas M, Kulldorff M, Pichel M, Terragno R, Tuduri E,
Espetxe S, Binsztein N, O’Brien TF, Platt R:Automated use of WHONET and SaTScan to detect outbreaks of Shigella spp. using antimicrobial resistance phenotypes.Epidemiol Infect2010,138:873–883.
3. Yih WK, Deshpande S, Fuller C, Heisey-Grove D, Hsu J, Kruskal BA, Kulldorff M, Leach M, Nordin J, Patton-Levine J, Puga E, Sherwood E, Shui I, Platt R:
Evaluating real-time syndromic surveillance signals from ambulatory care data in four states.Public Health Rep2010,125:111–120.
4. Kulldorff M:Statistical Evaluation of Disease Cluster Alarms. InAdvanced Methods of Disease Mapping and Risk Assessment for Public Health Decision Making.Edited by Lawson A, Biggeri A, Böhning D, Lesaffre E, Viel JF, Bertollini R. London: Wiley; 1999:143–149.
5. Naus JI:Approximations for distributions of scan statistics.J Am Stat Assoc 1982,77(377):177–183.
6. Kulldorff M, Huang L, Pickle L, Duczmal L:An elliptic spatial scan statistic.
Stat Med2006,25:3929–3943.
7. Alm SE:On the distributions of scan statistics of a two-dimensional poisson process.Adv Appl Prob1997,29(1):1–18.
8. Alm SE:Approximation and simulation of the distributions of scan statistics for poisson processes in higher dimensions.Extremes1998,1(1):111–126. 9. Duczmal L, Assunção RM:A simulated annealing strategy for the detection of
arbitrarily shaped spatial clusters.Comput Stat Data Anal2004,45:269–286. 10. Patil GP, Taillie C:Geographic and network surveillance via scan statistics
for critical area detection.Stat Sci2003,14(4):457–465.
11. Patil GP, Taillie C:Upper level set scan statistic for detecting arbitrarily shaped hotspots.Environ Ecol Stat2004,11(2):183–197.
12. Assunção R, Costa M, Tavares A, Ferreira S:Fast detection of arbitrary shaped disease clusters.Stat Med2006,25(5):723–742.
13. Tango T, Takahashi K:A flexibly shaped spatial scan statistic for detecting clusters.Int J Health Geogr2005,4(1):11.
14. Duczmal L, Kulldorff M, Huang L:Evaluation of spatial scan statistics for irregularly shaped clusters.J Comput Graph Stat2006,15:428–442. 15. Wang TC, Yue CSJ:A binary-based approach for detecting irregularly shaped
clusters.Int J Health Geogr2013,12(1):25.
16. Costa MA, Assunção RM, Kulldorff M:Constrained spanning tree algorithms for irregularly-shaped spatial clustering.Comput Stat Data Anal2012,
56(6):1771–1783.
17. Takahashi K, Kulldorff M, Tango T, Yih K:A flexibly shaped space-time scan statistic for disease outbreak detection and monitoring.Int J Health Geogr 2008,7(14):1–14.
18. Abrams AM, Kleinman K, Kulldorff M:Gumbel based p-value approximations for spatial scan statistics.Int J Health Geogr2010,9(1):61.
19. Jung I, Kulldorff M, Kleinman KP, Yih WK, Platt R:Using encounters versus episodes in syndromic surveillance.J Public Health2009,31:566–572. 20. Dwass M:Modified randomization tests for nonparametric hypotheses.
Ann Math Statist1957,28(1):181–187.
21. Silva I, Assunção R, Costa M:Power of the sequential Monte Carlo test.
Sequential Anal2009,28(2):163–174.
22. Besag J, Clifford P:Sequential Monte Carlo p-value.Biometrika1991,
78(2):301–304.
23. Besag JE, Clifford P:Generalized Monte Carlo significance tests.Biometrika 1989,76:633–642.
doi:10.1186/1476-072X-13-20