Determination of normal ranges of regional and global phase
parameters using gated myocardial perfusion imaging with
Cedars-Sinai’s QGS software
Hadi Malek1, Fahimeh Rayegan1, Hassan Firoozabadi1, Fereidoon Rastgoo1,
Majid Haghjoo2, Hooman Bakhshandeh3, Ahmad Bitarafan-Rajabi1, Nahid Yaghoobi1
1Department of Nuclear Medicine and Molecular Imaging, Rajaie Cardiovascular Medical & Research Center,
Tehran, Iran
2Cardiac Electrophysiology Research Center, Rajaie Cardiovascular Medical & Research Center, Tehran, Iran 3Rajaie Cardiovascular Medical & Research Center, Tehran, Iran
(Received 7 June 2017, Revised 8 November 2017, Accepted 11 November 2017)
ABSTRACT
Introduction: Myocardial perfusion imaging using gated SPECT and phase analysis is an effective tool in evaluation of mechanical dyssynchrony. The purpose of this study was to determine the normal ranges of global and regional phase parameters.
Methods: A total of 100 patients with normal resting and stress electrocardiograms, low pretest likelihood for coronary artery disease and a normal gated MPI study were recruited in the study. All of the patients underwent a standard 2-day stress/rest gated MPI study according to standard protocols. The reconstructed images were further analyzed by Cedar-Sinai’s quantitative gated SPECT. Left ventricular phase indices were provided both globally and regionally for both genders and the normal interquartile range of these parameters were defined.
Results:Normal ranges of global and wall-based regional phase parameters are presented both in unisex and in gender-specific formats. Both global (P<0.001) and major LV regional phase parameters (P<0.05) are found to be significantly different between the two genders with a significant positive association between end-diastolic volume with phase global indices (P<0.01). There is also more synchronized phase distribution in phase analysis results of post-exercise gated MPI as compared to the phase analysis of the same patients at resting state.
Conclusion: Normal ranges of phase indices are defined in this article by using Cedar-Sinai’s QGS software. As normal ranges of phase dyssynchrony parameters are gender-specific and are related to LV volume, stress or resting state and stress type, the need for careful incorporation of these data is indicated in interpretation of phase studies.
Key words: Myocardial perfusion gated SPECT; Myocardial perfusion imaging; Left ventricular dyssynchrony; Phase analysis
Iran J Nucl Med 2018;26(1):16-21
Published: January, 2018
http://irjnm.tums.ac.ir
Corresponding author: Dr Nahid Yaghoobi, Department of Nuclear Medicine and Molecular Imaging, Rajaie Cardiovascular, Medical & Research Center, Vali-Asr Ave., Nyayesh Blvd., 1996911151, Tehran, Iran. E-mail: [email protected]
O
r
ig
in
a
l A
r
ti
c
Ir
a
n
J
N
u
c
l
M
e
d
2
0
1
8
,
V
o
l
2
6
,
N
o
1
(
S
e
ri
a
l
N
o
5
0
)
h
tt
p
:/
/i
rj
n
m
.t
u
m
s
.a
c
.i
r
J
a
n
u
a
ry
,
2
0
1
8
17
INTRODUCTION
Heart failure (HF) is a common clinical issue in public health with an estimated prevalence of 10% in the elderly and a one-year mortality risk of approximately 30% [1, 2]. Implication of appropriate pharmacologic therapies and cardiac resynchronization therapy (CRT) can improve outcomes and mortality of HF patients [3, 4]. It has been shown that left ventricular (LV) mechanical dyssynchrony plays an essential role in the pathophysiology of HF [5]. Various imaging modalities have been introduced for the assessment of LV dyssynchrony, including echocardiography [6], magnetic resonance imaging [7] and gated single photon emission computerized tomography (SPECT) myocardial perfusion imaging (MPI) [8, 9], among which the latter one has the advantage of simplicity, extensive availability, superior reproducibility and ability to concurrent assessment of myocardial scar for optimizing CRT in HF patients [5]. SPECT MPI could also be advantageous in patients in whom echocardiography might generate suboptimal results, such as obese patients, critically ill or those who’ve received recent chest surgery [10]. Various software packages are commercially available for evaluation of ventricular synchrony such as Emory cardiac toolbox (ECTb) and Cedars-Sinai’s quantitative gated SPECT (QGS) [11, 12]. The goal of this study is to determine the normal ranges of regional and global phase parameters using gated MPI with Cedars-Sinai’s QGS software.
METHODS Patients
The total study population consisted of a prospective cohort of 100 patients who were referred to our department in 2016 for MPI study on account of clinical indication and had normal resting and stress electrocardiograms (ECG), low pretest likelihood (<15%) for coronary artery disease (CAD) according to age, sex, symptoms and CAD risk factors on the basis of CAD consortium calculator [13, 14] and a normal myocardial perfusion and function on the basis of gated MPI study. A normal myocardial perfusion was defined as summed stress score (SSS) of less than 4 along with absence of elevated lung to heart uptake ratio (LHR≥0.4) or transient ischemic dilation (TID≥1.1 for exercise stress and TID≥1.15 for Dipyridamole stress MPI) and a normal myocardial function was described as global LV ejection fraction (EF) of ≥ 50% as well as summed motion score (SMS) and summed thickening score (STS) of zero [15]. Patients with valvular heart disease (as proved by patient’s echocardiographic study within a one-month period before the MPI), history of prior sternotomy or myocardial infarction, atrial fibrillation or multiple premature ventricular contractions (PVC) were not included in the study.
Image acquisition
Each patient underwent a standard 2-day stress/rest protocol. All of the patients received a weight-based adjusted standard dose of 99mTc-Sestamibi (8-12 mCi) in each phase of the study. The patients were stressed by either exercise or dipyridamole administration on the basis of the standard protocols [16]. Acquisitions were initiated 45-60 minutes after completion of pharmacologic stress test with dipyridamole or at resting state and 15 minutes after completion of exercise stress test, using a dual-detector SPECT/CT camera (Symbia T2, Siemens Medical Systems) with low-energy high-resolution collimators, 90-degree detector configuration and a non-circular body contoured 180 degree acquisition arc from right anterior oblique to left posterior oblique. Each phase of gated MPI SPECT study was performed in step-and-shoot mode with a zoom factor of 1.4, a matrix size of 64x64 (Pixel size, 6.6 mm) and 64 projections, 25 seconds per projection and 16-frame fixed temporal resolution forward-backward gating per R-R interval, using a fixed acceptance window of 30%. The energy window was set to 20% centered over the 140-keV photopeak, accepting gamma rays of 126 to 154 keV. The patients’ ECG were monitored through the acquisitions to make sure that the sinus rhythm is maintained during the imaging.
Image processing
The rotating raw images of all the participants were assessed visually and those with low-count density, motion artifact or interfering subdiaphragmatic or extracardiac activity were excluded [17, 18]. Reconstruction of the projection images was performed by filtered backprojection using postreconstruction Butterworth filtering (cutoff frequency, 0.4; order, 5). No attenuation or scatter correction was applied. The reconstructed images were further analyzed by Cedar-Sinai’s quantitative gated SPECT (QGS) in order to provide left ventricular phase indices on the basis of the software predefined algorithm [19].
Once processing has been completed, global whole-ventricle and regional wall-based LV synchrony parameters were derived for both resting state and poststress MPI studies, including phase histogram bandwidth (the width of the histogram that includes 95% of the samples)(PHB), phase standard deviation (the standard deviation of the phase distribution) (PSD) and entropy (defined by summation of [fi*log(fi)]/Log(n)], in which f and n are frequency in the ith bin and number of bins, respectively) [5, 11]. As
Ir
a
n
J
N
u
c
l
M
e
d
2
0
1
8
,
V
o
l
2
6
,
N
o
1
(
S
e
ri
a
l
N
o
5
0
)
h
tt
p
:/
/i
rj
n
m
.t
u
m
s
.a
c
.i
r
J
a
n
u
a
ry
,
2
0
1
8
18
Statistical analysis
The one-sample Kolmogorov-Smirnov test was used to assess whether continuous variables were normally distributed. Data were described as median (interquartile range). Synchrony parameters were compared between the two genders by Mann-Whitney U test and between the stress and resting state phases by Wilcoxon signed-rank test. Multivariate analysis was performed by quartile regression modules. Statistical analysis was performed by SPSS software (IBM SPSS Statistics for Windows, version 22.0. IBM Inc. Armonk, NY) and Stata 14 for windows (Stata Inc. Texas, USA). A P value of less than 0.05 was considered statistically significant.
RESULTS Patients
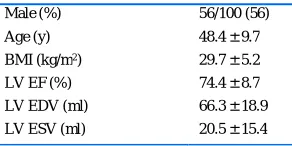
Of the total 100 subjects who were recruited in the study, 56 (56%) were male and 44 (44%) were female. The patient characteristics are presented in Table 1.
Phase analysis result and sex difference
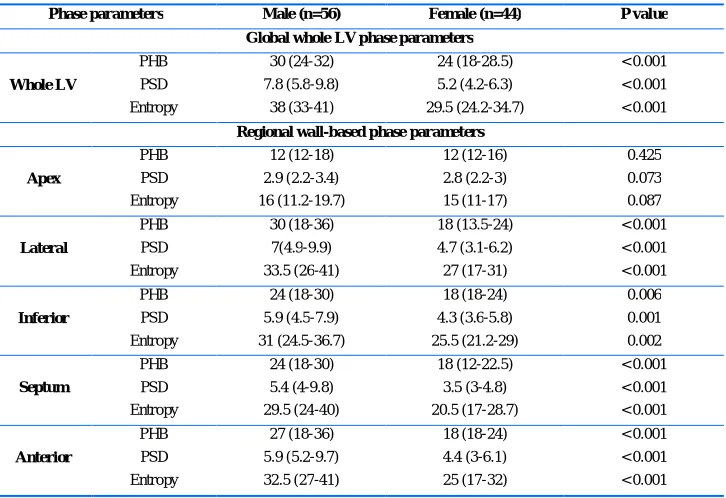
The global whole-ventricle and regional wall-based LV synchrony parameters, including PHB, PSD and entropy at resting state are presented in an overall format for both genders in Table 2 and in a gender-specific format in Table 3.
As it is shown in Table 3, there is a significant difference between the median of phase parameters of males and females, both globally and regionally for major LV walls except for apex.
Table 1: Characteristics of study population.
Male (%) 56/100 (56)
Age (y) 48.4 ± 9.7
BMI (kg/m2) 29.7 ± 5.2
LV EF (%) 74.4 ± 8.7
LV EDV (ml) 66.3 ± 18.9
LV ESV (ml) 20.5 ± 15.4
LV = Left ventricle; EDV = diastolic volume; ESV = End-systolic volume; Statistics are numbers (%) or mean standard deviation.
Phase analysis result and stress type difference
We found a significant difference in PHB, PSD and entropy between stress and resting states in patients who performed stress test with exercise as it is shown in Table 4. However, no significant difference was found in patients who underwent pharmacologic stress test with dipyridamole as compared to resting state. Furthermore, there is a significant difference in entropy and PSD on the basis of the stress type (P
value of 0.03 and 0.042, respectively) whereas no such a difference was found in PHB (P=0.412).
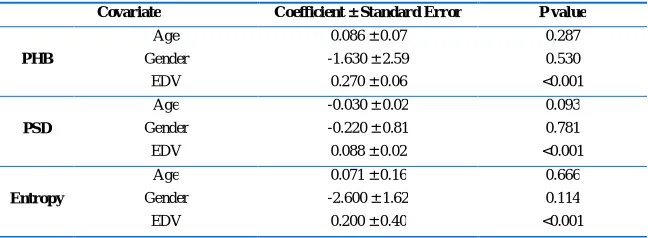
Multivariate regression analysis
Multivariate analysis was performed to investigate the adjusted associations between age, gender and EDV with global indices of phase analysis at resting state. As it is shown in Table 5, after adjustment, only EDV was found to have significant positive association with global indices (P<0.01).
DISCUSSION
Our study evaluates global whole ventricle and regional wall-based phase parameters in a normal population of referred patients with low likelihood of CAD, normal baseline and stress ECG and normal MPI study without known heart disease in whom synchronous myocardial contraction is expected. To the best of our knowledge, this study is one of the few studies that define normal range of global whole ventricle and the first study which defines regional wall-based phase parameters.
Analysis of LV contractile phase has been used for decades to evaluate LV dyssynchrony, beginning with equilibrium multiple gated blood pool scintigraphy in early days [21] to SPECT MPI in recent years. Today, various software programs are available, from which global and regional phase parameters can be derived [11]. We analyzed all SPECT MPI studies by Cedars-Sinai QGS software, by which global and regional phase measurements are derived from automatically created myocardial surfaces on a count-based algorithm [22]. Furthermore, it has been proposed that several factors might potentially influence phase distribution including gender, total accumulated count, radionuclide injection dose, stress or resting state and the amount of frames per cardiac cycle [23]. In order to lessen the impact of the aforementioned factors, we followed the standard procedure of MPI and the obtained images were meticulously quality controlled.
We also evaluated phase parameters in each gender, which shows a significant difference in both global and regional phase parameters of major LV walls as a result of different LV volumes. There is also difference in global whole ventricle phase parameters between our population and previously presented American population whereas it is partially similar to Japanese population [11, 19].
Ir
a
n
J
N
u
c
l
M
e
d
2
0
1
8
,
V
o
l
2
6
,
N
o
1
(
S
e
ri
a
l
N
o
5
0
)
h
tt
p
:/
/i
rj
n
m
.t
u
m
s
.a
c
.i
r
J
a
n
u
a
ry
,
2
0
1
8
19
Table 2: Overall global and regional synchrony phase parameters at resting state.
Whole LV Apex Lateral Inferior Septum Anterior
PHB 30 (24-36) 12 (12-18) 24 (18-30) 21 (18-30) 16 (18-24) 24 (18-30)
PSD 6.3 (4.9-8.5) 2.9 (2.2-3.1) 5.8 (4.2-8.8) 5.1 (3.9-7.3) 4.6 (3.2-6.5) 5.5 (4.1-8.3)
Entropy 34 (27-40) 16 (11-18) 30 (23.2-38.7) 28 (22-34.7) 26 (19-32) 30 (23-36.7)
Data presented as median (interquartile range); PHB and PSD in degrees and entropy in percent; PHB = phase histogram bandwidth; PSD = phase standard deviation.
Table 3: Gender-Specific global and regional synchrony parameters (n=100).
Phase parameters Male (n=56) Female (n=44) P value
Global whole LV phase parameters
Whole LV
PHB 30 (24-32) 24 (18-28.5) < 0.001
PSD 7.8 (5.8-9.8) 5.2 (4.2-6.3) < 0.001
Entropy 38 (33-41) 29.5 (24.2-34.7) < 0.001
Regional wall-based phase parameters
Apex
PHB 12 (12-18) 12 (12-16) 0.425
PSD 2.9 (2.2-3.4) 2.8 (2.2-3) 0.073
Entropy 16 (11.2-19.7) 15 (11-17) 0.087
Lateral
PHB 30 (18-36) 18 (13.5-24) < 0.001
PSD 7(4.9-9.9) 4.7 (3.1-6.2) < 0.001
Entropy 33.5 (26-41) 27 (17-31) < 0.001
Inferior
PHB 24 (18-30) 18 (18-24) 0.006
PSD 5.9 (4.5-7.9) 4.3 (3.6-5.8) 0.001
Entropy 31 (24.5-36.7) 25.5 (21.2-29) 0.002
Septum
PHB 24 (18-30) 18 (12-22.5) < 0.001
PSD 5.4 (4-9.8) 3.5 (3-4.8) < 0.001
Entropy 29.5 (24-40) 20.5 (17-28.7) < 0.001
Anterior
PHB 27 (18-36) 18 (18-24) < 0.001
PSD 5.9 (5.2-9.7) 4.4 (3-6.1) < 0.001
Entropy 32.5 (27-41) 25 (17-32) < 0.001
Data presented as median (interquartile range); PHB and PSD in degrees and entropy in percent; PHB = phase histogram bandwidth; PSD = phase standard deviation.
Table 4: Global synchrony phase parameters at stress and resting state
Phase parameter Stress type Stress Rest P value
PHB Dipyridamole 24 (18-30) 30 (18-36) 0.200
Exercise 24 (18-27) 30 (24-36) <0.001
PSD Dipyridamole 5.9 (4.6-7.8) 6.2 (4.5-7.9) 0.968
Exercise 5.1 (4.2-6.5) 6.3 (4.9-8.8) <0.001
Entropy Dipyridamole 32 (28-37) 34 (27-39) 0.616
Exercise 29 (25-32) 34 (27-40) <0.001
Ir
a
n
J
N
u
c
l
M
e
d
2
0
1
8
,
V
o
l
2
6
,
N
o
1
(
S
e
ri
a
l
N
o
5
0
)
h
tt
p
:/
/i
rj
n
m
.t
u
m
s
.a
c
.i
r
J
a
n
u
a
ry
,
2
0
1
8
20
Table 5: Multivariate regression analysis of factors influencing global phase parameters at resting state.
Covariate Coefficient ± Standard Error P value
PHB
Age 0.086 ± 0.07 0.287
Gender -1.630 ± 2.59 0.530
EDV 0.270 ± 0.06 <0.001
PSD
Age -0.030 ± 0.02 0.093
Gender -0.220 ± 0.81 0.781
EDV 0.088 ± 0.02 <0.001
Entropy
Age 0.071 ± 0.16 0.666
Gender -2.600 ± 1.62 0.114
EDV 0.200 ± 0.40 <0.001
PHB = phase histogram bandwidth; PSD = phase standard deviation; EDV = End-diastolic volume
Moreover, we found that PHB, PSD and entropy are fairly similar for major LV walls (anterior, septal inferior and lateral walls). Nonetheless, phase parameters of apex were considerably different that may be explained by its smaller size and lower count accumulation at this region.
This study also showed that there is a significant different yet more synchronized phase distribution as described by narrower phase histogram with smaller PSD in phase analysis results of post-exercise gated MPI as compared to the phase analysis of the same patients at resting state. This finding is similar to the result of Li study, in which the homodynamic effect of exercise and shorter stress-to-acquisition interval were introduced as possible reasons for this finding [24]. In summary, based on the current study findings, the interpretation of phase analysis results should be cautiously performed considering the influence of LV volume, which may vary according to patient’s gender or stress type.
Study limitations
As phase parameters may differ among various software programs, the normal values that are presented in this article should not be considered as interchangeable with other software programs.
CONCLUSION
The normal range of global and regional phase parameters of LV are presented in this article. As these parameters are affected by the LV volume, phase analysis of the gated SPECT MPI should be interpreted on the basis of a population- and gender-specific normal database.
REFERENCES
1. Bui AL, Horwich TB, Fonarow GC. Epidemiology and risk
profile of heart failure. Nat Rev Cardiol. 2011 Jan;8(1):30-41.
2. Van Spall HG, Shanbhag D, Gabizon I, Ibrahim Q, Graham
ID, Harlos K, Haynes RB, Connolly SJ. Effectiveness of
implementation strategies in improving physician
adherence to guideline recommendations in heart failure: a systematic review protocol. BMJ Open. 2016 Mar 31;6(3):e009364.
3. McMurray JJ, Adamopoulos S, Anker SD, Auricchio A,
Böhm M, Dickstein K, Falk V, Filippatos G, Fonseca C, Gomez-Sanchez MA, Jaarsma T, Køber L, Lip GY, Maggioni AP, Parkhomenko A, Pieske BM, Popescu BA, Rønnevik PK, Rutten FH, Schwitter J, Seferovic P, Stepinska J, Trindade PT, Voors AA, Zannad F, Zeiher A; Task Force for the Diagnosis and Treatment of Acute and Chronic Heart Failure 2012 of the European Society of Cardiology, Bax JJ, Baumgartner H, Ceconi C, Dean V, Deaton C, Fagard R, Funck-Brentano C, Hasdai D, Hoes A, Kirchhof P, Knuuti J, Kolh P, McDonagh T, Moulin C, Popescu BA, Reiner Z, Sechtem U, Sirnes PA, Tendera M, Torbicki A, Vahanian A, Windecker S, McDonagh T, Sechtem U, Bonet LA, Avraamides P, Ben Lamin HA, Brignole M, Coca A, Cowburn P, Dargie H, Elliott P, Flachskampf FA, Guida GF, Hardman S, Iung B, Merkely B, Mueller C, Nanas JN, Nielsen OW, Orn S, Parissis JT, Ponikowski P; ESC Committee for Practice Guidelines. ESC guidelines for the diagnosis and treatment of acute and chronic heart failure 2012: The Task Force for the Diagnosis and Treatment of Acute and Chronic Heart Failure 2012 of the European Society of Cardiology. Developed in collaboration with the Heart Failure Association (HFA) of the ESC. Eur J Heart Fail. 2012 Aug;14(8):803-69.
4. Yancy CW, Jessup M, Bozkurt B, Butler J, Casey DE Jr,
Colvin MM, Drazner MH, Filippatos G, Fonarow GC, Givertz MM, Hollenberg SM, Lindenfeld J, Masoudi FA, McBride PE, Peterson PN, Stevenson LW, Westlake C.
2016 ACC/AHA/HFSA Focused Update on New
Pharmacological Therapy for Heart Failure: An Update of the 2013 ACCF/AHA Guideline for the Management of Heart Failure: A Report of the American College of Cardiology/American Heart Association Task Force on Clinical Practice Guidelines and the Heart Failure Society of America. J Am Coll Cardiol. 2016 Sep 27;68(13):1476-1488.
5. Chen J, Garcia EV, Bax JJ, Iskandrian AE, Borges-Neto S,
Soman P. SPECT myocardial perfusion imaging for the assessment of left ventricular mechanical dyssynchrony. J Nucl Cardiol. 2011 Aug;18(4):685-94.
6. Galderisi M, Cattaneo F, Mondillo S. Doppler
echocardiography and myocardial dyssynchrony: a
Ir
a
n
J
N
u
c
l
M
e
d
2
0
1
8
,
V
o
l
2
6
,
N
o
1
(
S
e
ri
a
l
N
o
5
0
)
h
tt
p
:/
/i
rj
n
m
.t
u
m
s
.a
c
.i
r
J
a
n
u
a
ry
,
2
0
1
8
21
7. Lardo AC, Abraham TP, Kass DA. Magnetic resonance
imaging assessment of ventricular dyssynchrony: current and emerging concepts. J Am Coll Cardiol. 2005 Dec 20;46(12):2223-8.
8. Henneman MM, Chen J, Dibbets-Schneider P, Stokkel MP,
Bleeker GB, Ypenburg C, van der Wall EE, Schalij MJ, Garcia EV, Bax JJ. Can LV dyssynchrony as assessed with phase analysis on gated myocardial perfusion SPECT predict response to CRT? J Nucl Med. 2007 Jul;48(7):1104-11.
9. Chen J, Garcia EV, Folks RD, Cooke CD, Faber TL, Tauxe
EL, Iskandrian AE. Onset of left ventricular mechanical contraction as determined by phase analysis of ECG-gated myocardial perfusion SPECT imaging: development of a diagnostic tool for assessment of cardiac mechanical dyssynchrony. J Nucl Cardiol. 2005 Nov-Dec;12(6):687-95.
10. Health Quality Ontario. Stress echocardiography with
contrast for the diagnosis of coronary artery disease: an evidence-based analysis. Ont Health Technol Assess Ser. 2010;10(10):1-59.
11. Nakajima K, Okuda K, Matsuo S, Kiso K, Kinuya S, Garcia
EV. Comparison of phase dyssynchrony analysis using gated myocardial perfusion imaging with four software programs: Based on the Japanese Society of Nuclear Medicine working group normal database. J Nucl Cardiol. 2017 Apr;24(2):611-621.
12. Rastgou F, Shojaeifard M, Amin A, Ghaedian T,
Firoozabadi H, Malek H, Yaghoobi N, Bitarafan-Rajabi A, Haghjoo M, Amouzadeh H, Barati H. Assessment of left ventricular mechanical dyssynchrony by phase analysis of gated-SPECT myocardial perfusion imaging and tissue Doppler imaging: comparison between QGS and ECTb software packages. J Nucl Cardiol. 2014 Dec;21(6):1062-71.
13. Genders TS, Steyerberg EW, Hunink MG, Nieman K,
Galema TW, Mollet NR, de Feyter PJ, Krestin GP, Alkadhi H, Leschka S, Desbiolles L, Meijs MF, Cramer MJ, Knuuti J, Kajander S, Bogaert J, Goetschalckx K, Cademartiri F, Maffei E, Martini C, Seitun S, Aldrovandi A, Wildermuth S, Stinn B, Fornaro J, Feuchtner G, De Zordo T, Auer T, Plank F, Friedrich G, Pugliese F, Petersen SE, Davies LC, Schoepf UJ, Rowe GW, van Mieghem CA, van Driessche L, Sinitsyn V, Gopalan D, Nikolaou K, Bamberg F, Cury RC, Battle J, Maurovich-Horvat P, Bartykowszki A, Merkely B, Becker D, Hadamitzky M, Hausleiter J, Dewey M, Zimmermann E, Laule M. Prediction model to estimate presence of coronary artery disease: retrospective pooled analysis of existing cohorts. BMJ. 2012 Jun 12;344:e3485.
14. Almeida J, Fonseca P, Dias T, Ladeiras-Lopes R,
Bettencourt N, Ribeiro J1, Gama V. Comparison of coronary artery disease consortium 1 and 2 scores and duke clinical score to predict obstructive coronary disease by invasive coronary angiography. Clin Cardiol. 2016 Apr;39(4):223-8.
15. van Werkhoven JM, Schuijf JD, Gaemperli O, Jukema JW,
Boersma E, Wijns W, Stolzmann P, Alkadhi H, Valenta I, Stokkel MP, Kroft LJ, de Roos A, Pundziute G, Scholte A, van der Wall EE, Kaufmann PA, Bax JJ. Prognostic value of multislice computed tomography and gated single-photon emission computed tomography in patients with suspected coronary artery disease. J Am Coll Cardiol. 2009 Feb 17;53(7):623-32.
16. Henzlova MJ, Duvall WL, Einstein AJ, Travin MI,
Verberne HJ. ASNC imaging guidelines for SPECT nuclear cardiology procedures: Stress, protocols, and tracers. J Nucl Cardiol. 2016 Jun;23(3):606-39.
17. Malek H, Hedayati R, Yaghoobi N, Bitarafan-Rajabi A,
Firoozabadi SH, Rastgou F. The Effect of milk, water and lemon juice on various subdiaphragmatic activity-related artifacts in myocardial perfusion imaging. Res Cardiovasc Med. 2015 Sep 14;4(4):e29235.
18. Malek H, Ghaedian T, Yaghoobi N, Rastgou F,
Bitarafan-Rajabi A, Firoozabadi H. Focal breast uptake of 99mTc-sestamibi in a man with spindle cell lipoma. J Nucl Cardiol. 2012 Jun;19(3):618-20.
19. Van Kriekinge SD, Nishina H, Ohba M, Berman DS,
Germano G.Automatic global and regional phase analysis from gated myocardial perfusion SPECT imaging:
application to the characterization of ventricular
contraction in patients with left bundle branch block. J Nucl Med. 2008 Nov;49(11):1790-7.
20. Malek H, Yaghoobi N, Hedayati R. Artifacts in
Quantitative analysis of myocardial perfusion SPECT, using Cedars-Sinai QPS Software. J Nucl Cardiol. 2017 Apr;24(2):534-542.
21. Botvinick EH, Frais MA, Shosa DW, O'Connell JW,
Pacheco-Alvarez JA, Scheinman M, Hattner RS, Morady F, Faulkner DB. An accurate means of detecting and characterizing abnormal patterns of ventricular activation
by phase image analysis. Am J Cardiol. 1982
Aug;50(2):289-98.
22. Germano G, Kiat H, Kavanagh PB, Moriel M, Mazzanti M,
Su HT, Van Train KF, Berman DS. Automatic quantification of ejection fraction from gated myocardial perfusion SPECT. J Nucl Med. 1995 Nov;36(11):2138-47.
23. Singh H, Patel CD, Sharma P, Naik N, Singh S, Narang R.
Does perfusion pattern influence stress-induced changes in left ventricular mechanical dyssynchrony on thallium-201-gated SPECT myocardial perfusion imaging? J Nucl Cardiol. 2015 Feb;22(1):36-43.
24. Li D, Zhou Y, Feng J, Yuan D, Cao K, Garcia EV, Chen J.