DESERT 12 (2008) 139-147
Assessment of land use changes using remote sensing and GIS
and their implications on climatic variability for Balachaur
watershed in Punjab, India
S. Bazgeer
a*, P.K. Sharma
b, R.K. Mahey
a, S.S. Hundal
a, A. Sood
ba
Dept. of Agronomy and Agrometeorology, Punjab Agricultural University, Ludhiana, India
b
Punjab Remote Sensing Centre, Ludhiana,India
Received 3 December 2006; received in revised form 6 November 2007; accepted 20 February 2008
Abstract
Decadal changes in land use/land cover for Balachaur watershed in Nawanshahar district, Punjab, India were studied using black and white aerial photographs for March 1984 on approximately 1:20,000 scale and multidate geocoded false colour composites (FCC) of IRS-1D LISS-III on 1:50,000 scale for March 2002, September 2002, and May 2003 and interpreted visually to prepare land use/land cover maps for the year 1984 and 2003. The results revealed that the area under crop land, moderately dense forest, degraded forest, degraded land in hills and piedmont plains, barren land along choes (seasonal streams) has decreased; whereas, the area under settlements, dense forest, plantations, industrial use, ponds, choes and brick kilns has increased over a span of 20 years. By virtue of afforestation and forest conservation, the density of vegetation in Siwalik hills and piedmont areas has increased. The area under moderately dense forest (1956.7 ha) and degraded forest (755.5 ha) got upgraded to dense forest while 755.5 ha of degraded forest changed to moderately dense forest. The impact of land use/land cover alterations on climatic variability at micro-level revealed that the linear trends computed for the 5-yearly moving average of maximum temperature showed an increasing trend from 1984 to 2003, whereas the minimum temperature, rainfall, and potential evapotranspiration showed a decreasing trend. Inspite of increasing forest cover in the study area, these trends in different meteorological parameters did not corroborate the findings of some earlier reports. Thus land use/ land cover changes over time may not be the only factor which causes variation in meteorological parameters. It implies that there might also be other factors such as CO2 concentration and its effect on green house gases, atmospheric pollution and spectral distribution of the incoming solar radiation, which affect climatic variability in a region.
Keywords: Land use change; Climatic variability; Remote sensing; Potential evapotranspiration
1. Introduction
Information on spatial and temporal
distribution of land use/land cover are essential pre-requisite for any planning, management and
∗ Corresponding author. Tel.: +98 912 4013264; fax: +98 21 66070040.
E-mail address: [email protected]
by virtue of their speed and cost effectiveness have an edge over conventional methods of survey and therefore, have been widely used for mapping, monitoring and detecting the temporal changes in land use and forest cover (Sharma et al., 1989; Rao, 1991; Dhinwa et al., 1992; Kumar et al., 2002; Navalgund, 2002).
Several studies have revealed that the micro-level changes in climate with respect to rainfall and temperature variations are related to albedo changes, which in turn could be due to land use/land cover modifications (Otterman, 1973; Ormerod,1976; Charney and Stone,1975). Sarma et al (2001) reported that an increase in vegetation cover and wetland extent lead to decreased albedo and increased convective activity resulting in more rainfall. Similarly, as the vegetation and wetlands tend to absorb heat, the ambient air temperatures are likely to decrease. They suggested that the land use/land cover changes during the period 1970-98 in the Godavari deltaic region may be responsible for the increased rainfall from 75 mm to 479 mm and decrease in average maximum temperature from 32.9°C to 32.4°C, 31.8°C to 31.6°C and 33°C to 32.4°C in different meteorological stations located in this region. Kalnay et al (2006)estimated the impact of land-surface forcing on temperature trends in eastern United States using Observation Minus Reanalysis (OMR) method by computing the difference between the trends of the surface temperature observations(which reflected all the sources of climate forcing, including surface effects) and the NCEP/NCAR reanalysis surface temperature (only influenced by the assimilated atmospheric temperature trends).They concluded that The OMR seasonal cycle results suggest that the impact of the greenhouse gases dominates in winter,whereas it appears that the impact of surface forcings dominates in the summer.
Submontainous region in north-east Punjab covering nearly 9.5 per cent of total geographical area of the state is locally known as Kandi area. The area due to its uneven topography and erratic rainfall, experiences a variety of problems such as soil erosion, low productivity and shortage of fuel and fodder. Keeping this in view, the present
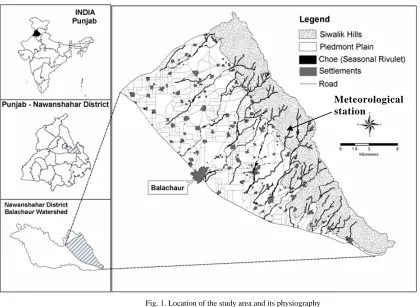
The Balachaur watershed is a representative watershed of the Kandi area and is situated in Nawanshahar district of Punjab state, India. It lies between 30°58’ to 31°13’N latitude, and 76°13’ to 76°31’ E longitude, and the elevation varies from 280 to 510 m above mean sea level. The watershed has undulating topography and covers a total area of 296 sq. km. The major physiographic units in the area are Siwalik hills, piedmont plain and seasonal rivulets locally known as Choes (Figure 1).
Erosion and deposition due to fluvial action of the Choes are two geomorphological processes active in the watershed (Sharma et al., 1986). The forests are confined to hill slopes and piedmont plain. Agriculture is the main stay of the people and nearly 57 per cent area is under rainfed agriculture. Wheat, gram, maize and turmeric are the main crops of the area. The area has semi-arid sub-tropical climate with hot summers and cold winters. The mean maximum temperature varies from 19.3°C in January to 38.4°C in May while the mean minimum temperature varies from 5.2°C in January to 25°C in June. Annual average rainfall is about 1108 mm out of which 73 percent is received in the rainy season from south-west monsoons during July to September.
3. Materials and Methods
Fig. 1. Location of the study area and its physiography
Table 1. Satellite data used for digital image processing for the year 2002-03*
RMSE Sensor Scene (Path/ row No.) Date No. of GCPs
Max Min
LISS-III 93/48 March 2002 53 0.97 0.07
LISS-III 94/49 September 2002 41 0.92 0.11
LISS-III 95/49 May 2003 60 0.99 0.1
*The overall root mean square error (RMSE) in the second order models ranges from 0.38 to 0.44 and 0.34 to 0.43 in X and Y direction, respectively
Land use/land cover classification scheme suggested by National Remote Sensing Agency Hyderabad (NRSA 1989) was adopted for land use/land cover mapping. Five major land use/land cover categories at level-I were identified and mapped based on differences in tone, shape, size, texture, pattern and association. These categories were further subdivided into twelve categories at level-II. Flowchart of the methodology for land use change analysis is shown in figure 2.
Using Arc GIS version 8.3, a spatial database was created for each land use/land cover class and the aerial extent of each category computed separately for the year 1984 and 2003. The results were tabulated for comparison and further analysis to ascertain the changes.
4. Results
The spatial distribution and extent of change in each land use/land cover class was worked out through maps for the year 1984 and 2003. The changes in various classes and the extent of change in each category are given in table 2. Agricultural land covered 58.20 per cent (17224.1 ha) area of the Watershed in 1984 which got reduced to 57.38 per cent (16978.6 ha) during the period from 1984 to 2003. The built-up land covered 4.05 per cent (1197.1 ha) in 1984 which rose to 7.91 per cent (2341.4 ha) during 2003. The wasteland area decreased from 8.49 per cent (2513.8 ha) in 1984 to 3.80 per cent (1125.6 ha) in 2003. The total forest area did not change much (27.66% in 1984 to 27.51% in 2003) over the
Figure 2 : Steps involved for land use change analysis
Visual interpretation
Visual interpretation
Base maps
Ground truth
Verification and
finalization of maps
Transferring photo interpretation units derived from aerial
photos (1984) and satellite imageries (2002-03) on base
maps 1:25000 / 1:50000 using optical pantograph
Land use map (1984)
Land use map (2003)
Digitization
Assigning Attributes
Land use plots and
statistics (1984)
Land use plots and
statistics (2003)
Overlaying and
integration
Land use change
analysis
Table 2. Net land use/ land cover changes between 1984 and 2003 in Balachaur Watershed Area (ha)
Land use class
1984 2003
Decadal change in area (ha)
Percent change of total watershed area
Settlements 1099.9 2140.0 +1041.1 +3.52
Crop Land 16498.3 15574.5 -923.8 -3.12 Dense Forest 2606.2 5145.0 +2538.8 +8.58 Moderately Dense Forest 3472.5 1897.0 -1575.5 -5.32 Degraded Forest 2107.2 1099.4 -1007.8 -3.41
Plantation 725.8 1404.1 +678.3 +2.29
Degraded Land in hills and piedmont plain 1669.9 808.4 -861.50 -2.91 Barren Land along Choes 843.9 317.2 -526.7 -1.78
Industrial area 97.2 201.4 +104.2 +0.35
Pond 17.2 35.6 +18.4 +0.06
Choes (Seasonal Rivulet) 318.1 620.3 +302.2 +1.02 Brick Kiln/ Mining Area 137.2 350.5 +213.3 +0.72
Total watershed area 29593.4 29593.4
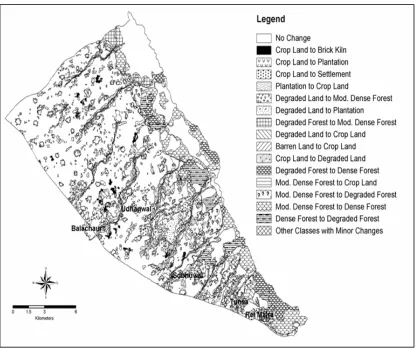
period of 20 years, however some area of degraded and moderately dense forest has been transformed to dense forest as a result of improvement in vegetation cover through afforestation under Integrated Watershed Development Programs. For change analysis, the maps for the year 1984 and 2003 were overlaid
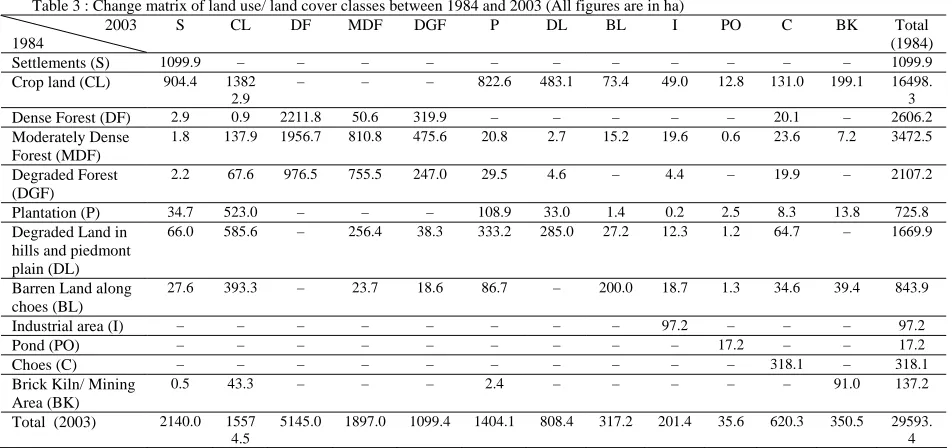
using Arc GIS and derived map showing the transformed and unchanged polygons was generated (Figure 3). In order to find the contribution of a particular land use class to other classes, an area cross-tabulation (change matrix) for the year 1984 against 2003 was worked out using Arc GIS (Table 3).
Degraded Forest (DGF)
Plantation (P) 34.7 523.0 – – – 108.9 33.0 1.4 0.2 2.5 8.3 13.8 725.8 Degraded Land in
hills and piedmont plain (DL)
66.0 585.6 – 256.4 38.3 333.2 285.0 27.2 12.3 1.2 64.7 – 1669.9 Barren Land along
choes (BL)
27.6 393.3 – 23.7 18.6 86.7 – 200.0 18.7 1.3 34.6 39.4 843.9
Industrial area (I) – – – – – – – – 97.2 – – – 97.2
Pond (PO) – – – – – – – – – 17.2 – – 17.2
Choes (C) – – – – – – – – – – 318.1 – 318.1
Brick Kiln/ Mining Area (BK)
0.5 43.3 – – – 2.4 – – – – – 91.0 137.2
Total (2003) 2140.0 1557 4.5
5145.0 1897.0 1099.4 1404.1 808.4 317.2 201.4 35.6 620.3 350.5 29593. 4
The diagonal elements of the change matrix represent the area of each class which remained unchanged during the 1984 to 2003 period. The data in Table 3 indicates that most significant positive change in land use/ land cover were due to afforestation, as sizable area of moderately dense forest was converted into dense forest (1956.7 ha). In addition, some area of degraded forest was transformed to dense (976.5 ha) or moderately dense (755.5 ha) forest. Further, a significant area of crop land has been brought under settlements (904.4 ha) and plantations (822.6 ha). It can be inferred from the data that there was a significant contribution of degraded land in hills and piedmont plain (585.6 ha), plantation (523.0 ha), barren land along choes (393.3 ha), moderately dense forest (137.9 ha) and degraded forest (67.6 ha) towards increase in the crop land, although, the overall area under crop land has decreased by 3.12% (from 16498.3 ha in 1984 to 15574.5 ha in 2003) as a result of diversion to other uses like settlements and plantations. In addition, some crop land area has degraded due to soil erosion or Choe dissection. In order to assess the impact of land use/land cover changes on meteorological parameters, the
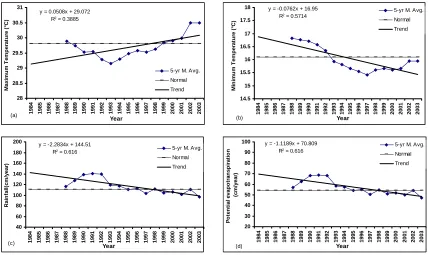
Fig. 4. Trend in 5-yearly moving average of maximum and minimum temperature, rainfall and potential evapotranspiration in the Balachaur watershed,Punjab,India during 1984 to 2003.
Table 4. Decadal variations in maximum (Tmax) and minimum (Tmin) temperatures, rainfall (R) and potential evapotranspiration (PET) in the Balachaur watershed.
Tmax Tmin R PET Decades Avg.
(°C) S.D. (°C) C.V. (%) Avg. (°C) S.D. (°C) C.V. (%) Avg. (cm) S.D. (cm) C.V. (%) Avg. (cm) S.D. (cm) C.V. (%) 1984-93 29.5 0.52 1.8 16.4 0.63 3.8 117.6 38.0 32.3 57.5 18.7 32.6 1994-03 30.0. 0.67 2.2 15.8 0.45 2.9 103.9 32.5 31.3 51.1 15.9 31.2
Difference +0.5 -0.6 -13.7 -6.4
5. Discussion
The land use/land cover change analysis for Balachaur watershed during the period 1984-2003 indicates that the area of crop land, moderately dense forest, degraded forest, degraded land in hills and piedmont plain, and barren land along choes has decreased whereas, the area under settlements, dense forest, plantations, industrial use, ponds, choes, brick kilns and their mining area has increased. The density of vegetation has increased in the Siwalik hills and piedmont areas as a result of afforestation and rejuvenation of forests as well as new plantations in the piedmont plain.
The results have revealed that vegetation cover has increased (Table 3), but the impact of land use/land cover on meteorological variables in the study area did not corroborate the findings from some previous studies conducted under variant situations (Charney and Stone,1975; Charney,1977; Sarma et al,2001), however, these
are in line with the results reported by Ripley (1976).
Micro-level changes in climate in terms of rainfall and temperature variations are known to be related to albedo changes, which in turn could be due to land use/land cover modifications (Sarma et al, 2001). The trend changes in maximum temperature, minimum temperature, rainfall and potential evapotranspiration from the present study revealed that although, vegetation cover has increased but Tmax has also increased while Tmin, R and PET have all decreased. Charney and Stone (1975) in their study in Sahel, North America, Rajputana, Southeastern Pakistan and Northwestern India (both in semi-arid and monsoonal regions) found that a decrease in vegetation cover caused an increase in albedo leading to a continuous flow of latent heat into the atmosphere which resulted in decreased cloud cover and rainfall. Besides, Sarma et al (2001) found that increase in vegetative cover and wetland extent decreased the albedo in the Godavari deltaic region on east coast of India,
y = 0.0508x + 29.072 R2 = 0.3885
28 28.5 29 29.5 30 30.5 31 198 4 198 5 198 6 198 7 198 8 198 9 199 0 199 1 199 2 199 3 199 4 199 5 199 6 199 7 199 8 199 9 200 0 200 1 200 2 200 3 Year Ma xi m u m T e m p e rat u re ( °C )
5-yr M. Avg. Normal Trend
(a)
y = -0.0762x + 16.95 R2 = 0.5714
14.5 15 15.5 16 16.5 17 17.5 18 19 84 19 85 19 86 19 87 19 88 19 89 19 90 19 91 19 92 19 93 19 94 19 95 19 96 19 97 19 98 19 99 20 00 20 01 20 02 20 03 Year M in im u m T e m p er at u re ( °C )
5-yr M. Avg. Normal Trend
(b)
y = -1.1189x + 70.809 R2 = 0.616
20 30 40 50 60 70 80 90 100 198 4 198 5 198 6 198 7 198 8 198 9 199 0 199 1 199 2 199 3 199 4 199 5 199 6 199 7 199 8 199 9 200 0 200 1 200 2 200 3 Year P o te nti a l e v a p otr a ns pi ra ti on (c m /ye ar )
5-yr M. Avg. Normal Trend
(d) y = -2.2834x + 144.51
R2 = 0.616
40 60 80 100 120 140 160 180 200 19 84 19 85 19 86 19 87 19 88 19 89 19 90 19 91 19 92 19 93 19 94 19 95 19 96 19 97 19 98 19 99 20 00 20 01 20 02 20 03 Year R a in fa ll( c m /y ea r)
5-yr M. Avg. Normal Trend
they have taken into account the vegetation effect on albedo, but they have completely ignored its effect on evapotranspiration. Even though vegetated surfaces often absorb more radiation
deforestation might be expected to reduce convection and precipitation instead of an increase as suggested by Sarma et al (2001) and Charney and Stone (1975).
Table 5. Mean daily energy balance data for 4 days (0700 to 1900, local time) for a savanna area in northeastern Uganda in January 1964*.
Area Global radiation
(joule cm-2)
Net radiation (joule cm-2)
Albedo Effective surface temperature (°C)
Grazed savanna 2340 1256 0.20 34.7
Ungrazed savanna 2340 1549 0.15 29.2
*Source: Cited from Ripley (1976)
6. Conclusion
The results showed that land use/land cover changes over time is not the single factor which causes variation in meteorological parameters. In addition, there might be other unknown factors which affect climatic variability in a region, such as CO2 concentrations and its effect on green house gases, atmospheric pollution and spectral distribution of the incoming solar radiation. Changes in chemical composition of the atmosphere could strongly affect the atmospheric heat balance (Starr and Oort 1973). Thus in order to assess climatic variability at micro-level scale, these factors and their interactions may be taken into consideration.
References
Charney, J., 1977. A comparative study of the effects of albedo change on drought in semi-arid regions.J. Atmospheric Sci 34 : 1366-1385.
Charney, J. and Stone, P.H., 1975. Drought in the Sahara- A biogeophysical feedback mechanism. Sci 187:434- 435.
Chaurasia, R., Loshali, D.C., Dhaliwal, S.S., Minakshi, Sharma, P.K., Kudrat, M. and Tiwari, A.K., 1996. Land use change analysis for agricultural management - A case study of Tehsil Talwandi Sabo, Punjab. Ind. J. Remote Sensing, 24 (2) : 115-123.
Dhinwa, P.S., Pathan, S.K., Sastry, S.V.C., Rao, M., Majumdar, K.L., Chotani, M.L., Singh, J.P. and Sinha, R.L.P., 1992. Land use change analysis of Bharatpur district using GIS. Ind. J. Remote Sensing, 20 (4) : 237- 250.
Jayakumar, S. and Arockiasamy, D.I., 2003. Land use/land cover mapping and change detection in part of eastern Ghats of Tamil Nadu using remote sensing and GIS. Ind. J. Remote Sensing, 31 (4):251-260.
Kalany Eugenia, Cai Ming, Li Hong and Tobin Jayakar, 2006. Estimation of the impact of land-surface forcings on temperature trends in eastern United States.J. of Geophysical Research , 111:1-13.
Kumar, M., Mishra, D.K., Diwan, P. and Jawed, M., 2002. Extraction of large scale urban infrastructure information using visual interpretation of high resolution Ikonos data. (Eds.:Navalgund, R.R., Nayak, S.R., Sudarshana,
R., Nagaraja, R. and Ravindran, S.). Proc. International Archives of the Photogrammetry, Remote Sensing and Spatial Information Sciences Symp. held at National Remote Sensing Agency, Hyderabad, India. Vol B, pp: 1168-1170.
Lucas, L.F.J. and Molenaar, M., 1990. Terrain objects, their dynamics and their monitoring by the integration of GIS and remote sensing. IEEE Transactions on Geoscience and Remote Sensing, 33 (3).
Navalgund, R.R., 2002. Earth observation systems for sustainable development : Indian experience. (Eds.: Navalgund, R.R., Nayak, S.R., Sudarshana, R., Nagaraja, R. and Ravindran, S.). Proc. International Archives of the Photogrammetry, Remote Sensing and Spatial Information Sciences Symp. held at National Remote Sensing Agency, Hyderabad, India. Vol B, pp: 1457-1466.
NRSA, 1989. Manual of Nationwide land use/land cover mapping using satellite imagery, part-I, A National Remote Sensing Agency (NRSA), Hyderabad, Publication of 1989.
Ormerod, W. E., 1976. Ecological effect of control of African Trypanosomiasis. Sci 191 : 815-821.
Otterman, J., 1973. Baring high-albedo soils by overgrazing: A hypothesized desertification mechanism. Nature, 242 : 531-533.
Rao, U.R., 1991. Remote sensing for national development. Current Sci., 61 : 121-128.
the Godavari Delta region. J Indian Soc Remote sensing. 29: 85-91.
Sharma, K.D., Singh, S., Singh, N. and Bohra, D.N., 1989. Satellite remote sensing for detecting the temporal changes in the grazing lands. Ind. J. Remote Sensing, 17 (4) :55-59.
Sharma, P.K., Sehgal, J.L., Saggar, S. and Chandi, K.S., (1986). Soils of the kandi area in Punjab and their suitability for land use planning. Ind. J. Soil Sci., 34(1- 4):133-141.