R E S E A R C H A R T I C L E
Open Access
Integrative analyses of proteomics and RNA
transcriptomics implicate mitochondrial
processes, protein folding pathways and
GWAS loci in Parkinson disease
Alexandra Dumitriu
1*†, Javad Golji
2†, Adam T. Labadorf
1, Benbo Gao
2, Thomas G. Beach
3, Richard H. Myers
1,4,
Kenneth A. Longo
2and Jeanne C. Latourelle
1Abstract
Background:Parkinson disease (PD) is a neurodegenerative disease characterized by the accumulation of alpha-synuclein (SNCA) and other proteins in aggregates termed“Lewy Bodies”within neurons. PD has both genetic and environmental risk factors, and while processes leading to aberrant protein aggregation are unknown, past work points to abnormal levels of SNCA and other proteins. Although several genome-wide studies have been performed for PD, these have focused on DNA sequence variants by genome-wide association studies (GWAS) and on RNA levels (microarray transcriptomics), while genome-wide proteomics analysis has been lacking.
Methods:This study employed two state-of-the-art technologies, three-stage Mass Spectrometry Tandem Mass Tag Proteomics (12 PD, 12 controls) and RNA-sequencing transcriptomics (29 PD, 44 controls), evaluated in the context of PD GWAS implicated loci and microarray transcriptomics (19 PD, 24 controls). The technologies applied for this study were performed in a set of overlapping prefrontal cortex (Brodmann area 9) samples obtained from PD patients and sex and age similar neurologically healthy controls.
Results:After appropriate filters, proteomics robustly identified 3558 unique proteins, with 283 of these (7.9 %) significantly different between PD and controls (q-value < 0.05). RNA-sequencing identified 17,580 protein-coding genes, with 1095 of these (6.2 %) significantly different (FDRp-value < 0.05); only 166 of the FDR significant protein-coding genes (0.94 %) were present among the 3558 proteins characterized. Of these 166, eight genes (4.8 %) were significant in both studies, with the same direction of effect. Functional enrichment analysis of the proteomics results strongly supports mitochondrial-related pathways, while comparable analysis of the RNA-sequencing results implicates protein folding pathways and metallothioneins. Ten of the implicated genes or proteins co-localized to GWAS loci. Evidence implicating SNCA was stronger in proteomics than in RNA-sequencing analyses.
Conclusions:We report the largest analysis of proteomics in PD to date, and the first to combine this technology with RNA-sequencing to investigate GWAS implicated loci. Notably, differentially expressed protein-coding genes were more likely to not be characterized in the proteomics analysis, which lessens the ability to compare across platforms.
Combining multiple genome-wide platforms offers novel insights into the pathological processes responsible for this disease by identifying pathways implicated across methodologies.
Keywords:Parkinson disease, RNA-Seq, MS3 proteomics, GWAS loci, Data integration, Metallothioneins, Mitochondria, Protein folding pathways
* Correspondence:[email protected]
†Equal contributors
1
Department of Neurology, Boston University School of Medicine, Boston, MA 02118, USA
Full list of author information is available at the end of the article See related article;http://www.biomedcentral.com/1755-8794/8/70
Background
Parkinson disease (PD) is the second most common neurodegenerative disease after Alzheimer’s disease, with approximately six million cases diagnosed worldwide [1]. PD is characterized clinically by impairment of motor function and cognitive abilities. The main neuropatho-logical hallmarks of PD are protein aggregates termed
“Lewy Bodies”, which are found within neurons and neuronal processes, and contain many proteins, but con-sist primarily of the alpha-synuclein protein (SNCA). Multiple neurotransmitters are implicated in PD, with degeneration of dopaminergic neurons in thesubstantia
nigramost prominently seen. The disease is considered a“complex disorder”resulting from both environmental and genetic factors. Familial monogenic forms of PD have been identified, with the most common of these at-tributed to mutations in the leucine-rich repeat kinase 2 (LRRK2) [2], Parkin (PARK2) [3] and Glucosidase, Beta, Acid (GBA) [4] genes, and with several rare monogenic forms recognized, including rare mutations in the alpha-synuclein gene (SNCA) [1, 5]. Recently, a large meta-genome-wide association study (GWAS) for PD identified twenty-four loci implicated in disease risk [6, 7], although most of the genes responsible for risk at these loci remain unknown. While few environmental factors have been un-equivocally identified for PD [8, 9], the heterogeneity of genetic and environmental factors that contribute to dis-ease etiology makes the understanding of the underlying pathogenic processes difficult to define.
Although protein aggregation is fundamental to PD pathogenesis, and the roles of abnormal protein folding, trafficking and clearance in PD are widely discussed, few studies have sought to investigate disrupted protein levels using genome-wide methods. To our knowledge, the study by Riley et al. [10] is the only past study to perform both RNA-sequencing (RNA-Seq) and proteo-mics (Liquid chromatography tandem-mass spectrom-etry) in brain samples for three PD cases and three controls in the striatum and cortex. That study impli-cated oligodendrocyte function and synaptic vesicle re-lease as disease-related processes, and reinforced the power of genome-wide technologies even for small sam-ple sizes. Thus, while a few high-throughput genome-scale experiments have been performed in the past for PD, including cDNA microarrays [10, 11] and genome-wide association studies (GWAS) [6, 7], the biology of the disease remains poorly understood.
While the concordance of proteomics and RNA tran-scriptomics is known to be weak [12, 13], PD is recog-nized as a protein aggregation disorder; therefore, the analysis of protein levels in PD brain may provide novel insights in the disease pathology. Our primary interest in this study was to assess the role of disrupted protein homeostasis and to compare this characterization to that
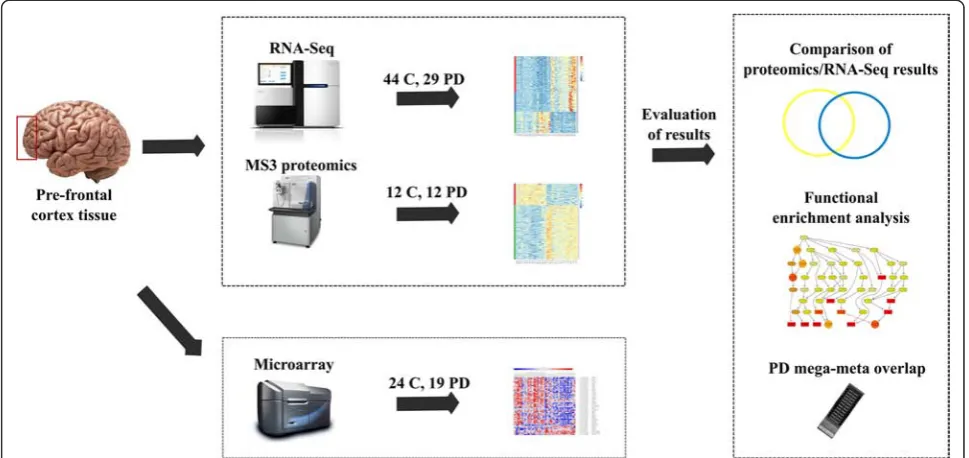
measured by RNA quantification technologies. To this end, we applied two state-of-the-art genome-wide tech-nologies, three-stage Mass Spectrometry Tandem Mass Tag (MS3) Proteomics and RNA-sequencing (RNA-Seq) transcriptomics, which were analyzed together with PD GWAS implicated loci and microarray cDNA tran-scriptomics. The technologies applied for these studies are outlined in Fig. 1 and were performed in a set of overlapping prefrontal cortex samples obtained from male PD patients and sex and age similar neurologically healthy controls.
We first compared the levels of proteins and protein-coding mRNAs between control and PD samples, and then examined both data sources for enriched or com-mon biological signals. The goals of this work were to: 1) assess differences between PD and control brain tis-sue across multiple biological processes using current genome-wide methodologies, 2) compare disease-related changes in protein and mRNA levels observed in over-lapping sets of brain samples, and 3) use the obtained results to aid in interpretation and assessment of prior PD GWAS studies to elucidate the genes that may be re-sponsible for PD risk at the loci implicated by these studies. To our knowledge, no past study has combined these technologies in a series of PD and control brain samples.
Methods
Brain samples
differences between groups and assessed as potential confounders in the analyses.
Processing of samples for proteomics
Prefrontal cortex tissue (50–80 mg) from 12 control and 12 PD samples was homogenized with an ice-cold lysis buffer composed of 8 M urea, 75 mM NaCl, 50 mM Tris, pH 8.2, 1 mM NaF, 1 mM β-glycerophosphate, 1 mM sodium orthovanadate, 10 mM sodium pyrophos-phate, 1 mM PMSF and one tablet of protease inhibitors cocktail per 10 mL. The lysate was centrifuged at 20,000 ×g for 10 min to pellet cellular debris. The
protein content of the supernatant was measured using the BCA assay. Protein disulfide bonds were reduced with DTT, and cysteine residues were alkylated with iodoacetamide as previously described [15]. The protein lysates were subjected to a methanol-chloroform precipi-tation, and then digested overnight with Lys-C (Wako) at a 1/100 enzyme/protein ratio in a buffer comprised of 4 M urea and 50 mM Tris–HCl, pH 8.8. The digest was acidified with formic acid to a final pH of ~2–3, and subjected to C18 solid-phase extraction (Sep-Pak,
Wa-ters). Isobaric labeling of the peptides was accomplished by dissolving 0.8 mg of 6-plex TMT reagents (Thermo
Table 1Summary statistics for brain samples
Analysis Description Control PD t-test p
RNA-Seq Number of samples 44 29
-Age at death, years (range) 70.00 (46–97) 77.55 (64–95) 4.6E-3
PMI, hours (range) 14.36 (2–32) 11.14 (1–31) 0.170
RIN (range) 7.85 (6.0-9.1) 7.07 (5.8-8.5) 5.9E-5
Proteomicsa Number of samples 12 12
-Age at death, years (range) 79.50 (61–97) 76.83 (64–88) 0.539
PMI, hours (range) 5.66 (2–18) 4.16 (2–11) 0.455
Microarray Number of samples 24 19
-Age at death, years (range) 74.75 (58–97) 79.57 (64–94) 0.123
PMI, hours (range) 13.08 (2–26) 7.57 (2–31) 3.9E-2
a
All samples studied by proteomics have both RNA-sequencing and microarray transcriptomics
Scientific) in 40μL acetonitrile, and adding 10μL of this solution to 100 μg of peptides dissolved in 100 μL of 50 mM HEPES, pH 8.5. These samples were fractionated using strong cation exchange chromatography [15], and the fractions were analyzed by liquid chromatography-MS3 on an LTQ Orbitrap Velos mass spectrometer, as previously described [16]. Each of the four 6-plex proteo-mics experiments included 3 PD and 3 control samples. The sample processing and data generation for the proteo-mics experiment were performed by the Gygi Lab (https:// gygi.med.harvard.edu/), at Harvard Medical School.
Database correlation and statistical analysis of proteomic data
All MS/MS and MS/MS/MS spectra were searched against the human IPI database (Version 3.87) from the European Bioinformatics Institute by using the SEQUEST algorithm [17]. Modifications were permitted to allow for the detection of oxidized Met (+16), carboxyamidomethy-lated Cys (+57), and phosphorycarboxyamidomethy-lated Ser, Thr and Tyr (+80). All peptide matches were initially filtered based on Xcorr and dcorr scores [15]. A total of 6569 proteins de-scribed by IPI IDs were identified in at least one of the 6-plex experiments, with 3600 proteins common to all four 6-plex experiments; only these common 3600 proteins were considered for downstream analyses. After removing the proteins corresponding to IPI IDs that could not be mapped to a proper official gene symbol (4 instances) and averaging the abundance values for proteins with IPI IDs corresponding to the same gene symbol (35 instances), a number of 3558 unique genes were included in the ana-lysis of the proteomics experiment. The mapping of IPI IDs to official gene symbols was performed in April 2014.
The normalization and statistical analysis of the prote-omics data were implemented in R. Two steps were used to normalize the raw data: 1) an intra-experimental (within plex) variation step – for each sample, each pro-tein’s raw signal was normalized to the total ion intensity of the protein within the plex, and 2) an inter-experimental (across plexes) variation step–for each sample, each pro-tein’s normalized value from step 1) was transformed by dividing it to the mean of all normalized values of the pro-tein obtained in step 1) of all 24 samples. The Surrogate Variable Analysis (SVA) method implemented in the sva R package [18] (v3.10.0) was used to eliminate latent noise in the data not explained by the categorical factors, including batch effects, by building a set of covariates constructed directly from the proteomics dataset. Three significant sur-rogate variables (SVs) were identified for the proteomics data (shown in Additional file 1: Table S1). The limma R package [19] was used for statistical analysis of differential abundance, using a linear model fit including the 3 SVs for the contrast between the PD and the control groups. The p-values were adjusted for multiple comparisons using the
q-value method [20]; a gene was considered to be signifi-cantly different between PD and control samples if it had an adjusted q-value < 0.05. For the full set of differential protein abundance results, see Additional file 2: Table S2.
RNA extraction
RNA tissue (10–20 mg) for each brain sample included in the sequencing study was homogenized in TRIzol (Invi-trogen, Carlsbad, CA). Total RNA was isolated using the Qiagen RNeasy Mini Kit (Qiagen Sciences Inc., German-town, MD) and further purified using Agencourt RNA Clean magnetic beads (Beckman Coulter, Inc.). The quan-tity and purity of the RNA was determined by absorbance at 260 nm and by 260/280 absorbance ratio, respectively. Each of the total RNA preparations was individually assessed for RNA quality based on the 28S/18S ratio and the RNA integrity number (RIN) was measured on an Agilent 2100 Bioanalyzer system using the RNA 6000 Nano LabChip Kit (Agilent, Foster City, CA).
RNA-Seq library preparation and sequencing
For each brain sample, 1μg RNA was used to construct sequencing libraries using Illumina’s TruSeq RNA Sam-ple Prep Kit. The unmodified manufacturer protocol was followed: mRNA molecules were polyA selected, chem-ically fragmented, randomly primed with hexamers, syn-thesized into cDNA, 3′ end-repaired and adenylated, sequencing adapter ligated and PCR amplified. Each adapter-ligated library contained one of twelve TruSeq molecular barcodes. Multiplexed samples were equimo-larly pooled into sets of 3 samples per flowcell lane and se-quenced using 2x101 ntd paired-end runs on Illumina’s HiSeq 2000 system at the Tufts University sequencing core facility (http://tucf-genomics.tufts.edu/). Demulti-plexing and FASTQ file generation (raw sequence read plus quality information in Phred format) were accom-plished using Illumina’s Consensus Assessment of Se-quence and Variation (CASAVA) pipeline.
RNA-Seq data processing
mRNA gene abundance estimation
Gene expression quantification was performed using htseq-count version 0.5.3p9 (http://www-huber.embl.de/users/an-ders/HTSeq/doc/count.html), the GENCODE version 17 annotation gtf file (http://www.gencodegenes.org/releases), and the alignment BAM files. The intersection_nonempty mode and the unstranded library type (−−stranded = no op-tion) were specified as parameters for the htseq-count run, with all other options left as default.
Gene differential expression analysis using DESeq2 For the PD/control differential expression evaluation, we considered the 20,331 protein-coding genes from the GENCODE annotation file. The R (https://www.r-pro-ject.org/) package DESeq2 version 1.4.0 [23, 24] was used to perform the differential expression analysis. First, a low-count filter was applied to the protein-coding genes, removing those with 0 counts in more than 50 % of the PD or more than 50 % of the control samples. 17,580 genes passed this filtering criterion. For the differential expression analysis in DESeq2, the in-structions from the package vignette were followed. First, a DESeqDataSet object was constructed including as covariates age at death, post-mortem interval (PMI) and binned RNA Integrity Number (two categories: RIN < =7 or >7). The DESeq wrapper was run with default options, and the results function was run specifying independentFiltering = F as an option. The significant genes were considered to be those with a False Discovery Rate (FDR)-adjusted p-value below 0.05, using the pro-cedure of Benjamini and Hochberg [24]. The official symbols of the protein-coding genes were last updated in April 2014, using a custom Matlab script.
For the full set of differential mRNA abundance re-sults, see Additional file 3: Table S3. For a set of genes/ proteins with common signal in the RNA-Seq and prote-omics experiments (multiple comparison corrected sig-nificance in one of the two experiments and nominal significance in the other), see Additional file 4: Table S4.
Microarray analysis
Nineteen PD and 24 control samples from the ones in-cluded in the RNA-Seq study were previously studied as part of an Agilent microarray analysis (44 K One-Color Agilent 60-mer Whole Human Genome Microarray) performed by our investigators [11]. We ran a PD/con-trol differential expression analysis for the microarray data of these 43 samples, following the same protocol described previously [11], with the exception that RIN was binned into two categories, RIN < =7 or >7 (see Additional file 5: Table S5 for results). This analysis change was made to match the analysis from the RNA-Seq study.
GO and MSigDB enrichment calculation
Enrichment analyses were implemented using the Gene Ontology (GO) annotation database [25] and the Mo-lecular Signatures Database (MSigDB v4.0) [26]. Only the “C2 Canonical Pathways” gene sets were used from the MSigDB database (http://www.broadinstitute.org/ gsea/msigdb/index.jsp). To insure that gene sets derived from the strongest implicated genes were not diluted by more weakly implicated genes, we performed enrich-ment analysis on the top 25 genes, then on the top 50, 100, 350, 600, 850, and 1095 genes obtained from the RNA-Seq analysis and on the top 25, 50, 100, and 283 proteins obtained from the proteomics analysis. GO term enrichment was performed using topGO [27], with the “weight01” algorithm and the “fisher” statistic, after having removed GO terms with less than 10 annotated genes (“nodeSize = 10”). All analyzed RNA-Seq genes and all analyzed proteomics genes were utilized as the background for their respective analyses. Custom scripts in the R statistical environment (http://www.r-projec-t.org/) were created to run the analysis. Enrichment of MSigDB Canonical Pathways gene lists was performed with custom R scripts using the “fisher.test” and “ p.ad-just” routines. Further processing of enrichment results was performed using custom scripts to generate plots in python with matplotlib [28], ipython notebook [29], and pandas [30].
An identical approach was implemented for the func-tional enrichment analysis of the 77 genes/proteins with multiple comparison corrected significance in one of the two experiments and nominal significance in the other experiment. For the full set of enrichment analysis re-sults, see Additional file 6: Table S6.
PD Mega-Meta GWAS Genes
551 SNPs were found as genome-wide significant (p< 5E-8) in a recent mega-meta analysis of PD genome-wide association studies [7]. We defined SNPs in a range of 100 kb of a gene to be within the primary regulatory region of the gene, in which 98 % of cis-acting eQTLs are likely to occur [31]. Using this criterion, we used Annovar [32] for the annotation of 166 genes identified as potentially under the regulatory control of these 551 genome-wide significant SNPs. These 166 genes were evaluated in terms of differential RNA or protein abun-dance in our study (see Table 2 and Additional file 7: Table S7).
Results
Proteomics study
proteins were significantly different between PD and control samples after adjustment for multiple compari-sons (q-value < 0.05), with 106 of these proteins (37.5 %) showing increased levels and 177 showing decreased levels in PD brain compared to control brain (see Fig. 2 and Additional file 2: Table S2 for details).
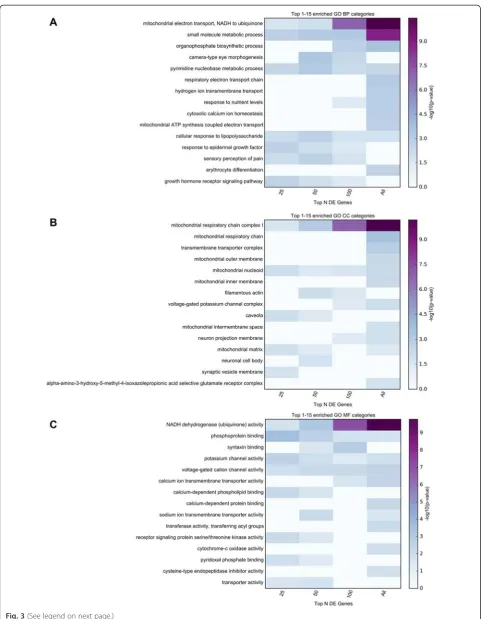
Functional enrichment analyses were implemented using GO categories and Broad Institute’s Molecular Sig-nature Database (MSigDB) canonical pathways. To insure that functional sets derived from the strongest implicated proteomics genes were not diluted by more weakly implicated genes, the enrichment was performed for all 283 significant proteomics genes, as well as for subsets of these genes (e.g. top 25, 50, 100 genes). Top enrichment results are visualized in Figs. 3 and 4. De-tailed enrichment results for all GO terms and MSigDB canonical pathways significant for any of the used sub-sets of significant genes are available in Additional file 6: Table S6.
The top Biological Processes category was “ mitochon-drial electron transport, NADH to ubiquinone” (p= 3.53E-11), the top Cellular Component category was
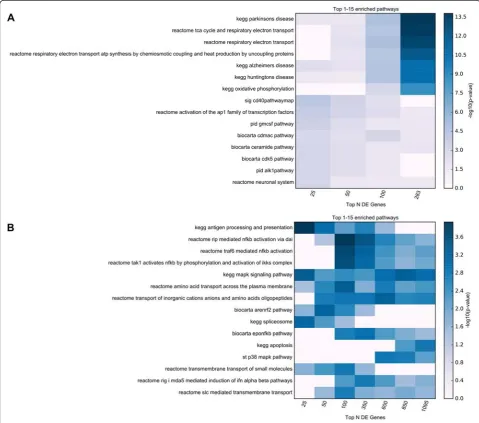
“mitochondrial respiratory chain complex I” (p= 6.39E-11), and the top Molecular Function category was“NADH dehydrogenase (ubiquinone) activity” (p= 1.63E-10). Similarly, the top MSigDB Canonical Pathway was
“REACTOME RESPIRATORY ELECTRON TRANS-PORT”. These findings provide consistent and compelling
evidence that an agnostic assessment of genome-wide pro-teomics analysis strongly supports impaired mitochondrial function as fundamental to PD pathogenesis.
mRNA sequencing study
Differentially abundant protein-coding genes
We compared the mRNA abundance of 17,580 protein-coding genes (passing a low-count filter) of 29 PD to 44 control prefrontal cortex samples (see Table 1 for sample description). A total of 1095 genes (6.2 %) were identi-fied with significantly different mRNA levels at FDR p -values < 0.05, with 570 of these genes (52.1 %) showing increased RNA level in PD compared with controls (Fig. 2 and Additional file 3: Table S3).
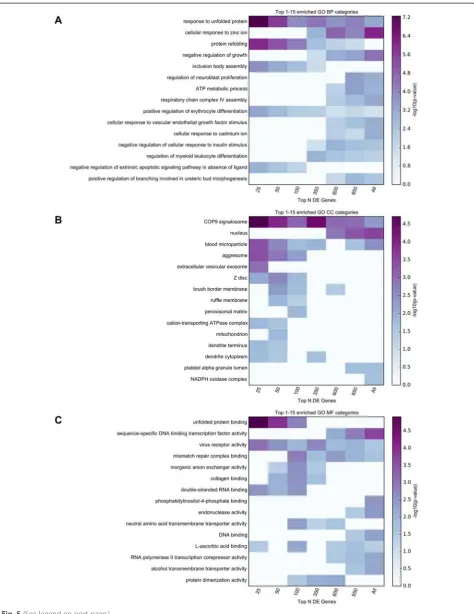
Functional enrichment analyses were performed in a similar manner to those described for the proteomics re-sults, both for the full set of FDR-significant genes, as well as for subsets of these genes at increasingly stricter gene-sample cutoffs (e.g. top 25, 50, 100, 350, 600, 850 genes). The top 15 MSigDB canonical pathways, and the top 15 enriched terms for each GO set used (Biological Processes, Cellular Components, and Molecular Func-tions) identified using any of the considered subsets from the FDR-significant genes are displayed in Figs. 4 and 5. Detailed enrichment results are available in Additional file 6: Table S6.
Both the top Biological Processes category “response to unfolded protein” and the top Molecular Function
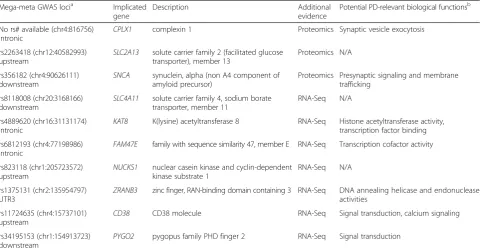
Table 2Significant genes with evidence from GWAS analysis Mega-meta GWAS locia Implicated
gene
Description Additional
evidence
Potential PD-relevant biological functionsb
No rs# available (chr4:816756) intronic
CPLX1 complexin 1 Proteomics Synaptic vesicle exocytosis
rs2263418 (chr12:40582993)
upstream SLC2A13
solute carrier family 2 (facilitated glucose transporter), member 13
Proteomics N/A
rs356182 (chr4:90626111) downstream
SNCA synuclein, alpha (non A4 component of amyloid precursor)
Proteomics Presynaptic signaling and membrane trafficking
rs8118008 (chr20:3168166)
downstream SLC4A11
solute carrier family 4, sodium borate transporter, member 11
RNA-Seq N/A
rs4889620 (chr16:31131174) intronic
KAT8 K(lysine) acetyltransferase 8 RNA-Seq Histone acetyltransferase activity, transcription factor binding
rs6812193 (chr4:77198986)
intronic FAM47E
family with sequence similarity 47, member E RNA-Seq Transcription cofactor activity
rs823118 (chr1:205723572) upstream
NUCKS1 nuclear casein kinase and cyclin-dependent kinase substrate 1
RNA-Seq N/A
rs1375131 (chr2:135954797)
UTR3 ZRANB3
zinc finger, RAN-binding domain containing 3 RNA-Seq DNA annealing helicase and endonuclease activities
rs11724635 (chr4:15737101) upstream
CD38 CD38 molecule RNA-Seq Signal transduction, calcium signaling
rs34195153 (chr1:154913723)
downstream PYGO2
pygopus family PHD finger 2 RNA-Seq Signal transduction
a
Since some genes have multiple SNPs within 100 kb of their start and end sites showing association to PD status at p-values < 5E-8 [7], only the SNP with the lowest p-value is shown for each implicated gene. SNP coordinates are based on the hg19 (GRCh37.p13) human reference. SNP annotations: downstream/outstream = outside the gene boundaries, within 100 kb from the start or end site of the gene, intronic = located in the gene intron, UTR3 = located in the 3′-UTR of the gene
b
category “unfolded protein binding” implicate responses to abnormal protein structure, which, although not seen in the proteomics analysis, is not surprising given the abnormal protein aggregation seen in PD. The top Cel-lular Components category “COP9 signalosome” (CSN) has not been previously implicated in PD. The CSN is a conserved multiprotein complex, which mainly functions in the control of proteolysis [33]. The CSN has also been implicated in the control of NF-kappaB in innate
immunity, as well as T-cell activation and maturation. Similar to the Cellular Components result above, the MSigDB implicates the “KEGG ANTIGEN PROCESS-ING AND PRESENTATION” and “REACTOME RIP MEDIATED NFKB ACTIVATION VIA DAI”, providing support for a role of inflammation in PD. In addition, seven metallothionein genes out of 19 present in the gene family showed significantly increased abundance in PD relative to control samples.
Overlap of RNA-Seq and proteomics analyses
A set of 3520 genes was common between the 17,580 protein-coding genes derived from the RNA-Seq study and the 3558 unique proteins derived from the MS3 proteomics study. However, of the 1095 FDR-significant genes from the RNA-Seq analysis, only 166 were
available in the proteomics dataset, while out of the 283 significantly differentially abundant proteins (q-value < 0.05), one was missing from the RNA-Seq dataset (see Fig. 2, panel c).
Given the different rate of detection in the proteomics study for the RNA-Seq FDR significant genes (where
(See figure on previous page.)
Fig. 3TopGO enrichment analysis results for the proteomics study. Functional enrichment analysis was performed for 4 subsets of the significant results obtained in the MS3 proteomics study (top 25, 50, 100, all 283 genes with multiple comparison corrected significance). The top 15 enriched GO terms belonging to GO Biological Processes (BP), GO Cellular Components (CC), and GO Molecular Functions (MF) are displayed in panelsa,b, andc, respectively. The presented top results are those with the smallest p-values in any of the subsets of genes used. The top category for each process implicates mitochondrial function as impaired in PD. DE = differentially expressed
only 15.1 % were characterized by MS3 proteomics) compared to the remaining genes (where 20.2 % were characterized by MS3 proteomics), we asked whether or not there was an observed difference in terms of direc-tion of effect between the 166 RNA-Seq FDR significant genes detected via proteomics compared to the remaining 929 undetected via proteomics. Interestingly, the genes with increased expression in PD compared to control at FDR-level of significance were more likely than expected by chance to be undetected in the proteomics study. This result was highly significant (χ2= 33.68, p= 1E-8), with 52/166 (31.3 %) genes detected by proteomics showing increased expression in PD, compared with 518/929 (55.7 %) genes not detected by proteomics showing in-creased expression in PD. This result could indicate a po-tential post-transcriptional regulatory mechanism that prevents protein translation for specific highly expressed mRNAs involved in disease-related processes. This poten-tial mechanism might also be one reason for the limited overlap between the proteomics and the RNA-Seq mea-surements, which restricts the analysis of overlapping pathways between the two studies.
When comparing the genes significant after adjust-ment for multiple comparisons from the two datasets, only ten of them were identified by both analyses, with eight showing the same direction of effect (these ten genes are displayed in Fig. 2, panel d). However, among the 283 genes with q-value < 0.05 in the proteomics ana-lysis, 56 were observed to also have nominal significance in the mRNA analysis, and 38 of these also had the same direction of effect. Among the 166 proteins present in the 1095 FDR-significant RNA-Seq genes, 31 had nom-inal significance, and 21 of these also had the same dir-ection of effect. In total, 77 unique genes showed evidence for PD involvement from both the gene ex-pression and the protein abundance experiments (see Additional file 4: Table S4 for details). As these genes may be of particular interest in functional studies of PD, we performed functional enrichment for them (Additional file 6: Table S6, tabs “Common Genes GO” and“Common Genes MSigDB CP”). The Cellular Com-ponent term “neuron projection membrane” (p= 0.0019) is the strongest category identified in this ana-lysis, with the Biological Process category “superoxide metabolic process” (p= 0.0036) and the Molecular Function category “protein N-terminus binding” (p= 0.0046) among the top findings.
To assess the relationship between RNA expression dysregulation and relative protein abundance, the results for the mRNAs and for the proteins were compared for the 3520 common genes. Weak, but significant correl-ation for fold changes (Spearman rank correlcorrel-ation: r= 0.075,p= 7.4E-6) was observed. The correlation for fold changes increased when examining the sets of significant genes after adjustment for multiple comparisons from the RNA-Seq study (N= 166, Spearman rank correlation:
r= 0.185, p= 0.016) or from the proteomics study (N= 282, Spearman rank correlation:r= 0.142,p= 0.016).
To further evaluate the relationship between mRNA and protein abundance in the 24 samples with common data, we looked at the differences in terms of absolute correlation values between protein/mRNA abundance for all common genes as opposed to 1) the 77 common genes with joint evidence from the full RNA-Seq and the proteomics studies (“AND evidence genes”, with mul-tiple comparison corrected significance in one study and nominal significance in the other) and 2) the 438 com-mon genes with evidence from either the full RNA-Seq study or the proteomics study (“OR evidence genes”, with multiple comparison corrected significance in ei-ther study). While ei-there was no significant difference be-tween the absolute correlation values of all genes and those belonging to the “OR evidence genes” (t-test p -value = 0.18), there was a significant difference between the absolute correlation values of all genes and those be-longing to the “AND evidence genes” (t-test p-value = 9.3E-6, Fig. 6).
Application to PD GWAS gene-discovery
Identifying the specific genes responsible for risk at GWAS loci is often difficult, as the regions where SNPs show significant levels of statistical association can span multiple genes and the gene closest to the SNP with strongest p-value is not necessarily the one responsible for association. Thus, an important goal of this project was to provide a resource for the evaluation and prioritization of results from other PD-related high-throughput studies, such as genetic variants from genome-wide association (GWA) studies. The recent mega-meta analysis of PD GWA studies [7] identified over 500 genetic variants in 24 loci (see Methods, PD Mega-Meta GWAS Genes). Using the criterion of genes within 100 kb of a GWAS SNP, within which 98 % ofcis-acting eQTLs with primary regulatory effects are likely to occur [31], 166
(See figure on previous page.)
Fig. 5TopGO enrichment analysis results for the RNA-Seq study. Functional enrichment analysis was performed for 7 subsets of the FDR-significant genes obtained in the RNA-Seq study (top 25, 50, 100, 350, 600, 850, all 1095 genes with multiple comparison corrected significance). The top 15 enriched GO terms belonging to GO Biological Processes (BP), GO Cellular Components (CC), and GO Molecular Functions (MF) are displayed in panels
genes were identified (Additional file 7: Table S7). Ten of these genes, displayed in Table 2, were present among our study’s significant RNA-Seq (FDRp< 0.05) or proteomics (q-value < 0.05) results.
Notably, SNCA showed significantly increased protein levels in the proteomics analysis, but did not show al-tered RNA levels in the RNA-sequencing analysis. This finding supports the view that SNCA protein levels are altered in PD, and this observation may contribute to its accumulation in Lewy bodies.
Comparison of RNA-Seq and microarray abundance analysis results
Data available from a cDNA Agilent microarray study recently performed by our group to compare gene ex-pression levels of 27 PD to 26 control prefrontal cortex samples [11] offered a medium to validate the RNA-Seq results using an alternative technology. 895 of the genes included in the microarray analysis overlapped with the 1095 FDR-significant genes from the RNA-Seq study.
For these genes, significant correlation of fold changes was observed (Spearman rank correlation:r= 0.490,p< 2.2E-16), with 702 genes (78.43 %) showing the same direction of effect between the two studies. 232 of the 702 genes (33.04 %) also had nominal significance.
Given that a subset of 24 controls and 19 PD samples assayed in the RNA-Seq study were also evaluated in the microarray study [11], we could perform a more direct comparison of differential abundance results obtained across the two technologies (see Methods, Microarray Analysis). Although the RNA for the 43 commonly stud-ied brain samples came from different tissue extractions, both studies were performed in the prefrontal cortex (Brodmann Area 9). For these samples, there were 14,115 protein-coding genes commonly analyzed; among these genes, 80 reached FDR-level of significance in the RNA-Seq analysis. The differential abundance results ob-tained for the two studies showed significant, albeit low correlation with regard to fold change (Spearman rank cor-relation: r= 0.188, p< 2.2E-16). However, the correlation
for fold changes was stronger when only the 80 protein-coding genes with FDR p< 0.05 in the RNA-Seq analysis were considered (Spearman rank correlation:r= 0.471,p= 3.6E-8). While only 9 of these 80 genes (11.25 %) had nom-inal significance in the microarray, 62 (77.5 %) showed a consistent direction of effect.
Discussion
While the pathological hallmark of PD is the accumula-tion of alpha-synuclein (SNCA) and other proteins in Lewy Bodies, past genome-wide studies have focused on GWAS analyses of DNA sequence variants and RNA transcriptomics by microarray. We believe this is the first investigation of PD brain samples which involves genome-wide analyses for (1) MS3 proteomics, (2) RNA-sequencing transcriptomics, (3) PD GWAS implicated loci, and (4) microarray transcriptomics. All samples studied by proteomics were also studied by RNA-Seq and expression microarrays, and all samples were Brod-mann 9 prefrontal cortex.
MS3 proteomics identified 3558 unique proteins, while RNA-sequencing identified 17,580 protein-coding genes and 3520 of these were in common between the two platforms. While 283 proteins and 1095 mRNAs were significantly different between PD and controls after ad-justment for multiple comparisons, only eight genes were in common and with the same direction of effect between these two sets of top results.
Our analyses revealed evidence implicating a large number of genes, proteins, and biological networks, in-cluding many previously reported in PD, as well as some not previously appreciated for this disease. Among the differentially abundant proteins with prior evidence for PD involvement were SNCA (Synuclein, Alpha (Non A4 Component Of Amyloid Precursor); increased in PD) [34, 35], GAD1 (glutamate decarboxylase 1 (brain, 67 kDa); decreased in PD) [36], and NPTX2 (neuronal pentraxin II; decreased in PD) [37]. Functional enrichment analyses of the proteomics results (Additional file 6: Table S6) strongly support the involvement of mitochondrial-related pathways, as has been previously suggested [10, 38, 39], justifying renewed attention to this area of investigation for PD. Other top enriched biological pathways for the proteomics data point towards neurodegenerative diseases (“KEGG PARKINSONS DISEASE”; “KEGG ALZHEI-MERS DISEASE”; “KEGG HUNTINGTONS DISEASE”), suggesting that pathological processes seen in PD may overlap with those seen in other neurodegenerative dis-eases involving aberrant protein aggregation. Evidence for overlap across multiple neurodegenerative diseases is seen much more strongly in the proteomics analysis than in the RNA-Seq analysis described below, suggesting that proteomics analysis may offer important insights for con-trasts across neurodegenerative diseases.
The 1095 genes with FDR-level of significance in the RNA-Seq analysis included several previously associated with PD, such asSMOX(spermine oxidase; increased in PD) [11], SPR (sepiapterin reductase (7,8-dihydrobiop-terin:NADP+ oxidoreductase); increased in PD) [40],
DRD3 (dopamine receptor D3; decreased in PD) [41], and SYT11 (Synaptotagmin XI; decreased in PD) [42]. Concordant with prior studies describing dysregulation of metallothioneins in PD [10, 43], we observed seven metallothionein genes out of the 19 present in this gene family (http://www.genenames.org/cgi-bin/genefamilies/ set/638) showing significantly increased abundance in PD samples compared with controls (MT1A, MT1E,
MT1F,MT1G,MT1M,MT1X,MT2A; See Additional file 3: Table S3). While the number of genes precludes dis-cussion of all of them, it is worth noting that metal-lothioneins may have neuroprotective properties [44] and protect against oxidative stress [45].
For the functional enrichment analyses of RNA-Seq results, the top GO terms include protein folding (GO:0006986,“response to unfolded protein”; GO:0042026,
“protein refolding”; GO:0051082, “unfolded protein bind-ing”), cellular response to metal ions (GO:0071294,“cellular response to zinc ion”; GO:0071276, “cellular response to cadmium ion”), mitochondrial processes (GO:0046034,
“ATP metabolic process”; GO:0008535, “respiratory chain complex IV assembly”), and the ubiquitin conjugation path-way (GO:0008180, “COP9 signalosome”). In addition, the enriched MSigDB canonical pathways strongly support pro-cesses and pathways related to immune function (“ REAC-TOME RIP MEDIATED NFKB ACTIVATION VIA DAI”;
“KEGG ANTIGEN PROCESSING AND PRESENTA-TION”; “KEGG MAPK SIGNALING PATHWAY”; See Additional file 6: Table S6), which were not prominent in the proteomics analysis. Given that considerable recent work points to the involvement of neuroinflammatory re-sponse in PD [46–48], our findings substantiate that MS3 proteomics and RNA-sequencing provide differing insights for PD.
Analyses comparing the 895 genes included in our previously published microarray analysis [11] that over-lapped with the 1095 FDR-significant genes from the RNA-Seq study revealed a significant correlation of fold changes (p< 2.2E-16). Of these genes, 702 (78.43 %) showed the same direction of effect between the two studies, indicating that the majority of genes implicated by RNA-Seq show fold-change concordance by micro-array technology.
GO:0034162, “toll-like receptor 9 signaling pathway”;
“BIOCARTA FMLP PATHWAY”;“BIOCARTA CDMAC PATHWAY”), regulation of gene expression (“BIOCARTA PPARA PATHWAY”), brain-related processes (“ REAC-TOME NEUROTRANSMITTER RELEASE CYCLE”), and cell-membrane transport (GO:0035725, sodium ion transmembrane transport”). Enrichment of similar path-way categories to those described above were observed when the 77 genes with joint evidence for the RNA-Seq and proteomics analyses were investigated (Additional file 6: Table S6,“Common Genes GO” and“Common Genes MSigDB CP”tabs).
We observed a significant increase in protein/mRNA correlation for genes with signal at both the mRNA and protein levels, albeit the association was modest (mean Pearson correlation values = 0.25) (Fig. 6). Given that prior studies have reported protein and mRNA levels to be weakly correlated, even in large datasets [49], the ab-sence of strong correspondence between RNA-Seq and MS3 proteomics analyses may be a consequence of the complexity of the mRNA-to-protein signal conversion. RNA-Seq evaluates not only the subset of mRNAs meant for translation, but also mRNAs that are still in the nu-cleus, mRNAs processed for storage, and mRNAs targeted for degradation. Additionally, while protein abundance levels are influenced by their corresponding mRNA levels, they are also a product of translational and post-translational mechanisms [50], which may fur-ther limit the relationship between these two molecules.
Since detection biases for specific types of protein classes are known to exist when protein abundance is measured via proteomics methods [51], we used the 24 samples profiled in the proteomics study to investigate if the mRNA abundance levels of the proteins character-ized by MS3 proteomics were different than the mRNA abundance levels of all genes quantified by RNA-Seq analysis. Interestingly, the mRNAs corresponding to pro-teins detected in the proteomics study showed signifi-cantly increased levels when compared to mRNA levels for all protein-coding genes in the RNA-Seq study (t-test
p-value < 2.2E-16, see Fig. 6). This finding suggests a de-tection bias towards proteins encoded by genes with highly abundant mRNAs, implying that the RNA-Seq method might have a larger dynamic range of detection than the MS3 proteomics method in human brain tissue. Although twenty-four PD risk loci have been identified by GWAS studies, the genes responsible for risk at these loci are generally unknown. We overlapped our MS3 proteomics and RNA-Seq top results with loci from a re-cent mega-meta GWAS analysis by Nalls et al. [7]. Util-izing all SNPs with genome-wide significant p-values identified in the Nalls study, we mapped genes posi-tioned within 100 kb of these SNPs. Using this criterion, 166 genes were identified as positioned near a
GWAS-implicated SNP (Additional file 7: Table S7). Ten of these genes showed overlap with the RNA-Seq or prote-omics genes with multiple comparison corrected signifi-cance (see Table 2). Notably, the SNCA protein is identified as increased in PD by the MS3 proteomics analysis, suggesting that proteomic analysis may lend in-sights into identifying the risk associated genes at GWAS implicated loci.
The correspondence between protein and mRNA levels defined by proteomics and RNA-sequencing has traditionally been found to be weak, as has been re-ported in previous work [52]. Indeed, our study did not find strong concordance between differentially abundant protein-coding mRNAs (contrast between 29 PD and 44 control samples) and proteins (contrast between 12 PD and 12 control samples) in prefrontal cortex tissue, with only eight genes present in both studies with multiple comparison corrected significance and same direction of effect. This observation can be attributed to a combin-ation of factors, including: 1) the different number of samples analyzed in the two studies, 2) the approximate five-fold size difference between the genes/proteins with robust signals captured via RNA-Seq and MS3 proteo-mics techniques, and 3) the detection bias observed for the proteomics technique for proteins with higher mRNA abundance. Although the correspondence between MS3 proteomics-derived protein levels and RNA-Seq-derived RNA levels appears low, these initial attempts at resolving the discrepancies among these platforms offer some novel insights into the pathogenesis of PD.
These are consequences of the fact that human brain tis-sue with high quality RNA is not easily accessible, espe-cially from neurologically healthy control samples. A final limitation is the omission of non-coding RNAs, which have yielded intriguing findings in previous stud-ies [55]. Because the purpose of this study was to inte-grate a differential analysis of proteomics data with RNA-sequencing data, we focused exclusively on the analysis of protein-coding genes. However, the analysis of other RNA biotypes represents a logical next step.
The RNA-Seq and proteomics results made publicly available through this study (GEO: GSE68719) are a valuable resource for the evaluation of existing and fu-ture high-throughput studies in PD.
Conclusions
We report the largest analysis of proteomics in PD to date, and the first to combine this technology with both RNA-sequencing and GWAS implicated loci. Combining multiple genome-wide platforms offers novel insights into the pathological processes responsible for this disease by identifying pathways implicated across methodologies. Functional enrichment analysis of the proteomics results strongly supports mitochondrial-related pathways, while comparable RNA-sequence analysis implicated protein folding pathways and metallothioneins. Ten of the impli-cated genes or proteins co-localized to GWAS loci. Evi-dence implicating SNCA was stronger in proteomics than in RNA-sequencing analyses.
Our studies emphasize the importance for continuing to expand the numbers of proteins that can be studied by MS3 and related developing technologies for genome-wide proteomics analysis. In addition, as the quantification for larger numbers of specific protein isoforms expands, it is important to expand upon methods to assess the rela-tionship of specific RNA transcripts to specific protein isoforms.
Additional files
Additional file 1: Table S1.Detailed information for the entire set of 29 PD cases and 44 controls studied by MS3 proteomics, RNA-Seq, and expression microarray. (XLSX 59 kb)
Additional file 2: Table S2.Results for the protein abundance comparison between 12 PD and 12 control samples for the 3558 proteins from the MS3 proteomics study. (XLSX 336 kb)
Additional file 3: Table S3.Results for the mRNA abundance comparison between 29 PD and 44 control samples for the 17,580 protein-coding genes from the RNA-Seq study. (XLSX 2337 kb)
Additional file 4: Table S4.Proteomics and RNA-Seq results for the 77 genes/proteins with common evidence (multiple comparison corrected significance in one of the experiments and nominal significance in the other). (XLSX 58 kb)
Additional file 5: Table S5.Results for the mRNA abundance comparison between 19 PD and 24 control samples present in the
microarray expression dataset E-MTAB-812 from ArrayExpress and also included in the RNA-Seq study. (XLSX 3194 kb)
Additional file 6: Table S6.This file contains ten tables: (1) Proteomics GO BP: GO Biological Pathways that showed an enrichment p-value smaller than 0.05 in any of the performed analyses for the proteomics results (using the top 25, 50, 100, or 283 genes with multiple comparison corrected significance); (2) Proteomics GO CC: GO Cellular Components that showed an enrichment p-value smaller than 0.05 in any of the performed analyses for the proteomics results; (3) Proteomics GO MF: GO Molecular Functions that showed an enrichment p-value smaller than 0.05 in any of the performed analyses for the proteomics results; (4) Proteomics MSigDB CP: MSigDB Canonical Pathways that showed an enrichment p-value smaller than 0.05 in any of the performed analyses for the proteomics results; (5) RNA-Seq GO BP: GO Biological Pathways that showed an enrichment p-value smaller than 0.05 in any of the performed analyses for the RNA-Seq results (using the top 25, 50, 100, 350, 600, 850, or 1095 genes with multiple comparison corrected significance); (6) RNA-Seq GO CC: GO Cellular Components that showed an enrichment p-value smaller than 0.05 in any of the performed analyses for the RNA-Seq results; (7) RNA-Seq GO MF: GO Molecular Functions that showed an enrichment p-value smaller than 0.05 in any of the performed analyses for the RNA-Seq results; (8) RNA-Seq MSigDB CP: MSigDB Canonical Pathways that showed an enrichment p-value smaller than 0.05 in any of the performed analyses for the RNA-Seq results; (9) Common Genes GO: GO terms that showed an enrichment p-value smaller than 0.05 in the 77 genes with common evidence in the RNA-Seq and proteomics results (multiple comparison corrected significance in one experiment and nominal significance in the other one); (10) Common Genes MSigDB CP: MSigDB Canonical Pathways that showed an enrichment p-value smaller than 0.05 in the 77 genes with common evidence in the RNA-Seq and Proteomics results. (XLSX 110 kb)
Additional file 7: Table S7.MS3 proteomics and RNA-Seq PD/control comparison results for the 166 genes that were present within 100 kb (based on Annovar annotation) of the 551 genome-wide significant SNPs identified in the Nalls et al. study [7]. When the proteomics or mRNA dataset does not contain a particular gene,“NA”values are displayed in the corresponding columns. (XLSX 62 kb)
Abbreviations
BP:Biological processes; CC: Cellular components; CSN: COP9 signalosome; eQTL: Expression quantitative trait locus; FDR: False discovery rate; GO: Gene ontology; GWAS: Genome-wide association study; IPI: International protein index; KEGG: Kyoto encyclopedia of genes and genomes; mRNA: Messenger RNA; MS3: Three-stage mass spectrometry tandem mass tag; MSigDB: Molecular signatures database; MF: Molecular functions; PD: Parkinson disease; PMI: Post-mortem interval; RIN: RNA integrity number; RNA-Seq: mRNA sequencing; SNCA: Alpha-synuclein; SNP: Single nucleotide polymorphism; SVA: Surrogate variable analysis.
Competing interests
Alexandra Dumitriu, Adam T. Labadorf, Thomas G. Beach, Richard H. Myers, and Jeanne C. Latourelle declare that they have no competing interests. Kenneth Longo, Javad Golji and Benbo Gao are currently (KL) or were previously (JG, BG) employed at Proteostasis Therapeutics, Inc. Kenneth Longo holds options to purchase shares in Proteostasis Therapeutics, Inc. Proteostasis Therapeutics, Inc. does not hold, nor is it currently applying for, any patents relating to the content of this manuscript. Proteostasis Therapeutics, Inc. has not received reimbursements, fees, funding, or salary from any organization that holds or has applied for patents relating to the content of this manuscript.
Authors’contributions
Acknowledgements
Proteostasis Therapeutics Inc. provided funding support for JG, BG and KAL and for the three-stage Mass Spectrometry Tandem Mass Tag Proteomics study, which was performed by the Gygi Lab, Department of Cell Biology, Harvard Medical School, Boston MA. The remainder of this work was funded as follows: statistical and bioinformatics analyses and RNA-sequencing by R01-NS076843 (Characterization of the role of cyclin G-associated kinase in Parkinson disease), R01-NS088538 (An IPSC Based Platform for Functionally Assessing Genetic and Environmental Risk Factors in PD), the Cogan Family Foundation, and the NSF EAGER (Initiative for Physics and Mathematics of Neural Systems) grant; GWAS locus analysis by R01-NS36711 (Genetic Linkage Study in Parkinson’s Disease), microarray by the Robert P. and Judith N. Goldberg Foundation, and the Bumpus Foundation. We are grateful to the sequencing core at Tufts University for the RNA-sequencing of all samples, and the microarray core facility at the Whitehead Institute for the microarray study. We would like to acknowledge that the brain samples were provided by the National Brain and Tissue Resource for Parkinson’s Disease and Related Disorders at Banner Sun Health Research Institute (U24-NS072026), Sun City, Arizona, the Harvard Brain Tissue Resource Center McLean Hospital, Belmont, Massachusetts, and the Human Brain and Spinal Fluid Resource Center VA, West Los Angeles Healthcare Center, California. The funders had no role in study design, data collection and analysis, decision to publish, or preparation of the manuscript.
Author details
1
Department of Neurology, Boston University School of Medicine, Boston, MA 02118, USA.2Proteostasis Therapeutics Inc., Cambridge, MA 02139, USA. 3
Banner Sun Health Research Institute, Sun City, AZ 85351, USA.4Genome Science Institute, Boston University School of Medicine, Boston, MA 02118, USA.
Received: 20 July 2015 Accepted: 30 September 2015
References
1. Lesage S, Brice A. Parkinson’s disease: from monogenic forms to genetic susceptibility factors. Hum Mol Genet. 2009;18(R1):R48–59.
2. Paisan-Ruiz C, Jain S, Evans EW, Gilks WP, Simon J, van der Brug M, et al. Cloning of the gene containing mutations that cause PARK8-linked Parkinson’s disease. Neuron. 2004;44(4):595–600.
3. Kitada T, Asakawa S, Hattori N, Matsumine H, Yamamura Y, Minoshima S, et al. Mutations in the parkin gene cause autosomal recessive juvenile parkinsonism. Nature. 1998;392(6676):605–8.
4. Aharon-Peretz J, Rosenbaum H, Gershoni-Baruch R. Mutations in the glucocerebrosidase gene and Parkinson’s disease in Ashkenazi Jews. N Engl J Med. 2004;351(19):1972–7.
5. Polymeropoulos MH, Higgins JJ, Golbe LI, Johnson WG, Ide SE, Di Iorio G, et al. Mapping of a gene for Parkinson’s disease to chromosome 4q21-q23. Science. 1996;274(5290):1197–9.
6. Pankratz N, Beecham GW, DeStefano AL, Dawson TM, Doheny KF, Factor SA, et al. Meta-analysis of Parkinson’s disease: identification of a novel locus, RIT2. Ann Neurol. 2012;71(3):370–84.
7. Nalls MA, Pankratz N, Lill CM, Do CB, Hernandez DG, Saad M, et al. Large-scale meta-analysis of genome-wide association data identifies six new risk loci for Parkinson’s disease. Nat Genet. 2014;46(9):989–93.
8. Goldman SM. Environmental toxins and Parkinson’s disease. Annu Rev Pharmacol Toxicol. 2014;54:141–64.
9. Chade AR, Kasten M, Tanner CM. Nongenetic causes of Parkinson’s disease. J Neural Transm Suppl. 2006;70:147–51.
10. Riley BE, Gardai SJ, Emig-Agius D, Bessarabova M, Ivliev AE, Schule B, et al. Systems-based analyses of brain regions functionally impacted in Parkinson’s disease reveals underlying causal mechanisms. PLoS One. 2014;9(8):e102909.
11. Dumitriu A, Latourelle JC, Hadzi TC, Pankratz N, Garza D, Miller JP, et al. Gene expression profiles in Parkinson disease prefrontal cortex implicate FOXO1 and genes under its transcriptional regulation. PLoS Genet. 2012;8(6):e1002794.
12. Wu L, Candille SI, Choi Y, Xie D, Jiang L, Li-Pook-Than J, et al. Variation and genetic control of protein abundance in humans. Nature.
2013;499(7456):79–82.
13. de Sousa AR, Penalva LO, Marcotte EM, Vogel C. Global signatures of protein and mRNA expression levels. Mol BioSyst. 2009;5(12):1512–26. 14. Dumitriu A, Moser C, Hadzi TC, Williamson SL, Pacheco CD, Hendricks AE,
et al. Postmortem Interval Influences alpha-Synuclein Expression in Parkinson Disease Brain. Parkinson’s disease. 2012;2012:614212.
15. Villen J, Gygi SP. The SCX/IMAC enrichment approach for global phosphorylation analysis by mass spectrometry. Nat Protoc. 2008;3(10):1630–8.
16. Ting L, Rad R, Gygi SP, Haas W. MS3 eliminates ratio distortion in isobaric multiplexed quantitative proteomics. Nat Methods. 2011;8(11):937–40. 17. Eng JK, McCormack AL, Yates JR. An approach to correlate tandem mass
spectral data of peptides with amino acid sequences in a protein database. J Am Soc Mass Spectrom. 1994;5(11):976–89.
18. Leek JT, Johnson WE, Parker HS, Jaffe AE, Storey JD. The sva package for removing batch effects and other unwanted variation in high-throughput experiments. Bioinformatics. 2012;28(6):882–3.
19. Smyth GK. Linear models and empirical bayes methods for assessing differential expression in microarray experiments. Stat Appl Genet Mol Biol. 2004;3:Article3.
20. Storey JD and Tibshirani R. Statistical significance for genome-wide experiments. Proceedings of the National Academy of Sciences. 2003;100:9440-9445. (http://www.pnas.org/content/100/16/9440.full) 21. Trapnell C, Pachter L, Salzberg SL. TopHat: discovering splice junctions with
RNA-Seq. Bioinformatics. 2009;25(9):1105–11.
22. Wang L, Wang S, Li W. RSeQC: quality control of RNA-seq experiments. Bioinformatics. 2012;28(16):2184–5.
23. Anders S, Huber W. Differential expression analysis for sequence count data. Genome Biol. 2010;11(10):R106.
24. Love MI, Huber W, Anders S. Moderated estimation of fold change and dispersion for RNA-seq data with DESeq2. Genome Biol. 2014;15(12):550. 25. Ashburner M, Ball CA, Blake JA, Botstein D, Butler H, Cherry JM, et al. Gene
ontology: tool for the unification of biology. The Gene Ontology Consortium. Nat Genet. 2000;25(1):25–9.
26. Subramanian A, Tamayo P, Mootha VK, Mukherjee S, Ebert BL, Gillette MA, et al. Gene set enrichment analysis: a knowledge-based approach for interpreting genome-wide expression profiles. Proc Natl Acad Sci U S A. 2005;102(43):15545–50.
27. Alexa A, Rahnenfuhrer J. topGO: enrichment analysis for gene ontology, R package version, vol. 28. 2010.
28. Hunter JD. Matplotlib: A 2D graphics environment. Comput Sci Eng. 2007;9(3):0090–5.
29. Perez F, Granger BE. IPython: a system for interactive scientific computing. Comput Sci Eng. 2007;9(3):21–9.
30. McKinney W. Data structures for statistical computing in Python. In: Proc 9th Python Sci Conf: 2010. 2010. p. 51–6.
31. Veyrieras JB, Kudaravalli S, Kim SY, Dermitzakis ET, Gilad Y, Stephens M, et al. High-resolution mapping of expression-QTLs yields insight into human gene regulation. PLoS Genet. 2008;4(10):e1000214.
32. Wang K, Li M, Hakonarson H. ANNOVAR: functional annotation of genetic variants from high-throughput sequencing data. Nucleic Acids Res. 2010;38(16):e164. 33. Schweitzer K, Naumann M. Control of NF-kappaB activation by the COP9
signalosome. Biochem Soc Trans. 2010;38(Pt 1):156–61.
34. Ozansoy M, Başak AN. The central theme of Parkinson’s disease:α-synuclein. Mol Neurobiol. 2013;47(2):460–5.
35. Schildknecht S, Gerding HR, Karreman C, Drescher M, Lashuel HA, Outeiro TF, et al. Oxidative and nitrative alpha-synuclein modifications and proteostatic stress: implications for disease mechanisms and interventions in synucleinopathies. J Neurochem. 2013;125(4):491–511.
36. Lanoue AC, Dumitriu A, Myers RH, Soghomonian JJ. Decreased glutamic acid decarboxylase mRNA expression in prefrontal cortex in Parkinson’s disease. Exp Neurol. 2010;226(1):207–17.
37. Moran LB, Hickey L, Michael GJ, Derkacs M, Christian LM, Kalaitzakis ME, et al. Neuronal pentraxin II is highly upregulated in Parkinson’s disease and a novel component of Lewy bodies. Acta Neuropathol. 2008;115(4):471–8. 38. Mullin S, Schapira A. alpha-Synuclein and mitochondrial dysfunction in
Parkinson’s disease. Mol Neurobiol. 2013;47(2):587–97.
39. Ordureau A, Sarraf SA, Duda DM, Heo JM, Jedrychowski MP, Sviderskiy VO, et al. Quantitative proteomics reveal a feedforward mechanism for mitochondrial PARKIN translocation and ubiquitin chain synthesis. Mol Cell. 2014;56(3):360–75. 40. Tobin JE, Cui J, Wilk JB, Latourelle JC, Laramie JM, McKee AC, et al.
41. Lauterbach EC. Psychotropic drug effects on gene transcriptomics relevant to Parkinson’s disease. Prog Neuro-Psychopharmacol Biol Psychiatry. 2012;38(2):107–15.
42. Huynh DP, Scoles DR, Nguyen D, Pulst SM. The autosomal recessive juvenile Parkinson disease gene product, parkin, interacts with and ubiquitinates synaptotagmin XI. Hum Mol Genet. 2003;12(20):2587–97.
43. Michael GJ, Esmailzadeh S, Moran LB, Christian L, Pearce RK, Graeber MB. Up-regulation of metallothionein gene expression in parkinsonian astrocytes. Neurogenetics. 2011;12(4):295–305.
44. Santos CR, Martinho A, Quintela T, Goncalves I. Neuroprotective and neuroregenerative properties of metallothioneins. IUBMB life. 2012;64(2):126–35.
45. Baird SK, Kurz T, Brunk UT. Metallothionein protects against oxidative stress-induced lysosomal destabilization. Biochem J. 2006;394(Pt 1):275–83. 46. Hirsch EC, Vyas S, Hunot S. Neuroinflammation in Parkinson’s disease.
Parkinsonism Relat Disord. 2012;18 Suppl 1:S210–2.
47. Tufekci KU, Meuwissen R, Genc S, Genc K. Inflammation in Parkinson’s disease. Adv Protein Chem Struct Biol. 2012;88:69–132.
48. Wilms H, Zecca L, Rosenstiel P, Sievers J, Deuschl G, Lucius R. Inflammation in Parkinson’s diseases and other neurodegenerative diseases: cause and therapeutic implications. Curr Pharm Des. 2007;13(18):1925–8.
49. Battle A, Khan Z, Wang SH, Mitrano A, Ford MJ, Pritchard JK, Gilad Y. Impact of regulatory variation from RNA to protein. Science. 2015;347(6222):664–7. 50. Piccirillo CA, Bjur E, Topisirovic I, Sonenberg N, Larsson O. Translational
control of immune responses: from transcripts to translatomes. Nat Immunol. 2014;15(6):503–11.
51. Wilhelm M, Schlegl J, Hahne H, Moghaddas Gholami A, Lieberenz M, Savitski MM, et al. Mass-spectrometry-based draft of the human proteome. Nature. 2014;509(7502):582–7.
52. Greenbaum D, Colangelo C, Williams K, Gerstein M. Comparing protein abundance and mRNA expression levels on a genomic scale. Genome Biol. 2003;4(9):117.
53. Langley SR, Dwyer J, Drozdov I, Yin X, Mayr M. Proteomics: from single molecules to biological pathways. Cardiovasc Res. 2013;97(4):612–22. 54. Price JC, Guan S, Burlingame A, Prusiner SB, Ghaemmaghami S. Analysis of
proteome dynamics in the mouse brain. Proc Natl Acad Sci U S A. 2010;107(32):14508–13.
55. Soreq L, Guffanti A, Salomonis N, Simchovitz A, Israel Z, Bergman H, et al. Long non-coding RNA and alternative splicing modulations in Parkinson’s leukocytes identified by RNA sequencing. PLoS Comput Biol.
2014;10(3):e1003517.
Submit your next manuscript to BioMed Central and take full advantage of:
• Convenient online submission
• Thorough peer review
• No space constraints or color figure charges
• Immediate publication on acceptance
• Inclusion in PubMed, CAS, Scopus and Google Scholar
• Research which is freely available for redistribution