NOVEL OPTIMIZATION TECHNIQUE FOR
CLASSIFICATION OF REMOTE SENSING DATA USING
SVM
1SAKTHI. G, 2 R. NEDUNCHEZHIAN
1
Hindusthan Institute of Technology, Department of Computer Science & Engineering, Coimbatore, Tamilnadu, INDIA
2Principal, Ranganathar Institute of Engineering & Technology, Coimbatore, Tamilnadu, INDIA
E-mail: [email protected] , [email protected]
ABSTRACT
Remote sensing data is a collection of images and interpretation of information about an object, area, or event without any physical contact with it. Aircraft and satellites are common remote sensing platforms for earth and its natural sources. Remote sensing’s ability to identify and monitor land surfaces and environmental conditions expanded over years with remote sensed data being essential in natural resource management. Machine learning is used for classification of the remote sensed images. This study uses Support Vector Machine (SVM) with Radial Basis Function (RBF) for classifying Remote Sensing (RS) images. RBF kernel improves classification accuracy. This study proposes SVM-RBF optimization with Cuckoo Search (CS) for remote sensing data classification.
Keywords: Remote Sensing (RS) images, Salinas’s dataset, Support Vector Machine (SVM), Cuckoo
Search (CS), Kernel Optimization.
1. INTRODUCTION
Aerial photography in the visible part of the electromagnetic wavelength is the original remote sensing, but technological developments enabled information acquisition at other wavelengths that include near infrared, thermal infrared and microwave. Information collection over many wavelength bands is called multispectral or hyper spectral data. Deployment and development of unmanned and manned satellites enhanced remotely sensed data collection offering an inexpensive way of obtaining information on large areas. Remote sensing capacity to monitor and identify land surfaces and environmental conditions has expanded over the years. Such data will be an essential natural resource management [1] tool.
Remotely sensed data has potential to monitor dynamic processes, including salinization. Remote sensing of surface features using aerial photography, videography, infrared thermometry, and multispectral scanners is used to identify and map salt-affected areas. Multispectral data acquired from Landsat, SPOT and Indian Remote Sensing (IRS) satellites series are useful to detect, map and monitor salt-affected soils [2].
Remote sensing is not limited to planetary investigations alone. Most astronomy forms are examples of remote sensing as targets investigated are vast distances away from Earth thereby denying physical contact. So astronomers collect and analyse energy from these objects in space using telescopes and sensing devices. This information is recorded and used for drawing conclusions about space and the universe.
Remote sensing uses instruments with sensors to view distant objects and material’s spectral and spatial relations from above them, or by looking out as in astronomy. Geophysics (gravity, magnetic, seismic surveys, and external fields) is considered to be a form of remote sensing. Methods are based on photons sensing (quantum particles with a wide range of energies; a specific photon has an energy value with its own corresponding frequency number of cycles of a sine waveform per unit time) in the electromagnetic spectrum [3].
sensing techniques which develop land use classification mapping improve selection of areas designed for a region’s agricultural, urban and/or industrial areas. Remote sensing technology evolution has made it a common technique in the world [4].
Mathematical statistics based conventional classification algorithms, specifically maximum likelihood methods classified remote sensing images. Normal data’s maximum likelihood method easily sets up discriminant function and with improved statistical properties makes full use of human-computer interaction, but their classification results have reduced classification due to relatively coarse spatial resolution of self and phenomena of "same objects with different spectrum" or "different objects with the same spectrum.” There are many classification methods like a neural network, fuzzy mathematics, expert systems, SVM and object-oriented classification. It is hard to promote such methods in various fields as their algorithms are complicated to understand, or the methods need users with higher classification/geological knowledge.
A supervised classification procedure based on Spatial Data Mining (SDM) and Knowledge Discovery (KD), the decision tree classification overcomes problems of earlier classification tree or classification rules construction. It needs making use of ecological and geographic knowledge priori classification, to ensure users’ experiences, and professional knowledge are important for classification results. Decision tree classification uses decision tree learning processing to get classification rules. Such classification samples are non-parametric and do not meet normal distribution. It also takes advantage of GIS database’s geographic knowledge to support classification to enhance classification accuracy [5].
SVM ensures a powerful classification procedure for data analysis and to find minimal-risk separation between various classes. Finding separation depends on available feature set and hyper-parameters tuners. Techniques for feature selection and SVM parameters optimization improve classification accuracy. Its literature is extensive [6].
This study proposes SVM optimization for classification of remote sensing data. SVM acts with Cuckoo Search (CS) Kernel Optimization. RBF kernel optimization improves classification accuracy.
2. RELATED WORKS
A new parallelized remote sensing image SVM classifier algorithm was proposed by Pan and Zhang [7] where the algorithm featured set was first split sub-feature sets, with each sub-SVM classifier being trained parallel by feature sets. Also, sub-SVMs vote their decisions to avoid a single classifier’s unstable performance. Experiments showed that classification accuracy and training speed compared to traditional SVM method improved in remote sensing image classification.
A structured output SVM for remote sensing image classification was proposed by Tuia, et al [8]. The author suggested use of structured output learning to improve kernels based remote sensing image classification. Structured output learning was concerned with machine learning algorithms design that implemented input-output mapping and considered relations between output labels, thereby generalizing unstructured kernel methods. Experiments with Very High Resolution image classification issues revealed good results releasing a wide field for research with structured output kernel procedures.
A SVM classifier based remote sensing image classification was proposed by Yan [9] which defined how to choose SVM classifier’s kernel function. The function's parameters affect system generalization and operating speed. Cross Validation and Grid Search both validated Radial Basis Kernel Polynomial Kernel and Sigmoid Kernel functions performance in Multi-class classification which deduced SVM capability and proved Grid Search effectiveness in locating optimized characteristics. In the end, three SVM classifier kernel functions classified BSQ remote sensing images in TM6 band. Experimental data proved their feasibility and efficiency.
Fuzzy c-means and SVM based automated RS Image Classification Method was proposed by Huang, et al [9].The study resolves issues that training samples did not need manual selection when supervised classification methods like SVM were used, and it was compared to unsupervised classification procedures which had higher classification accuracy. Experimental results proved that the suggested method had better efficiencies and accuracies in Land sat TM data classification.
SVM and non-linear kernel functions. The suggested procedure starts with identification of selected study area. The results showed that SVM with RBF kernel function had highest classification accuracy ratio.
An Optimal SVM Classification System for Hyperspectral Remote Sensing Images was proposed by Bazi and Melgani [11] which addressed two issues through a classification system optimizing SVM classifier accuracy for such imagery. It first determined appropriate feature subspace to carry out classification task with model selection coming next.
Classification of Hyperspectral Remote Sensing Images with SVM and PSO was proposed by Ding and Chen [12]. This procedure presented an experimental study to prove SVM approach’s generalization capability in hyper spectral classification of remote sensing images. It also suggested an evolutionary classification system based on PSO to improve SVM classifier’s generalization performance. The results confirm the superiority of SVM approach compared to conventional classifiers suggesting that more improvements regarding classification accuracy were possible by the proposed PSO-SVM classification system.
A Hybrid Model for Remote Sensing Images Classification with Linear SVM and Support Vector Selection and Adaptation was proposed by Kaya [13] in which a hybrid model that combined results of LSVM and SVSA efficiently was presented. The hybrid model’s idea was to use LSVM performance with SVSA as LSVM model was already available during SVSA implementation. Results showed that when LSVM performed better than SVSA, HSVSA achieved LSVM's performance with the hybrid model and vice versa.
Remote sensing classification research about land survey based on SVM was proposed by Jia and Wang [14]. The author worked with the remote sensing image classification using SVM using land cover information to classify SPOT high spatial resolution images. Analysis compared this method with tradition methods. Results revealed it solved image classification fragmentation and low accuracy. It also was advantageous in study speed, orientation ability and expression. This procedure faced good application prospects in classifier training time and classification time.
A CS Clustering Algorithm: A novel strategy of biomimicry was proposed by Goel, et al [15] which
were validated on two real time remote sensing satellite image datasets for extraction of a water body which was a complex problem. CSCA uses Davies Bouldin Index (DBI) as fitness function. A method for new cuckoo’s generation was also used in this algorithm. The resulting algorithm was conceptually simpler and had less parameter than other nature inspired algorithms yielding good results after parameter tuning.
Various batch mode active learning techniques for RS images classification with SVMs was investigated by Demir, et al [16]. This was possible through generalizing of multiclass problems, techniques defined for binary classifiers. Investigated techniques exploited varied query functions based on evaluation of two criteria: uncertainty and diversity. A new query function based on kernel clustering technique to assess samples diversity was proposed, and a new strategy to select the most informative representative sample from each cluster was suggested. The proposed techniques were compared to state-of-the-art methods adopted for RS applications, with the proposed method leading to improved accuracy.
3. METHODOLOGY
This study proposes SVM optimization for classification of remote sensing data. SVM is suggested with CS Kernel Optimization. Optimization of RBF kernel improves classification accuracy. The flowchart of the proposed methodology is shown in Figure 1. Dataset and method are detailed in the subsections.
3.1 Dataset
Figure 1: Flowchart of the Proposed Methodology
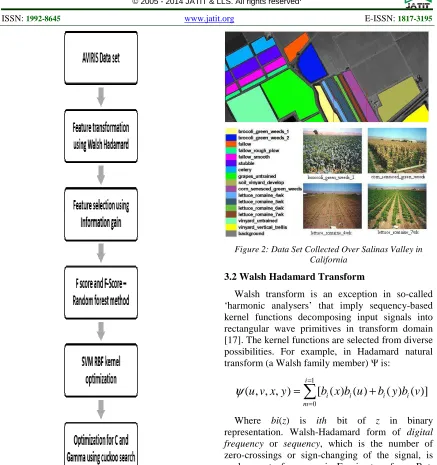
It comprises of 83x86 pixels dominated by directional classes. Figures of ground truth
taken during data acquisition are seen. A most interesting feature of Salinas’s data set is
[image:4.612.89.526.63.528.2]its representation of a hyperspectral analysis scenario dominated by directional classes with similar spatial / spectral properties. For example, romaine lettuce is at different weeks from planting with growth increasingly covering soil resulting in slightly distinct spectral signatures. This study uses a Salinas dataset subset consisting of corn_senseced_green_wees and Lettuce_romaine_5wk for evaluation.
Figure 2: Data Set Collected Over Salinas Valley in California
3.2 Walsh Hadamard Transform
Walsh transform is an exception in so-called ‘harmonic analysers’ that imply sequency-based kernel functions decomposing input signals into rectangular wave primitives in transform domain [17]. The kernel functions are selected from diverse possibilities. For example, in Hadamard natural transform (a Walsh family member) Ψ is:
1
0
( , , , )
[ ( ) ( )
( ) ( )]
i
i i i i m
u v x y
b x b u
b y b v
ψ
==
=
∑
+
Where bi(z) is ith bit of z in binary representation. Walsh-Hadamard form of digital
frequency or sequency, which is the number of
zero-crossings or sign-changing of the signal, is analogous to frequency in Fourier transform. But, sequency is double the size of signal frequency:
Seq (x) = 2 X Freq (x)
3.3 Feature Selection Using Information Gain
Information gain chooses feature vectors essential for classification [18]. This study selected the top 100 features based on information gain values as inputs for classifiers. On the computed WHT coefficient, information gain is computed based on class attribute. Information gain to be computed for attribute X whose class attribute Y is given by conditional entropy of Y given X, H (Y|X) is
(
;)
( )
( )
I Y X =H Y −H Y X
The conditional entropy of Y given X is
1
( | ) ( ) ( | )
j l
j j
j
H Y X P X x H Y X x
=
=
=−
∑
= =3.4 F-Score – Random Forest Method For Feature Selection:
Random Forest (RF) is a classification process, providing feature importance. Its idea is as follows: A forest contains decision trees, each constructed by randomly sampled features instances. Prediction is through majority decision trees vote. To get feature importance, training sets are split into two parts. Training the first and predicting the second ensures accuracy value. For jth feature, values are randomly permuted in the second set to ensure accuracy [19]. Differences between two numbers indicate the jth feature’s importance.
In practice, RF code cannot handle many features. Hence, prior to using RF for feature selection, a features subset is got by using F-score selection. This approach is called “F-score + RF” and summarized below:
1. F-score
a) Consider the subset of features obtained. 2. RF
a) Initialize RF working data set to include training instances with features subset chosen from Step 1. Use RF to get feature rank.
b) Use RF as a predictor and conduct 5-fold CV on working set.
c) Update the working set by removing half features which are less important and go to Step 2b.
Stop if features number is small.
d) Among feature subsets chosen, select that with lowest CV error.
3.5 Support Vector Machines (SVM)
SVM’s are a class of learning algorithms based on the principle of structural risk minimization. SVM is used in machine learning fields, like classification, regression estimation, and kernel PCA, due to its generalization ability. Each classifier needs metrics to measure similarity/distance between patterns. Inner product is used as a SVM classifier. In dependent relationships among pattern’s attributes, this information is accommodated through additional dimensions and realized by mapping
where H is feature space, and inner product similarity is computed through for pattern x and y [20]. In SVM literature, kernel function realizes the above course through
Kernels are generalized dot products. Gaussian RBF kernel is chosen to be used, from among various kernels. The sigmoid kernel behaves like a RBF for specific parameters. A Gaussian RBF kernel is formulated as
SVM’s have performed well as learning algorithm in the past and also on various classification problems [21]. Also, SVMs permit rapid classification from trained models and can handle very high-dimensional input vectors.
The implementation’s error function is given by the equation 1 2 1 1 N N T i i i
w w
C
ξ
C
ξ
i
− −
+
∑
+
∑
This can be minimized to
( )
T
i i i
w
φ
x
+ − ≤ +
b
y
ε ξ
( )
T
i i i i
y
−
w
φ
x
− ≤ +
b
ε ξ
,
0,
1,...,
i i
i
N
ξ ξ
≥
=
where C is capacity constant, w the coefficients vector, b a constant and are parameters to handle non-separable data (inputs). Index i labels N training cases.
SVM model with RBF kernel: C and gamma (γ). Value of C and γ influence SVM learning performance
Intuitively γ parameter defines the distance a single training example reaches, with low values meaning ‘far’ and high values meaning ‘close’. C parameter trades training examples misclassification against decision surface simplicity. A low C ensures smooth decision surface and a high C classifies training examples correctly. Experiments evaluate SVM performance through variations of γ and C parameters. For optimizing parameters C and γ, and adapted PSO [22] executes optimal combination (C, γ) search. The objective function to evaluate the combination of parameters quality is based on Root Mean Squared Error (RMSE) achieved by SVM in a 10-fold cross validation experiment
3.6 Cuckoo Search (CS)
CS is inspired by obligate brood parasitism of cuckoo species which lay eggs in nests of host birds. Some cuckoos have evolved so that female parasitic cuckoos imitate colours/patterns of eggs of chosen host species thereby reducing the probability of eggs being abandoned which in turn increases re-productivity. It should be noted that many host birds engage in direct conflict with intruding cuckoos. In such instances when host birds discover that eggs are not theirs they will throw them out or abandon nests and build new ones, elsewhere.
Additionally, timing of egg-laying of some species is amazing. Parasitic cuckoos choose nests where host birds have just laid eggs. Generally, cuckoo eggs hatch earlier than host eggs. Once a first cuckoo chick comes out, the immediate instinctive action it takes is to evict host eggs by blindly propelling them out of the nest, thereby increasing the cuckoo chick’s share of food from the host bird. Studies show that a cuckoo chick can mimic the call of host chicks to ensure more feeding chances.
3.7 Cuckoo Search Implementation
Each egg represents a solution with a cuckoo egg representing a new solution. The aim is to employ new and potentially better solutions (cuckoos) replacing not-so-good solutions in nests. In a simple form, each nest has an egg. The algorithm is capable of being extended to more complicated cases where each nest has many eggs representing a solutions set (Yang 2009; Yang 2010). CS is based on three ideal rules:
• Each cuckoo lays an egg at a time, dumping it in a randomly chosen nest;
• Best nests with high egg quality (solutions) carries over to the next generation;
• Number of host nests is fixed, and a host discovers an alien egg with a probability . Here, the host bird can either throw away the egg away or abandon nest to build a new nest in another location [23, 24]
Pseudo code for CS
Objective function f(x), x = (x1, ...,xd)T;
Initial population of n host nests xi (i = 1, 2, .., n);
while (t <MaxGeneration) or (stop criterion); Get a cuckoo (say i) randomly by Levy flights; Evaluate its quality/fitness Fi;
Choose a nest among n (say j) randomly; if (Fi>Fj),
Replace j by the new solution; end
Abandon a fraction (pa) of worse nests
[and build new ones at new locations via Levy flights];
Keep the best solutions (or nests with quality solutions);
Rank the solutions and find the current best; end while
Post process results and visualisation;
4. EXPERIMENTS AND RESULTS
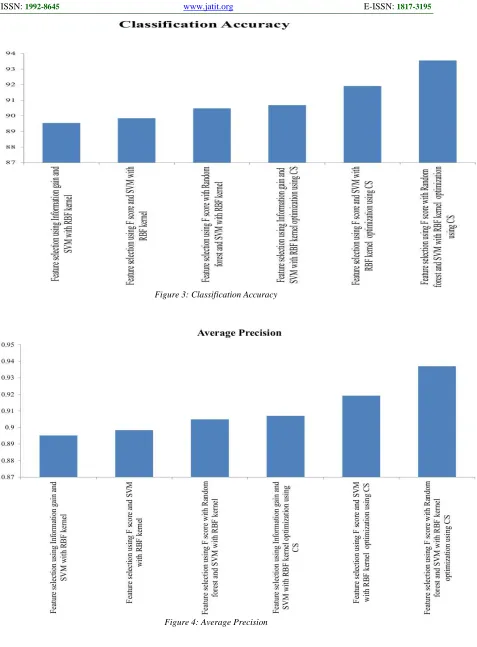
From figure 3, it is clear that feature selection using F-score with random forest and SVM with RBF kernel optimization using CS shows higher classification accuracy of 93.55 %.
From figure 4, it is obtained that feature selection using F-score with random forest and SVM with RBF kernel optimization using CS shows higher average precision of 93.7 %.
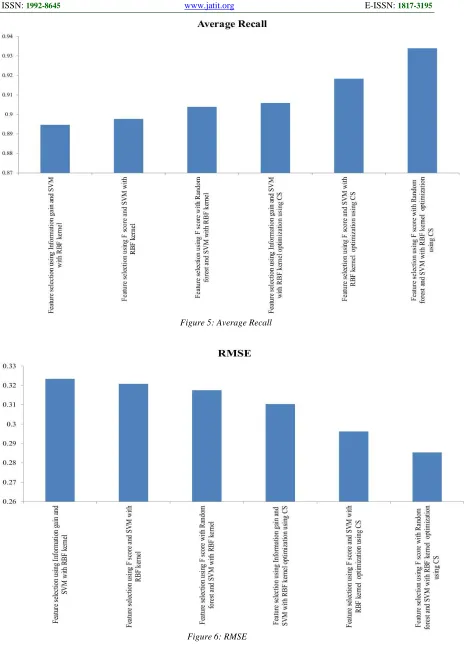
From figure 5, it is obtained that feature selection using F-score with random forest and SVM with RBF kernel optimization using CS shows higher average recall of 93.39 %.
The proposed feature selection using F-score with random forest and SVM with RBF kernel optimization using CS shows less RMSE of 28.54% compared to the other methods.
5. CONCLUSION
In this paper, Support Vector Machine (SVM) is optimized to improve the classification of remote sensed data. Walsh Hadamard transform is used for feature transformation of RS images and information gain for feature reduction in this study. Selected features are classified using Cuckoo Search (CS) algorithm optimized SVM. Classification accuracy, average precision, average recall and RMSE values are obtained. The results in section 4 prove that the suggested method has a higher classification accuracy, average precision and average recall of 93.55%, 93.7%, and 93.39% respectively and low Root Mean Square Error of 28.54% when compared to other methods.
6. REFERENCES
[1] Ashraf, M. A., Maah, M. J., &Yusoff, I. Introduction to Remote Sensing of Biomass.
[2] Barrett, E. C. (2013). Introduction to environmental remote sensing. Routledge. [3] Bazi, Y., & Melgani, F. (2006). Toward an
optimal SVM classification system for hyperspectral remote sensing images. Geoscience and Remote Sensing, IEEE Transactions on, 44(11), 3374-3385. [4] Chang, Q., Chen, Q., & Wang, X. (2005,
October). Scaling Gaussian RBF kernel width to improve SVM classification. In Neural Networks and Brain, 2005. ICNN&B'05. International Conference on (Vol. 1, pp. 19-22). IEEE.
[5] Chen, Y. W., & Lin, C. J. (2006). Combining SVMs with various feature selection strategies. In Feature
Extraction (pp. 315-324). Springer Berlin Heidelberg.
[6] Demir, B., Persello, C., & Bruzzone, L. (2011). Batch-mode active-learning methods for the interactive classification of remote sensing images. Geoscience and Remote Sensing, IEEE Transactions on, 49(3), 1014-1031.
[7] Ding, S., & Chen, L. (2009, December). Classification of hyperspectral remote sensing images with support vector machines and particle swarm optimization. In Information Engineering and Computer Science, 2009. ICIECS 2009. International Conference on (pp. 1-5). IEEE.
[8] Edwin Martínez, Remote Sensing Techniques for Land Use Classification of Rio Jauca Astershed using IKONOS Images.
[9] Eldiery, A., Garcia, L. A., & Reich, R. M. (2005). Estimating soil salinity from Remote Sensing data in corn fields. Hydrology Days, 7-9.
[10]Goel, S., Sharma, A., &Bedi, P. (2011, December). Cuckoo Search Clustering Algorithm: A novel strategy of biomimicry. In Information and Communication Technologies (WICT), 2011 World Congress on (pp. 916-921). IEEE.
[11]Guyon, I., & Elisseeff, A. (2003). An introduction to variable and feature selection. The Journal of Machine Learning Research, 3, 1157-1182.
[12]Huang, Q., Wu, G., Chen, J., & Chu, H. (2012, June). Automated Remote Sensing Image Classification Method Based on FCM and SVM. In Remote Sensing, Environment and Transportation Engineering (RSETE), 2012 2nd International Conference on (pp. 1-4). IEEE.
[13]Jia, X., & Wang, J. (2011, August). Research of remote sensing classification about land survey based on SVM. In Artificial Intelligence, Management Science and Electronic Commerce (AIMSEC), 2011 2nd International Conference on (pp. 3230-3233). IEEE. [14]Kaya, G. T. A Hybrid Model for
[15]Monadjemi, A., & Moallem, P. (2006, July). Texture classification using a novel Walsh/Hadamard transform. In 10th WSEAS International Conference on Computers (pp. 1055-1060).
[16]Pan, X., & Zhang, S. (2012, October). A novel parallelized remote sensing image SVM classifier algorithm. In Image and Signal Processing (CISP), 2012 5th International Congress on (pp. 992-996). IEEE.
[17]Renukadevi, N. & Thangaraj, P. (2013). Optimizing of SVM for CT Cclassification. Journal of Theoretical and Applied Information Technology,55(2). [18]Scholten, M., Dhingra, N., Lu, T. T., &
Chao, T. H. (2012, April). Optimization of support vector machine (SVM) for object classification. In Proc. of SPIE Vol(Vol. 8398, pp. 839806-1).
[19]Shen, W. M., Wang, W. J., Luo, H. J., Zhang, F., & Liu, X. M. (2007). Classification Methods of Remote Sensing Image Based on Decision Tree Technologies. Remote Sensing Technology and Application, 22(3), 333-337.
[20]Soliman, O. S., & Mahmoud, A. S. (2012, May). A classification system for remote sensing satellite images using support vector machine with non-linear kernel functions. In Informatics and Systems (INFOS), 2012 8th International Conference on (pp. BIO-181). IEEE. [21]Tuia, D., Muñoz-Marí, J., Kanevski, M., &
Camps-Valls, G. (2011). Structured output SVM for remote sensing image classification. Journal of Signal Processing Systems, 65(3), 301-310.
[22]Valian, E., Mohanna, E., & Tavakoli, S. (2011). Improved Cuckoo Search Algorithm for Global Optimization. Int. J. Communications and Information Technology, 1(1), 31-44.
[23]Vapnik, V. N. (1999). An overview of statistical learning theory. Neural Networks, IEEE Transactions on, 10(5), 988-999.
Figure 3: Classification Accuracy
Figure 5: Average Recall