A JPEG STEGANOGRAPHIC METHOD BASED ON
SYNDROME-TRELLIS CODES
1YE XUEYI, 2LU GUOPENG , 3WANG YUNLU, 4ZHANG YAN
1College of communication engineering, Hangzhou Dianzi University, Hangzhou, 310018, China
E-mail:[email protected] , [email protected] , [email protected] , [email protected]
ABSTRACT
Combining the Syndrome-Trellis Codes (STC) proposed recently, a new steganography method for JPEG images is presented in this paper. The method improves embedding efficiency by using the STC, and then preserves the DCT coefficient histogram statistic feature by constraining the proportion that are used for information embedding among the coefficients with the absolute value equal to one. Experimental results show that, compared with Jsteg and F5, the proposed method not only achieves a higher message capacity and embedding efficiency, also resists to histogram statistical steganalysis.
Keywords: Steganography, JPEG, Syndrome-Trellis Codes, Embedding Efficiency
1. INTRODUCTION
Steganography, as an important branch of information hiding techniques, is mainly applied to covert communication. For reducing transmission bandwidth and storing space, the JPEG image is very common on the Internet. Therefore, a lot of researchers have paid attention to investigate the steganography in the JPEG format over the past decade, and a number of steganographic methods for hiding messages in JPEG images have been proposed, such as Jsteg [1,2], Outguess [3], and F5 [4]. Jsteg essentially overwrites the least significant bits (LSB) of the quantized DCT coefficients by the secret message, and alter the histogram statistical properties of the coefficients in easily detectable ways [5]. Outguess reserves around half of the available coefficients for the purpose of correcting the statistical deviations in the global coefficient histogram caused by changing LSBs in the other half, so its steganographic capacity is reduced by about half. Although F5 maintains the DCT coefficient histograms well, its embedding operation would result in shrinkage and still change the histograms of the coefficients in a detectable way [6].The DCT coefficient histogram statistical properties [4], as the basic characteristics of JPEG image, are always utilized for steganalysis. So how to devise new embedding strategy that could preserve the DCT coefficient histogram statistical properties without sacrificing the message capacity is of great interest.
Minimizing the embedding impact on cover media and improving the embedding efficiency is an important way for enhancing the security of steganographic methods [7,8]. Syndrome coding can evidently improve the embedding efficiency, reduce the number of necessary change and decrease the embedding impact. Matrix encoding [4, 9] is the first coding scheme that is incorporated to improve embedding efficiency in steganographic methods. Filler et al proposed the STC method (Syndrome-Trellis Codes) in reference [10].The STC method can achieve higher embedding efficiency than matrix encoding.
Based on the above analysis ,we propose a new JPEG steganographic method which improves embedding efficiency by using the STC and preserves the first order statistics(histogram) of DCT coefficients by constraining the proportion that are used for information embedding among the coefficients with the absolute value equal to one. Experimental results show that, compared with Jsteg and F5, the proposed method achieves superior performance both in capacity and embedding efficiency, and resists to histogram statistical steganalysis.
2. SYNDROME-TRELLIS CODES
The idea of Syndrome-Trellis Codes is to assign each cover element with an embedding distortion and then embed a given payload with as small distortion as possible [10]. It defines the embedding and extraction mapping as:
:{0,1}
n{0,1}
k{0,1}
nEmb
×
→
, and:{0,1}
n{0,1}
kExt
→
,satisfying( , )
,
( )
,
{0,1} ,
n{0,1}
kEmb x m
y
Ext y
m
x y
m
=
=
∀
∈
∀ ∈
,
(1)
where x represents the cover vector,
m
represents the message sequence, andy
represents the stego vector. The method can modulate a k-bit message in an n-element cover, while keeping the expected distortion as small as possible. In syndrome-trellis coding, the embedding and extraction mapping are realized using a binary linear code C of lengthn
and dimensionn k
−
[10].Assuming H as its parity-check matrix, in Eq. 1, the extraction mapping becomes( ) H Ext y = y=m.
Assuming C m( )= ∈{z {0,1} |n Hz=m} is the coset corresponding to the message sequence
m
,the STC method could find the optimal z closest to x from the cosetC m( )and take it as the outputy
, i.e.,( )
( , )
arg min ( ( , ))
y C m
y
Emb x m
D x y
∈
=
=
(2). Filler et al has given the design and realization of
good syndrome-trellis codes [10]. It should be noted that the STC could improve the embedding efficiency very effectively at low embedding rate (i.e., the embedding rate
α
<
0.5
).However, its performance would decrease at high embedding rate (i.e., the embedding rateα
≥
0.5
).3. THE PROPOSED METHOD
In this paper, we propose a new steganographic method for JPEG images by using standard quantization table. The proposed method improves the embedding efficiency by using the STC, and preserves the first order histogram statistics of the DCT coefficients by a new embedding strategy. The details about the embedding strategy are as follows:
1. We choose nonzero AC DCT coefficients for information embedding, and map them to different steganographic value as in the F5 method [4]: odd positive coefficients and even negative coefficients represent steganographic one; even positive coefficients and odd negative coefficients represent a zero. First we obtain the information bits that every workable coefficient represents and arrange them as a vector, referred as the cover vector, then use the STC to modulate the secret message bits into the cover vector and obtain the stego vector. In the end we compare the stego vector with the cover vector. If any element in the cover vector changes, we modify the DCT coefficient corresponding to the element so that its absolute value is increased by one; otherwise the coefficient keeps unchanged.
2. In order to preserve the first order histogram statistics of the DCT coefficients, in addition to the embedding strategy 1, we constrain the proportion that is used for information embedding among the coefficients with the absolute value equal to one. To achieve the goal, here we don’t embed information into the coefficients with the absolute value equal one in the frequency range [2,
r
], which is in the Zigzag scan order.The reason why we should constrain the proportion that are used for information embedding among the coefficients with the absolute value equal to one and how to determine the proportion
γ
and its corresponding frequency range [2,r
] are analyzed below.Assuming that the message bits are uniformly distributed, at high embedding rate, and the probability for every workable coefficient changing approximates about1
2
.X denotes the cover image
before information embedding, H X( ) denotes its DCT coefficient histogram, and P X( =i) denotes the frequency of occurrence for the coefficient with a given value
i
inH X( ). Meanwhile Ydenotes the stego image after information embedding, H Y( ) denotes its DCT coefficient histogram, and( )
P Y= j denotes the frequency of occurrence for the coefficient with a given value
j
inH Y( ).According to the two characteristic properties of JPEG DCT coefficient histograms [4], in
( )
H X , P X( =1) 、 P X( =2) 、 P X( =3) 、
( 4)
( 1) ( 2) ( 3) ( 4)
( 1) ( 2) ( 2) ( 3)
( 3) ( 4)
P X P X P X P X
P X P X P X P X
P X P X
= > = > = > =
= − = > = − =
> = − =
(3).
If information embedding is conducted just in accordance with the instructions described in the embedding strategy 1, the DCT coefficient histogram would appear abnormal at high embedding rate. Then P Y( =1)、P Y( =2) can be represented with (P X=1)and (P X =2) as follows:
1
( 1) ( 1)
2
P Y = = P X= ,
1 1
( 2) ( 1) ( 2)
2 2
P Y = = P X= + P X = ,
And we get P Y( = <1) P Y( =2). Obviously, this abnormality is induced because too much coefficients equal to one have been modified during embedding. It destroys the DCT coefficient histogram statistic feature and is easy to be detected by the steganalysis based on the histogram statistics. So we consider constraining the proportion that is used for information embedding among the coefficients with the absolute value equal to one.
Based on statistical analysis to the quantized
8 8
×
DCT coefficient blocks of JPEG images, we find that most of the coefficients with the absolute value equal one are located in the low and middle frequency range. So in order to avoid the abnormality described above and maintain the DCT coefficient histogram, we don’t embed information into the coefficients with the absolute value equal one in the frequency range [2,r
], so the number of modification to the coefficients with the absolute value equal one is decreased. Here the frequency order from 2 tor
is in the Zigzag scan order.Next, we analyze how to determine the proportion
γ
and its corresponding frequency range [2,r
].Due to the symmetry of the JPEG DCT coefficient histogram, here we just analyze the positive half of the DCT coefficient histogram. If analyze the negative half, we will get the same result.
γ
denotes the proportion that are used for information embedding among the coefficients equal to one . The range [2, r ], in which the coefficients equal to one aren’t used for information embedding, corresponds to the proportionγ
. The relationship between (P Y= j)and P X( =i) (here, 1, 2, 3, 4, 5
i j= suffice) can be represented as follows:
1
( 1) ( 1) ( 1) ,
2
1 1
( 2) ( 2) ( 1)
2 2
1 1
( 3) ( 3) ( 2) ,
2 2
1 1
( 4) ( 4) ( 3)
2 2
1 1
( 5) ( 5) ( 4)
2 2
P Y P X P X
P Y P X P X
P Y P X P X
P Y P X P X
P Y P X P X
γ γ = = = − = = = = + = = = = + = = = = + = = = = + = (4) .
According to the two characteristic properties of JPEG DCT coefficient histogram [4], P Y( =1)、
( 2)
P Y= 、 P Y( =3) 、 P Y( =4) 、 ( 5)
P Y = should meet the following relationship:
( 1) ( 2) ( 3) ( 4) ( 5)
( 1) ( 2) ( 2) ( 3) ( 3) ( 4) ( 4) ( 5) P Y P Y P Y
P X P X
P Y P Y P Y P Y P Y P Y P Y P Y
= > = > =
> = > =
= − = > = − = >
= − = > = − =
(5)
According to Eq. 5, we can get the range of the proportion
γ
( 3) ( 2)
1
( 1) 2 ( 1)
( 2) ( 3) ( 4) ( 1)
2 ( 2) ( 3)
3 3 ( 1)
P X P X
P X P X
P X P X P X P X
P X P X P X
γ
γ
= < < − =
= =
= + = − =
=
< < − = − =
=
(6)
According to the above range of
γ
,we search for the values ofr
that match the range ofγ
.In order to maximize the message capacity while preserving the DCT coefficient histogram statistics ,we take the minimum valuer
min among the values ofr
.In other words , we don’t embed information in those coefficients with the absolute value equal one in the frequency range [2,r
min].4. EXPERIMENTAL RESULTS
quality factor 80, are taken as the cover images. We employ the pseudo random number generator to generate the secret message. In the experiments, the proposed method is compared with Jsteg and F5 in capacity, embedding efficiency, the image quality and preservation of DCT coefficient histogram statistics.
The stego image quality is evaluated by the objective quality measurement PSNR (i.e., peak
signal to noise ratio).The embedding efficiency is evaluated by the average number of bits embedded per change of the DCT coefficients:
Embedding efficiency sec
100%
Length of ret message bits Numberof DCT coefficient changes
= ×
(7)
lena airplane baboon peppers 1.5
2 2.5
3 3.5
4 4.5
5 ×10⁴
[image:4.612.93.478.116.547.2]Image Capacity in bits
Figure 1. Comparison Of Capacity For Three Steganographic Algorithms
-7
-8 -6 -5 -4 -3 -2 -1 0 1 2 3 4 5 6 7 8
3.5
3
2.5
2
1.5
1
0.5
0 ×104
5
4.5
4
Frequency of occurrence
[image:4.612.181.448.202.351.2]JPEG coefficient
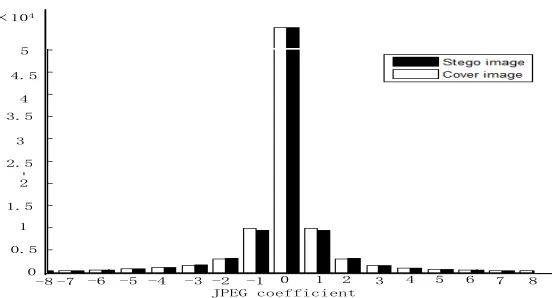
Figure 2. Histogram Change After Information Embedding For Proposed Method At Low Embedding Rate
Figure 1 shows that the proposed method provides a higher capacity than Jsteg and F5.
As is noted in Section 2, the performance of the STC decreases at high embedding rate (i.e., the
embedding rate
α
≥
0
.
5
), which would affect the performance of the proposed method directly. Next, we conduct two experiments corresponding to the two cases of low embedding rate and high embedding rate, to verify the effectiveness of the proposed method.1. At low embedding rate, we choose Lena image as the test image, and embed 10000 message bits (the corresponding embedding rate
α
<
0.5
) usingthree different steganographic methods respectively.
[image:4.612.172.448.384.533.2]Table 1. Comparison Of Embedding Efficiency For Three
Methods At Low Embedding Rate
Method Embedding
efficiency
PSNR(dB)
Jsteg 2.0004 49.7692
F5 2.0396 48.113
[image:5.612.96.464.207.675.2]Proposed method 4.9237 51.6080
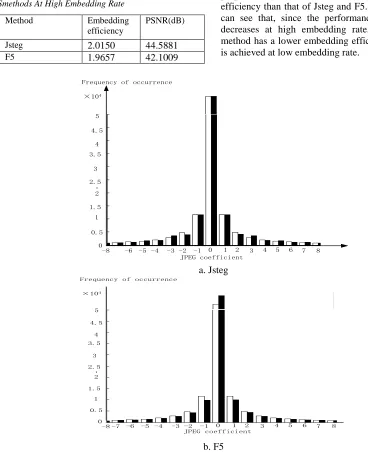
Table 2. Comparison Of Embedding Efficiency For Three
Smethods At High Embedding Rate
Method Embedding
efficiency
PSNR(dB)
Jsteg 2.0150 44.5881
F5 1.9657 42.1009
Proposed method 3.6792 44.6262
2. At high embedding rate, we choose Baboon image as the test image, and embed 30000 message bits (the corresponding embedding rate
α
≥
0
.
5
) using three different steganographic methods respectively.Table 2 shows that at high embedding rate, the proposed method still has a larger embedding efficiency than that of Jsteg and F5. Meanwhile we can see that, since the performance of the STC decreases at high embedding rate, the proposed method has a lower embedding efficiency than that is achieved at low embedding rate.
0 1 2 3 4 5 6 7
-6 -5 -4 -3 -2 -1 8
-8 3.5
3
2.5
2
1.5
1
0.5
0 ×104
5
4.5
4
Frequency of occurrence
JPEG coefficient
a. Jsteg
-7
-8 -6 -5 -4 -3 -2 -1 0 1 2 3 4 5 6 7 8
3.5
3
2.5
2
1.5
1
0.5
0 ×104
5
4.5
4
Frequency of occurrence
JPEG coefficient
3.5
3 2.5
2
1.5 1
0.5 0 ×104
5
4.5
4
-7
-8 -6 -5 -4 -3 -2 -1 0 1 2 3 4 5 6 7 8 Frequency of occurrence
JPEG coefficient
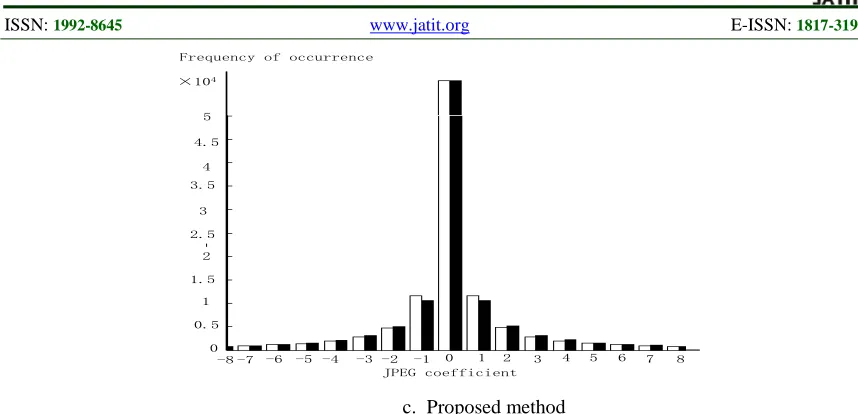
[image:6.612.92.521.69.276.2]c. Proposed method
Figure 3. Histogram Change After Information Embedding For Three Steganographic Methods At High Embedding Rate
In Figure 3, we can see that at high embedding rate, the Jsteg method equalizes the frequencies of pairs of the coefficients evidently; the F5 method greatly increases the number of zeros and results in the shrinkage; while the proposed method not only avoids the shrinkage, also maintains the DCT coefficient histogram well.
From the above experimental results, we can find that the proposed method can well preserve the DCT coefficient histogram statistic feature in both cases. Meanwhile, due to the introduction of the STC, the proposed method increases the embedding efficiency evidently, and reduces the number of necessary changes during embedding.
5. CONCLUSIONS
In this paper, a new steganographic method for JPEG images is presented, which improves embedding efficiency by using the STC method and preserves the DCT coefficient histogram statistic feature by constraining the proportion that is used for information embedding among the coefficients with the absolute value equal to one. From the experimental results, we can see that the proposed method not only achieves larger capacity and obtains better stego image quality in comparison with Jsteg and F5, but also preserves the DCT coefficient histogram statistic feature well, which makes it resistant to general histogram statistical steganalysis.
However, in this paper, we just analyze the security of steganographic methods from the first order statistical property (the DCT coefficient histogram statistics). Although the proposed method preserves the DCT coefficient histogram statistics,
we can’t guarantee it has no influence on the other high order statistical properties of JPEG image. In the future, we will study the security of steganographic methods from other high-order statistics and other properties of JPEG image.
ACKNOWLEDGEMENTS
The work of this paper was supported by the Natural Science Foundation of China (No.60802074, No.61001216, and No.60702018), the Key Project of Technology Plan of Zhejiang Province (2008C21092), and the Natural Science Foundation of Zhejiang Province (R1090138).
REFERENCES
[1] C. T.Hsu and J.L.Wu 1999 Hidden digital watermarks in images. Image Processing, IEEE Transactions on. 8(1): p58-68.
[2] C. C. Chang, T. S. Chen and L. Z. Chung 2002 A steganographic method based upon JPEG and quantization table modification. Information Sciences. 141(1): p123-38.
[3] Provos N 2001 Defending Against Statistical Steganalysis, in: Proceeding of the 10th USENIX Security Symposium, 2001, pp. 323-36.
[4] Westfeld A 2001 F5—a steganographic algorithm:High capacity despite better steganalysis, in: Proceeding Of 4th International Workshop on Information Hiding, vol.2137, 2001, pp.289-302.
[6] Fridrich J, Goljan M, Hogea D 2003 Steganalysis of JPEG images: Breaking the F5 algorithm. 5th Information Hiding Workshop. (Netherlands: Springer) 2003: p310-23
[7] Fridrich J, Pevn Y T, Kodovsk Y J 2007 Statistically undetectable jpeg steganography: dead ends challenges, and opportunities. In J . Dittmann and J. Fridrich, editors, Proceeding of the 9th ACM Multimedia and Secutity Workshop , pages 3-14,Dallas, TX, September .p 20-1, 2007.
[8] Fridrich J 2006 Minimizing the embedding impact in steganography. In J.Dittmann and J. Fridrich, editors, Proceedings ACM Multimedia and Security Workshop, Geneva Switzerland, September 26-27, 2006, pages 2-10. (New York: ACM Press).
[9] Crandall R 1988 Some notes on steganography. Posted on Steganography Mailing List, 1988. http://os. inf. tu-dresden. de/~ westfeld/crandall. pdf. 297.
[10] Filler T, Judas J, Fridrich J 2010 Minimizing embedding impact in steganography using trellis-coded quantization. Proceedings SPIE, Electronic Imaging, Security and Forensics of Multimedia XII. 2010, 7541: p1-5.