Wireless Sensor Node for Gas Pipeline Leak Detection
and Location
Lawrence Boaz, Shubi Kaijage and Ramadhani Sinde
Nelson Mandela African Institution of Science and Technology (NM-AIST), School of Computational and Communication Science and Engineering Arusha, Tanzania
ABSTRACT
Many different wireless sensor nodes for gas pipeline leak detection and location has been proposed but still there are challenges particularly on environmental issues and signal accuracy. This paper discusses theories and environmental constraints for wireless sensor nodes, a case study of Dar es Salaam - Tanzania and finally presents a design and simulation results of the proposed wireless sensor node using Proteus Design Suite for detecting frequency of sound exited by jetting gas, leaking from higher pressurised gas pipeline. This kind of proposed system can be useful to gas companies or industries whereby gas transportation is done.
General Terms
Sensor node, Gas leak detection, Pipeline monitoring, Acoustic sensor, Speed of sound in air
Keywords
Wireless sensor node design, Gas leak detection, Gas pipeline networks
1.
INTRODUCTION
The advancement in hardware and wireless technologies has resulted in inexpensive low power communication devices that can be deployed throughout a physical space. Incorporated with various sensory capabilities, these devices can sense various physical phenomena process and communicate the information and coordinate action(s) with other nodes. Such a deployment can be referred as Wireless Sensor Network (WSN) [1]. Sensors usually communicate with each other using multi hop routing or star routing approaches. The flowing data ends at special nodes called base stations or sinks. A base station links the sensor network to other network(s), this disseminates the collected sensed data for further processing and analysis [2]. However wireless sensor nodes are constrained by among many things; limited processing speed, storage capacity, battery capacity and communication bandwidth. It also has some basic networking capability such as to operate at low power and should have sensor embedded in them so as to interact with the environment and communicate the sensed parameter(s) to the central location [3].
Wireless sensor network have wide range of applications; including environmental and habitat monitoring, healthcare applications, home automation and traffic control [4].
2.
WIRELESS SENSOR NODE DESIGN
2.1
Theories and environmental
constraints
The escaping gas from pipeline generates heat and sound energy as gas molecules collide at orifice, heat is lost quickly due to heat transfer mechanisms but sound is transmitted at
considerable distances enough for acoustic sensor to detect the changes. Sound is the mechanical disturbance of a medium (gas, liquid and solid). The sound produced by leak from gas pipeline vibrates at frequency range audible to human ear (i.e., 20Hz – 20kHz).
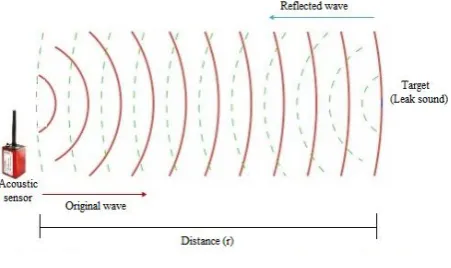
[image:1.595.316.542.333.467.2]Acoustic sensor transmit a pulse of acoustic sound toward a target, which reflects the sound back to the sensor. The system then measures the time for the echo to return to the sensor and computes the distance to the target using the speed of sound in the medium (air), Figure 1 illustrates
Fig 1: Acoustic sensor working principle
The received signal is stronger near the leak site hence pin pointing the location of the leak along the pipeline [5]. However variation in the acoustical parameters of both the environment and the target (leak) affects the operation of the wireless acoustic sensor in resolution and accuracy, hence may result into false alarm. These variations are;
2.1.1
Speed of sound in air as a function of
temperature
Time taken between the emission of the acoustic pulse and its return to the receiver is measured. The distance to the leak is then computed using the speed of sound in the transmission medium (usually air). The accuracy of the leak distance measurement is directly proportional to the accuracy of the speed of sound.
(1)
The speed of sound in air is given approximately by the formula [6]:
(2)
where θ is the ambient temperature in o
30
= (3)
where T is the ambient temperature in oK. At a normal room
temperature of θ = 22o
C, speed of sound (c) in air = 331.4 ms
-1 approximate.
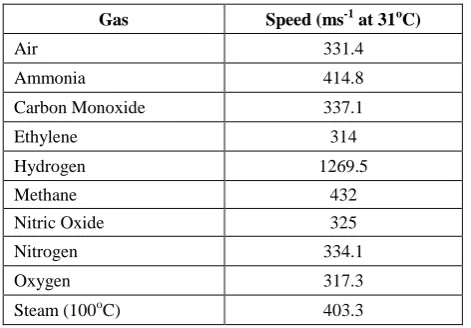
[image:2.595.47.283.234.398.2]The speed of sound in different gaseous media is a function of the bulk modules of the gas, and is affected by both the chemical composition and temperature. Maximum temperature (31oC) for the city of Dar es Salaam-Tanzania (Table 2) captured on June 4, 2014 [7], taken for calculating the speed of sound for different gases in Table 1 shown below:
Table 1. Speed of sound for various gases
Gas Speed (ms-1 at 31oC)
Air 331.4
Ammonia 414.8
Carbon Monoxide 337.1
Ethylene 314
Hydrogen 1269.5
Methane 432
Nitric Oxide 325
Nitrogen 334.1
Oxygen 317.3
Steam (100oC) 403.3
Table 2. Weather forecast-Northern coast of Tanzania
2.1.2
Attenuation of sound as a function of frequencyand humidity
As sound travels, the amplitude of the sound pressure is reduced due to friction losses in the transmission medium (Air). Knowing the value of this absorption loss (attenuation) is important in determining the maximum range of a sensor. The attenuation of sound in air increases with the frequency, and at any given frequency the attenuation varies as a function of humidity [8]. The value of humidity that produces the maximum attenuation is not the same for all frequencies. A good estimate for the maximum attenuation in air at room temperature over all humidity for frequencies up to 50 kHz is given by:
(4)
Frequencies between 50 kHz and 300 kHz, the maximum attenuation over all humidity is:
(5)
α(f) = maximum attenuation in dB/ft f = frequency of sound in kHz 2.1.3 Background noise
The level of background noise diminishes as the frequency increases. The reason is that less noise at the higher frequencies is produced in the environment, and the noise that is produced is greatly attenuated as it travels through the air. However for ambient atmospheric pressure, an internal gas pipeline pressure of only 186kPa (1.86bar) is sufficient to produce acoustic sound energy [9]. Gas pipeline are mostly characterised by higher pressure than ambient background noise.
2.1.4 Medium on the magnitude of sound pressure The magnitude of the sound pressure generated varies from one type of sensor to another. In acoustics, sound pressure is typically expressed in decibels because of the large dynamic ranges. It is usually measured in micropascals (μPa) at a reference distance (ro)from the sensor, normally 12in. (30cm).
The sound pressure level (SPL) at ro is then converted to dB as
follows [8]:
(6)
p = sound pressure at distance ro in μPa
SPL(ro) = sound pressure level at distance ro in
dB/μPa
As the sound travels through the medium, the magnitude of the sound pressure is reduced due to both absorption (attenuation) and spreading loss caused by the expanding surface of the radiating beam as the sound pulse travels from the transducer. The SPL at a distance (r) from the transducer is given by [8]:
(7)
SPL(r) = sound pressure level at distance r in dB/μPa SPL(ro) = sound pressure level at distance roin dB/μPa
α(f) = attenuation coefficient in dB/unity distance at frequency (f)
The sound power is directly proportional to the power generated by the gas upon expansion, and this is expressed as [9]:
(8)
ṁ = mass flow rate of the jetting gas T = gas temperature at the orifice M = molecular weight of the gas R = gas constant
The mass rate that assumes chocked flow at the leak source is given by the following isentropic flow relation:
(9)
ṁmax = maximum mass flow rate of leaking gas
exiting from gas pipeline through orifice A = area of the orifice
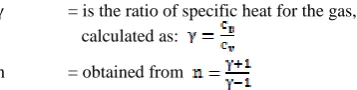
γ = is the ratio of specific heat for the gas, calculated as:
n = obtained from
In order for the mass rate to reach a maximum, the ratio of ambient pressure (po) to the pressure inside the pipe (pi) must
be [9]:
(10)
for methane γ = 1.32, the critical pressure ratio is 0.54
Figure 2, describes linear relationship between maximum mass flow rate at 70 bar gas pressure inside pipeline and the size of the orifice (hole) when gas escape from pipeline. The mass flow rate increase with the increase of leak size.
0 50 100 150 200 250
0.5 1 1.5 2 2.5 3
M
ass
f
lo
w
ra
te (t
o
n
/h
)
Leak size (mm)
Fig 2: Relationship between maximum mass flow rates leaking from pipeline and the size of leak
Figure 3 shows the decrease of SPL as the target (leak) distance increase from the source (acoustic sensor)
Fig 3: SPL decrease with the increase of leak distance
Wireless sensor node for sound detection consists of a microcontroller, wireless communication, embedded sensor and power source. Figure 4, depicts architecture of a typical wireless sensor node.
[image:3.595.92.271.72.117.2]Microcontroller (PIC 16F887) is the core architecture which controls the node’s operation. Once acoustic sensor detects sound, it will send to the microcontroller. The microcontroller determines either to send the data or not. The information flows from sensed node to other node or directly transmitted to base station using UART which provide serial communication to Xbee RF Module. Base station takes an appropriate action regarding the information received. Each sensor node includes a radio module for communicating with other node or base station. Xbee RF module (Figure 5) was engineered to meet IEEE 802.15.4 standards for wireless communication network [10]. The module is cheap in cost, requires minimal power and provides reliable delivery of data between devices compered to WiMAX technology which is more expensive.
Fig 4: Node architecture
Fig 5:Xbee RF Module
[image:3.595.315.542.233.502.2]Figure 6 presents leak detection and location model, sensor fields are interconnecting to each other to provide continuous pipeline monitoring.
Fig 6: Pipeline monitoring sensor networks
3.
SIMULATION RESULTS
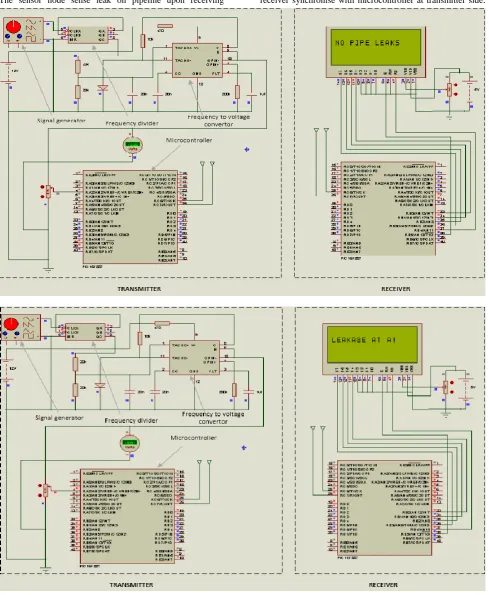
[image:3.595.63.282.288.437.2] [image:3.595.59.283.515.682.2] [image:3.595.316.543.553.683.2]32 frequency to voltage converter chip (74LS57), as
microcontroller work on voltage. Finally voltage is fed to the microcontroller (16F887) for
computational and decision making regarding received
voltage. The sensor node sense leak on pipeline upon receiving
frequency between 20Hz – 20kHz of gas leak sound. The information from microcontroller at transmitter is taken
[image:4.595.55.545.129.725.2]by Xbee RF module and transmitted wirelessly up to reception side for display. The LCD display the information received from transmitter node. The microcontroller at receiver synchronise with microcontroller at transmitter side.
4.
CONCLUSION
Wireless sensor nodes in wireless sensor networks perform several key functions like gathering sensory information, information processing and communication with other connected nodes in network. For long gas pipeline, it involve numerous nodes for accurate monitoring. The separation between one node and another depends on sensor capabilities and its resolution and environmental constraints which affect the functionalities of the sensor. However a sensor node need to be small in size, consume extremely low energy, operate in high volumetric densities, be autonomous and operate unattended and be adaptive to the sound generated by leaking gas on pipe.
System work on frequencies between 20Hz – 20kHz, audible frequency range, below this range the system reply “no pipeline leak” and above 20Hz the system detect the presence of leak along pipeline. The challenge is on frequencies bellow or above audible range, this can be improved using ultrasonic sensor although most of gas leak fall on frequency range between 20Hz to 20kHz due to higher pressure on transmission gas pipeline, example for Songas pipeline average gas pressure is between 70 – 80 bars.
This system provide continuous real-time pipeline monitoring and surveillance for both oil and gas pipeline therefore reduce maintenance and operation cost compared to non-continuous system currently being used in Tanzania.
5.
ACKNOWLEDGMENTS
Our sincere acknowledgment to The Nelson Mandela African Institution of Science and Technology (NM-AIST) for funding this work. Sincere gratitude to Songas Limited for their support during data collection period. Thanks to Dr. Malcolm Taylor, Eng. John Runyoro, Elson Mushi and all people involved for their positive support from Songas Ltd.
6.
REFERENCES
[1] Akyildiz, I. F. and M. C. Vuran (2010). Wireless sensor networks, John Wiley & Sons.
[2] Al-Karaki, J. N. and A. E. Kamal (2004). "Routing techniques in wireless sensor networks: a survey."
Wireless communications, IEEE 11(6): 6-28.
[3] Akyildiz, I. F., et al. (2007). "A survey on wireless multimedia sensor networks." Computer networks 51(4): 921-960.
[4] Zhou, G., et al. (2006). "Crowded spectrum in wireless sensor networks." IEEE EmNets 6.
[5] L.Boaz, S. Kaijage and R. Sinde (2014). An overview of pipeline leak detection and location systems. Pan African International Conference on Information Science, Computing and Telecommunications. Arusha-Tanzania, IEEE Xplore: 133-137.
[6] Beranek, L. L. and T. Mellow (2012). Acoustics: sound fields and transducers, Academic Press.
[7] Tanzania Meteorological Agency. Weather forecast Dar
es Salaam-Tanzania (2014). http://www.meteo.go.tz/
[8] Choosing an Ultrasonic Sensor for Proximity or Distance Measurement Part 1, Acoustic Considerations:
http://www.sensorsmag.com/sensors/acoustic-ultrasound/
[9] Naranjo, E. and S. Baliga (2009). "Expanding the Use of Ultrasonic Gas Leak Detectors: A Review of Gas Release Characteristics for Adequate Detection." International Gases & Instrumentation 3(6): 24-29.
[10] MaxStream, Inc, Xbee/Xbee Pro OEM RF Modules,