REAL TIME AIR QUALITY REPORTING SYSTEM
SHA-SHA SHELYNA BINTI MOHD SHARIFF
A thesis submitted in
Fulfillment of the requirement for the award of the
Degree of Master of Electrical Engineering
FACULTY OF ELECTRICAL AND ELECTRONIC ENGINEERING
UNIVERSITI TUN HUSSEIN ONN MALAYSIA
ABSTRACT
This paper presents a project entitled Real Time Air Quality Reporting System,
which can detect readings of the air pollution index (API) in the surrounding area of the
device is connected with a cheaper cost compared detector system air pollution index
(API) available in the market. A project and a new strategy presented is to use a
combination of the Arduino software along with the GSM system and hardware by using
dust sensors to detect reading as a tool for reading the air pollution index (API).The
Reading of air pollution index (API) in unhealthy condition is detected, the system will
be sent unhealthy condition to smartphone using short messaging system (SMS). In this
way information about the unhealthy condition of IPU will quickly known for ease of
ABSTRAK
Kertas ini membentangkan projek yang bertajuk Real Time Air Quality
Reporting System yang dapat mengesan bacaan indeks pencemaran udara (IPU) di
kawasan persekitaran alat tersebut diletakan dengan kos yang lebih murah berbanding
system alat pegesan indeks pencemaran udara (IPU) yang terdapat dipasaran. Satu
cadangan dan strategi baru dibentangkan adalah dengan menggunakan gabungan antara
software Arduino berserta system GSM dan hardware dengan menggunakan alat
pengesan habuk sebagai alat mengesan bacaan indeks pencemaran udara (IPU). Keadaan
bacaan (IPU) yang tidak sihat jika dapat dikesan akan dihantar ke telefon pintar dengan
menggunakan system pesanan ringkas (SMS).Dengan kaedah ini maklumat mengenai
keadaan IPU yang tidak sihat akan cepat diketahui di sesebuah kawasan bagi
CONTENTS
TITLE PAGE
DECLARATION ii
DEDICATION iii
ACKNOWLEDGEMENT iv
ABSTRACT xiii
TABLE OF CONTENTS v
LIST OF FIGURE ix
LIST OF TABLE x
LIST OF ABBREVIATIONS xi
CHAPTER 1 INTRODUCTION
1.1 Projects Background 1
1.1.1 Air Pollution Index (API) 2
1.2 Problem Statement 5
1.3 Objective 5
1.4 Project Scope 6
CHAPTER 2 LITERATURE REVIEW
2.1 Introduction 7
2.2 Related Studies 8
2.3 Summary List Of Related Study 11
CHAPTER 3 METHODOLOGY
3.1 Introduction 13
3.2 The Development of Flow Chart 13
3.3 System Design 15
3.4 Hardware Selection and Development Platform 17
3.4.1 Air Particle Optical Sensor ` 17
3.4.2 Arduino Mega 21
3.4.3.1 Installation 29
3.4.4 Display 33
3.5 Software Development 34
3.5.1 Software selection 34
CHAPTER 4 RESULT AND ANALYSIS
4.1 Introduction 35
4.2 Hardware Design 36
4.3 Arduino Program 40
4.4 Data Sampling 44
4.5 Testing Project 45
4.6 Results of Dust Density using Sharp Optical
Dust Sensor 48
4.7 Data Sensitivity By Data Sheet Of
GP2Y1010AU0F Dust Sensor 52
4.8 Result Testing Using Of GP2Y1010AU0F
Dust Sensor 54
CHAPTER 5 CONCLUSION
5.1 Conclusion` 57
REFERENCE 59
LIST OF FIGURES
LIST PAGE
3.1 Methodology flowchart 14
3.2 Block diagram of API Monitoring System 15
3.3 Compact Optical Dust Sensor (GP2Y1010AU0F) 17
3.4 Output Voltage versus Dust Density 18
3.5 Parameter for Optical Sensor 18
3.6 Internal schematic 19
3.7 Absolute Maximum Ratings 19
3.8 Recommended input condition for LED input terminal 20
3.9 Input Condition for LED Input Terminal 20
3.10 Sampling Timing of Output Pulse 20
3.11 Arduino Mega 21
3.12 Block Diagram of the AVR Architecture 22
3.13 SREG – AVR Status Register 24
3.15 Single Cycle ALU Operation 25
3.16 SIM900 GSM shield for Arduino 26
3.17 Hardware SIM900 GSM/GPRS shield for Arduino 28
3.18 Bottom Map SIM900 GSM/GPRS shield for Arduino 28
3.19 UART Multiplexer 29
3.20 Connect the Arduino board 29
3.21 Connect the UART Interface as FT232 29
3.22 An Example For Software-Serial Connection 30
3.23 Com Switch 31
3.24 RI behavior of data calling as a receiver 31
3.25 RI behavior of URC or receive SMS 31
3.26 Mobile telephone for display the reading of API 33
3.27 Arduino IDE 34
4.1 Connection six pins on Sharp Sensor GP2Y1010AU0F 36
4.3 Circuit Design 37
4.4 Connection Between Sharp Sensor GP2Y1010AU0F With 37
Circuit
4.5 Connection Between Arduino Mega and SIM900 GSM/GPRS 38
4.6 Connection Sharp Sensor GP2Y1010AU0F , Circuit Design , 38
Audrino Mega And SIM900 GSM/GPRS
4.7 Connection Sharp Sensor GP2Y1010AU0F, Circuit Design, 39
Audrino Mega, SIM900 GSM/GPRS and Arduino Software
4.8 Done Compiling 40
4.9 Compiling Sketch 40
4.11 Data Collection From Sensor 42
4.12 Location Of Portable Air Quality Monitoring 43
4.13 Location 1 Of Sharp GP2Y1010Optical Dust Sensor 44
4.14 Location 2 Of Sharp GP2Y1010Optical Dust Sensor 44
4.15 Location 3 Of Sharp GP2Y1010Optical Dust Sensor 44
4.16 Location 4 Of Sharp GP2Y1010Optical Dust Sensor 45
4.17 Location 5 Of Sharp GP2Y1010Optical Dust Sensor 45
4.18 Comparison Data Sampling 5 Location With Air 47
Sampler For Table 4.1
4.19 Comparison Data Sampling 5 Location With Air 48
Sampler For Table 4.2
4.20 Comparison Data Sampling 5 Location With Air 49
Sampler For Table 4.3
4.21 Comparison Data Sampling 5 Location With Air 50
Sampler For Table 4.4
4.22 Sensitivity GP2Y1010AU0F Dust Sensor Using Cigarette 51 Mild Seven
4.23 Output Voltage vs. Dust Density 52
LIST OF TABLE
LIST PAGE
1.1 API system adopted in Malaysia 3
1.2 API and Health Implications (Daily Targets) 3
2.1 Summary List Of Related Studies 11
3.1 Specifications 27
3.2 Electrical Characteristics 27
3.3 RI Behavior Output 30
3.4 The status of the NETSTATUS LED 32
3.5 API and Air Pollution Level 33
4.1 Data Sampling Of Sharp GP2Y1010Optical Dust Sensor 46
4.2 Data Sampling Of Sharp GP2Y1010Optical Dust Sensor 48
4.3 Data Sampling Of Sharp GP2Y1010Optical Dust Sensor 49
LIST OF APPENDIX
CHAPTER 1
INTRODUCTION
1.1 Projects Background
In the era of globalization challenges, health is an important element in our lives.
Various diseases involving respiratory such as asthma and cough, acute
cardiovascular disease and adverse pregnancy outcomes can be acquired chiefly
derived from polluted air. Besides that, air pollution could have the greatest impact
on the environment. Global warming phenomena that threaten our earth in recent
years is closely related to the level of air pollution that caused by vast amount of
carbon emission from vehicle petrol and diesel combustion, waste from
ever-expanding production industry, uncontrolled combustion of fossil fuel and open-air
burning in the waste management site. To know the quality of the air around us is
portable air pollution index (API) monitoring system in real time. The Air Pollution
Index (API) is a simple and generalized way to describe the air quality, which is
used in Malaysia. It is calculated from several sets of air pollution data. The project
using a hardware and software to measure the dust density in the air and display the
API reading in the hand phone by the SMS (short message service). The system
must be robust and provide constant accurate reading and will help user get
information about a API air pollution in the someplace such at home where the
sensor placed. It will help user know the unhealthy condition when the system
design will send information of the API condition using the SMS received.
1.1.1 Air Pollution Index (API)
Ministry of Natural Resources and Environment stated that there are many
sources of air pollutions in Malaysia such as from industries, development activities,
motor vehicles, power generation, land clearing and open burning and forest fires.
Wisconsin Department of Natural Resources mentions that the specific pollutant, its
concentration in the air, the length of time of exposure, human own health
conditions and the environmental quality of the area are all factors in how air pollution affects human’s health [1].
The API is an index for reporting daily air quality. Air pollution index
normally includes the major air pollutants that could hard to human health. API
provides understandable information about the air pollution to the public. Malaysian
Air Quality Index (MAQI) follows closely to Pollutant Standard Index (PSI)
develop by United States Environmental Agency (EPA). The air pollutant included
in Malaysia’s API are carbon monoxide (CO), nitrogen dioxide (NO2), sulphur
dioxide (SO2), ozone (O3) and suspended particulate matter less than 10 microns in
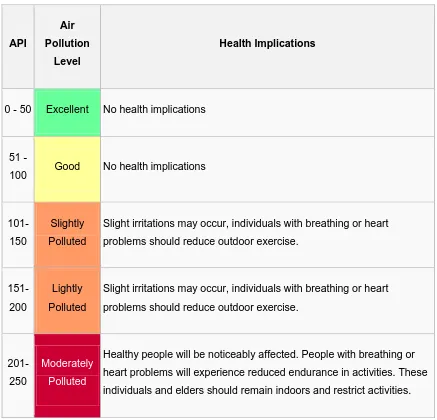
Table 1.1 API system adopted in Malaysia API Air Pollution Level Health Implications
0 - 50 Excellent No health implications
51
-100 Good No health implications
101-150
Slightly Polluted
Slight irritations may occur, individuals with breathing or heart problems should reduce outdoor exercise.
151-200
Lightly Polluted
Slight irritations may occur, individuals with breathing or heart problems should reduce outdoor exercise.
201-250
Moderately
Polluted
Healthy people will be noticeably affected. People with breathing or heart problems will experience reduced endurance in activities. These individuals and elders should remain indoors and restrict activities.
API Air Pollution Level
0 - 50 Good
51 - 100 Moderate 101 - 200 Unhealthy
201 - 300 Very unhealthy
301 - 500 Hazardous
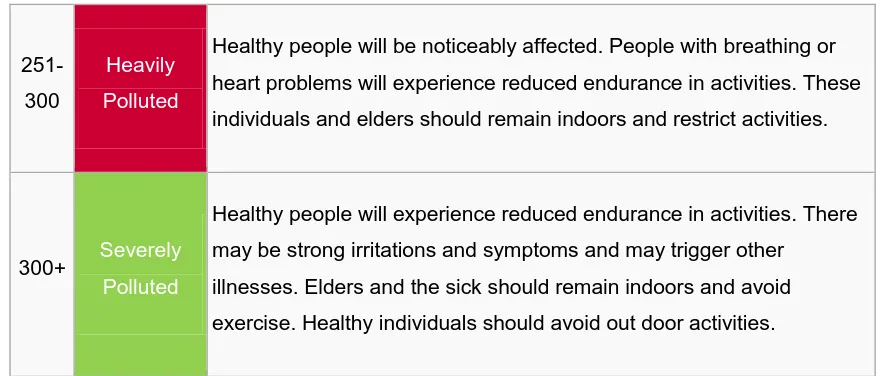
251-300
Heavily
Polluted
Healthy people will be noticeably affected. People with breathing or heart problems will experience reduced endurance in activities. These individuals and elders should remain indoors and restrict activities.
300+ Severely
Polluted
Healthy people will experience reduced endurance in activities. There may be strong irritations and symptoms and may trigger other
[image:17.612.106.547.69.257.2]illnesses. Elders and the sick should remain indoors and avoid exercise. Healthy individuals should avoid out door activities.
1.2 Problem Statement
Air pollution index (API) is basically a scale to gauge the severity or how
polluted the air is. The greater number of the API represents the more dangerous the air
quality to human health. The unpredictable weather that occurred in our country in
recent months has exposed our environment towards to natural disasters especially fire
which results in hazy environment. Haze will definitely affect the API in that particular
area where the fire occurs. On the other hand, industrial waste such as unreacted gas
could also affect the API especially the area nearby the industrial area. Nowadays,
individual who wants to have an API system has to pay a fortune because the installation
cost is very high and expensive. The size is also large and not portable. These systems
are usually used by government’s bodies and large companies who own industrial plants
to monitor the air quality. This project has been proposed to produce a cheaper version
of API system and portable using cheaper materials costs, readily available Arduino
microcontroller and GSM system.
1.3 Objective
There are few objectives that need to be achieved at the end of this project. The
objectives of this project are:
i) To design a low cost and portable air pollutant index (API) using particle
and gas sensor;
ii) To integrate the sensor, Arduino microcontroller and GSM module to
form a complete API system.
iii) To transmit and receive Air pollution index (API) data via short message
1.4 Project Scope
In order to achieve the objectives of the project, several scopes have been outlined. The
following are the scopes of the project:
i) Use a suitable sensor and signal conditioning circuit to detect air quality
pollutant at surrounding.
ii) Create suitable program coding for reading a data from sensor to Arduino
microcontroller.
iii) Create a suitable command GSM system to send the data received from
Arduino microcontroller and send data using by short message service
(SMS).
CHAPTER 2
LITERATURE REVIEW
2.1 Introduction
This chapter will discuss about the literature review from previous research related to this master’s project. Literature review is a process of collecting and analyzing data and
information which are relevant to this study. The required data and information are collected through variable sources such a journal’s, articles, reference books, and online
databases. The previous projects give some ideas and understanding on the basic
2.2 Related Studies
Srinivas D., [11] developed Public Transportation Infrastructure such as buses,
which have fixed and reliable routes along high volume corridors using a custom-made
Mobile Sensing Box (MSB). MSB includes a microcontroller board with add-on sensors,
a peripheral GPS receiver and a cellular modem. Connecting to the bus battery would
provide the power supply needed to operate this model. Used two pollution sensors to
measure carbon monoxide and particulate matter concentrations.
Adrew L., [12] designed and implemented a new generation of detectors,
nanotechnology based metal oxide semiconductors such as ZnO semiconductor to
substitute the typical analytical tools and adapt or extend the air quality monitoring
system. In fact these solid state gas sensors offer an excellent opportunity for
implementation in environmental monitoring due to light weight, extremely small size,
robustness, low cost and also as they can be installed anywhere to collect data covering
extensive areas. The air quality data can eventually be transmitted through a Wireless
GIS network system to the general public.
Kim, S. and Paulos, E. [13] designed and implemented a system called Air that
able to measure, visualize, and share indoor air quality. A DC 1100 air quality is used to
measure the level of indoor pollutant, an AVR-based Arduino which transplant inside
the air quality monitor, and an iPod Touch is used to process, visualize and transmit the
data wireless to the Arduino. The data will be reported every 15 seconds at the same
time the Arduino will encode the data into a series of audio tones like a modem and will
be read by iPod Touch via microphone port. The data can be shared from central server
in real-time by using Wi-Fi networking.
Rajiv P., and Khedo K., [14] presented a wireless sensor network air pollution
monitoring system (WAPMS). The sensor networks are dense wireless networks of
sensor networks facilitate monitoring and controlling of physical environments from
remote locations with better accuracy. They have applications in a variety of fields such
as environmental monitoring, indoor climate control, surveillance, structural monitoring,
medical diagnostics, disaster management, emergency response, ambient air monitoring
and gathering sensing information in hospitable locations. Its system design more easy
to user with develop an architecture to define nodes and their interaction, Visualization
of collected data from the WSN using statistical and user-friendly methods such as
tables and line graphs, generation of reports on a daily or monthly basis as well as
real-time notifications during serious states of air pollution for use by appropriate authorities
and Provision of an index to categorize the various levels of air pollution, with
associated colours to meaningfully represent the seriousness of air pollution.
Zakaria, N., S., [15] designed a low cost API system for a Rice Mill Factory
located in Pering, Kedah Darul Aman. The factory needs to provide a good air quality
surrounding not only for its employee but also for the neighbouring villagers. A 24 hours
production time also contributed to its pollution factor and the level of exposure endured
by the employee during the work shift needs to be considered as well. Rice Husk/Dust
Air Particle Sensor using ZigBee Wireless Sensor Network was developed using
SHARP GP2Y1010AU0F optical dust sensor as the measurement tools, an Arduino Fio
board was used as the development board for its expansion capabilities using ZigBee
Wireless Modules. A point to point approached was developed with the data being
transmitted back to its host computer, and a serial port was used to read the HEX string
data. Parallax Microcontroller Acquisition to Excel (PLX DAQ) software is used to read
the string data and save it to Microsoft Excel software. Using Visual Basic Application
on Microsoft Excel, a graph displaying the dust measurement can be viewed on the real
time basis. Conclusively, the sensor and methods used for this project was substantial
enough to monitor the dust density for reducing the dust pollution in the Rice Mill
Sung, J.O and Wan, Y.C [16] developed a RF wireless sensor module with
optimal communication condition to monitor indoor air quality in a room or office. The
monitoring work can be done by web-based monitoring system together with other home
networking system by using PDA (Personal Digital Assistant). There are several sensors
for instance; temperature sensor, humidity sensor, Carbon Dioxide sensor and flying
dust sensor were built in the RF transmitter board for monitoring the room environment.
An Intel 8051 microcomputer was used to control the power switches of consumer
electronics through signals received from PC or PDA.
Phang Qili [17] has presented a room dust monitoring system. The main objective
of the system was to monitor the dust concentration of a room and show the readings on
a personal computer in real time. These systems used an Arduino Uno controller work
based on a Shinyei PPD20V particle sensor to measure the dust concentration in a room.
The readings taken from the sensor will be sending to computer to show in real time
using Graphical User Interfacing (GUI) by using Visual Basic program. The result was
taken in several conditions including clean room, dusty room, room with cooking haze
and room with cigarette smoke. The result varied with the condition of the room. With
this device, the awareness of the effects of human activities on indoor pollutants can be
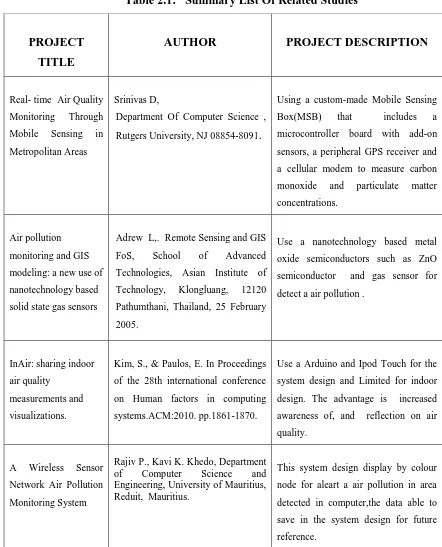
2.3 Summary List Of Related Study
Table 2.1 shows the summary of related studies regarding air pollution index
[image:24.612.104.546.161.708.2]measurements.
Table 2.1: Summary List Of Related Studies
PROJECT TITLE
AUTHOR PROJECT DESCRIPTION
Real- time Air Quality
Monitoring Through
Mobile Sensing in
Metropolitan Areas
Srinivas D,
Department Of Computer Science ,
Rutgers University, NJ 08854-8091.
Using a custom-made Mobile Sensing
Box(MSB) that includes a
microcontroller board with add-on
sensors, a peripheral GPS receiver and
a cellular modem to measure carbon
monoxide and particulate matter
concentrations.
Air pollution
monitoring and GIS
modeling: a new use of
nanotechnology based
solid state gas sensors
Adrew L,. Remote Sensing and GIS
FoS, School of Advanced
Technologies, Asian Institute of
Technology, Klongluang, 12120
Pathumthani, Thailand, 25 February
2005.
Use a nanotechnology based metal
oxide semiconductors such as ZnO
semiconductor and gas sensor for
detect a air pollution .
InAir: sharing indoor
air quality
measurements and
visualizations.
Kim, S., & Paulos, E. In Proceedings
of the 28th international conference
on Human factors in computing
systems.ACM:2010. pp.1861-1870.
Use a Arduino and Ipod Touch for the
system design and Limited for indoor
design. The advantage is increased
awareness of, and reflection on air
quality.
A Wireless Sensor
Network Air Pollution
Monitoring System
Rajiv P., Kavi K. Khedo, Department
of Computer Science and
Engineering, University of Mauritius, Reduit, Mauritius.
This system design display by colour
node for aleart a air pollution in area
detected in computer,the data able to
save in the system design for future
Rice Husk/Dust Air
Particle Sensor using
Zigbee Wireless
Sensor Network
Zakaria,S., Degree of Master Thesis.
Universiti Tun Hussien Onn
Malaysia; 2013.
Using Optical dust sensor (Sharp) and
Zigbee Module, practical and low cost,
only limited for measuring the
respirable dust in a Rice Mill factory to
maintain its good air quality policy
Room environment
monitoring system
from PDA terminal.
Oh, S. J., & Chung, W. Y.
In Intelligent Signal Processing and
Communication Systems,
2004.ISPACS 2004. Proceedings of
2004 International
Symposium.IEEE: 2004. pp.
497-501.
control by PDA terminal and RF
wireless sensor module and easily
replaced but difficult to control more
than one sensor
Room Dust
Monitoring System
P. Qili, Bachelor Degree
Thesis.Universiti Tun HussienOnn
Malaysia; 2013.
Use a Shinyei PPD 20V particle sensor
and Visual Basic for detected condition
CHAPTER 3
METHODOLOGY
3.1 Introduction
This chapter explains about the project’s methodology that has been applied in the
project. It is the guideline used in completing the project from the very beginning until
the end. The methodology consists of several activities that have been performed in
order to ensure that the project can be completed successfully.
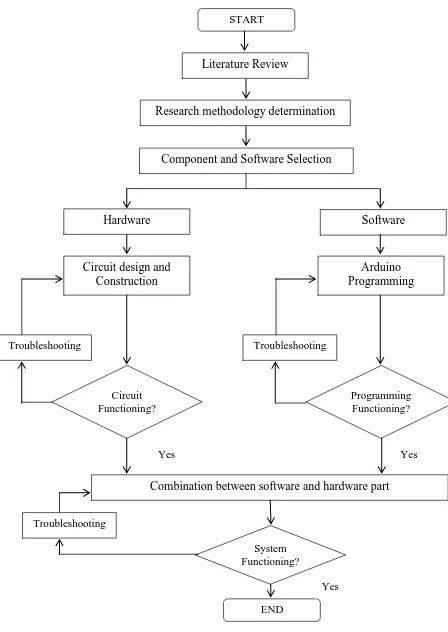
3.2 The Development of Flow Chart
Figure 3.1 shows the flowchart of the research in completing the API Monitoring
Figure 3.1: Methodology flowchart
Literature Review
Research methodology determination
Component and Software Selection
Hardware
Circuit design and Construction
Software
Troubleshooting
Combination between software and hardware part Arduino Programming
START
Circuit Functioning?
Programming Functioning? Troubleshooting
System Functioning? Troubleshooting
END
No No
No
Yes Yes
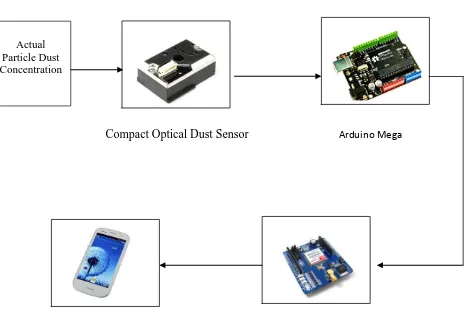
3.3 System Design
In this section, the progress of designing a real time air quality reporting system
will be discussed in detail. Therefore, this chapter deals with the design and
construction of the actual system as shown in Figure 3.2. The system can be
categorized into two parts as below:
i. Hardware development part
ii. Software development part
Compact Optical Dust Sensor Arduino Mega
[image:28.612.110.576.273.591.2]Mobile to display “unhealthy” condition of API SIM900 GSM/GPRS
Figure 3.2: Block diagram of API Monitoring System Actual
From Figure 3.2, the first stage in developing the Compact Optical Dust Sensor (GP2Y1010AU0F) will be detecting dust in the air. The sensors have a dust sensor by optical sensing system. An infrared emitting diode (IRED) and a phototransistor are diagonally arranged into this device. It detects the reflected light of dust in air. The particle sensor detects the concentration of particle in environment and converts it into a
voltage signal. Sharp’s GP2Y1010AU0F is an optical air quality sensor, designed to
sense dust particles. An infrared emitting diode and a phototransistor are diagonally
arranged into this device, to allow it to detect the reflected light of dust in air. It is
especially effective in detecting very fine particles like cigarette smoke, and is
commonly used in air purifier systems. The sensor has a very low current consumption
(20mA max, 11mA typical), and can be powered with up to 7VDC. The output of the
sensor is an analog voltage proportional to the measured dust density, with a sensitivity
of 0.5V/0.1mg/m3.
In this project, arduino DFRduino UNO R3 is used. The collected data will be sent to the arduino board to analyse the data. The analysed data is then sent to the user’s mobile phone through GSM board.
3.4 Hardware Selection and Development Platform
Hardware selection is one of the crucial parts of the project as it will determine the accuracy and reliability of the results. The following subsection explains the hardware selection and the development platform.
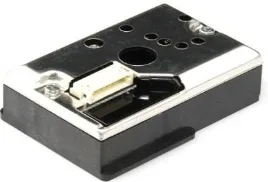
3.4.1 Air Particle Optical Sensor (Compact Optical Dust Sensor)
Figure 3.3: Compact Optical Dust Sensor (GP2Y1010AU0F)
Applications
Detecting of dust in the air.
Example: Air purifier, Air conditioner, Air monitor
Features
Compact, thin package (46.0 × 30.0 × 17.6 mm)
Low consumption current (Icc: MAX. 20 mA)
The presence of dust can be detected by the photometry of only one pulse
Enable to distinguish smoke from house dust
Lead-free and RoHS directive compliant
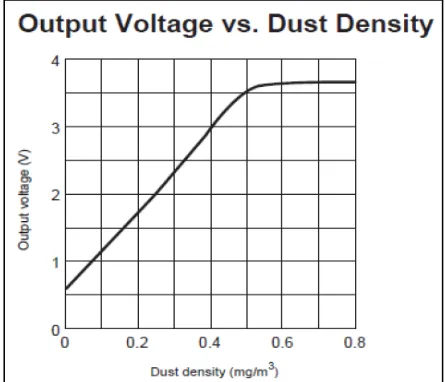
Figure 3.4 shows the Output Voltage vs. Dust Density for the optical sensor. The sensor
is based on one operation principle; a light beam is emitted into the measurement
chamber. When dust is present, the light is refracted by particles and the amount of
Figure 3.4: Output Voltage versus Dust Density
Figure 3.5 shows the important typical parameters for optical sensor. According to the
sensitivity parameter declared by Sharp GP2Y1010AU0F optical sensor is V/
(0.1mg/m3) means that each increment in voltage output is per 0.1mg/m3 of particle
volumes. The maximum output voltage can be read by the sensor is (+-) 3.6V which is
returns the dust density level to 0.5mg/m3. According to the Malaysia Ambient Air Pollution Level, the TSP maximum level is 260μg/m3 = 0.26mg/m3. The rating level is
still within the specified range of the sensor. Thus, the system will give an output
warning in visual (e.g. LED blinking) if the pollution level is above the maximum range
stated [1].
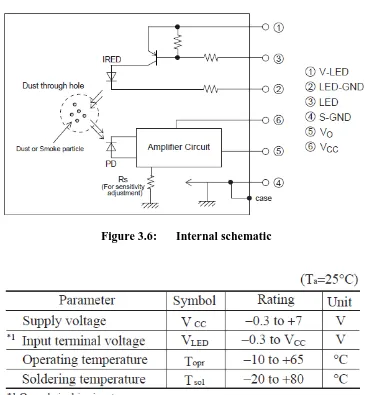
Figure 3.6 show an internal schematic of a Sharp GP2Y1010AU0F optical sensor. In the internal of the sensor, on the sensor have a hole for to trap dust or smoke
particle. Besides that, the sensor have an amplifier circuit and IRED for complete the
operation of sensor. Form Figure 3.7, the supply voltage for the sensor is rated from
-0.3V until +7V and this project, 5V is used as a power supply. Figure 3.8 shows the
[image:32.612.141.512.212.607.2]recommended input condition for LED input terminal.
Figure 3.6: Internal schematic
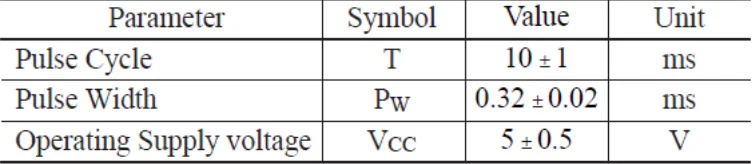
Figure 3.8: Recommended input condition for LED input terminal
Parameter for pulse cycle uses a range between 10ms and 1ms, followed by pulse width
with a range from 0.32ms until 0.02ms. For the dust sensor, 5V is used as a power
supply. Figure 3.9 shows an Input Condition for LED Input Terminal of the sensor and
Figure 3.10 show a sampling timing of output pulse for the Sharp GP2Y1010AU0F
[image:33.612.131.461.341.482.2]optical sensor.
[image:33.612.217.429.545.639.2]Figure 3.9: Input Condition for LED Input Terminal
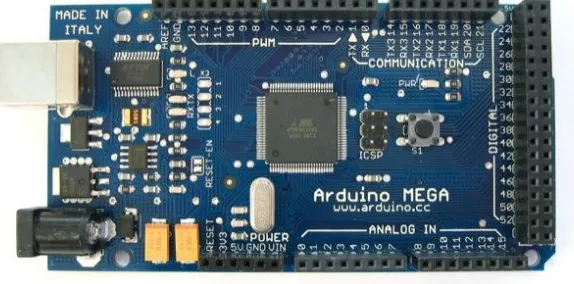
3.4.2 Arduino Mega
Figure 3.11 shows the Arduino Mega [2]. The Arduino Mega is a microcontroller board
based on the ATmega1280. It has 54 digital input/output pins of which 14 can be used as
PWM outputs, 16 analog inputs, 4 UARTs hardware serial ports, a 16 MHz crystal
oscillator, a USB connection, a power jack, an ICSP header, and a reset button. It
contains everything needed to support the microcontroller; simply connect it to a
computer with a USB cable or power it with an AC-to-DC adapter or battery to get
started. The Mega is compatible with most shields designed for the Arduino
Duemilanove or Diecimila.
Figure 3.11 : Arduino Mega
The Arduino Mega can be powered via the USB connection or with an external power
supply. The power source is selected automatically. External (non-USB) power can
come either from an AC-to-DC adapter (wall-wart) or battery. The adapter can be
connected by plugging a 2.1mm center-positive plug into the board's power jack. Leads
from a battery can be inserted in the Gnd and Vin pin headers of the POWER connector.
The board can operate on an external supply of 6 to 20 volts. If supplied with less than
If more than 12V is used, the voltage regulator may overheat and damage the board. The
recommended range is 7 to 12 volts.
Figure 3.12 show a block diagram of the AVR Architecture. In order to
maximize performance and parallelism, the AVR uses Harvard architecture with
separate memories and buses for program and data. Instructions in the program memory
are executed with a single level pipelining. While one instruction is being executed, the
next instruction is pre-fetched from the program memory. This concept enables
instructions to be executed in every clock cycle. The program memory is In-System
[image:35.612.138.530.285.680.2]Reprogrammable Flash memory.
Figure 3.13 show a SREG AVR status register for a Arduino Mega. The symbol
in the schematic is show as a :
• Bit 7 – I: Global Interrupt Enable
The Global Interrupt Enable bit must be set for the interrupts to be enabled. The
individual interrupt enable control is then performed in separate control registers. If the
Global Interrupt Enable Register is cleared, none of the interrupts are enabled
independent of the individual interrupt enable settings. The I-bit is cleared by hardware
after an interrupt has occurred, and is set by the RETI instruction to enable subsequent
interrupts.
• Bit 6 – T: Bit Copy Storage
The Bit Copy instructions BLD (Bit LoaD) and BST (Bit STore) use the T-bit as source
or destination for the operated bit. A bit from a register in the Register File can be
copied into T by the BST instruction, and a bit in T can be copied into a bit in a register
in the Register File by the BLD instruction.
• Bit 5 – H: Half Carry Flag
The Half Carry Flag H indicates a Half Carry in some arithmetic operations. Half Carry
Is useful in BCD arithmetic.
• Bit 4 – S: Sign Bit, S = N ⊕V
The S-bit is always an exclusive or between the Negative Flag N and the Two’s
Complement Overflow Flag V.
• Bit 3 – V: Two’s Complement Overflow Flag
The Two’s Complement Overflow Flag V supports two’s complement arithmetic’s.
• Bit 2 – N: Negative Flag
• Bit 1 – Z: Zero Flag
The Zero Flag Z indicates a zero result in an arithmetic or logic operation.
• Bit 0 – C: Carry Flag
[image:37.612.119.541.216.268.2]The Carry Flag C indicates a carry in an arithmetic or logic operation.
Figure 3.13: SREG – AVR Status Register
Figure 3.14 shows the parallel instruction fetches and instruction executions
enabled by the Harvard architecture and the fast-access Register File concept. This is the
basic pipelining concept to obtain up to 1 MIPS per MHz with the corresponding unique
[image:37.612.126.525.454.581.2]results for functions per cost, functions per clocks, and functions per power-unit.
Figure 3.14 : The Parallel Instruction Fetches and Instruction Executions
Figure 3.15 shows the internal timing concept for the Register File. In a single
clock cycle an ALU operation using two register operands is executed, and the result is
REFERENCE :
[1] SensorApp (2010). Sharp Dust Sensor and Arduino. Retrieved October 15, 2014, from http://sensorapp.net/sharp-dust-sensor-and-arduino/
[2] DfRobot (2014). LCD Keypad Shield for Arduino. Retrieved December 5, 2014
from http://www.dfrobot.com/index.php?route=product/product&product_id=51
[3] SensorApp (2010). Sharp Dust Sensor and Arduino. Retrieved October 15, 2014
fromhttp://www.myduino.com/index.php?route=/product&search=gsm&product_id=25
[4] DfRobot (2014). LCD Keypad Shield for Arduino. Retrieved December 5, 2014
from http://www.dfrobot.com/index.php?route=product/product&product_id=51
[5] Peters, A., Dockery, D.W., Muller, J.E., & Mittleman, M.A. Increased Particulate
Air Pollution and The Triggering of Myocardial Infarction. Circulation
2001;103:2810e5.
[6] DfRobot (2014). LCD Keypad Shield for Arduino. Retrieved December 24, 2014,
fromhttp://www.myduino.com/index.php?route=product/product&search=gsm&produ ct_id=259
[7] SoftwareApp (2010) Arduino Application and Guide Retrieved November 5, 2014, from http://arduino.cc/en/guide/introduction
[8] Wallace, L., & Howard-Reed, C. Continuous Monitoring Of Ultrafine, Fine, And
Coarse Particles in A Residence For 18 Months in 1999-2000. J Air Waste Manag
[9] Daud, Z., Ridzuan, M.,B. & Ahmad, Z. (2014). Laporan Pemantauan Kualiti
Udara PM10 and TSP. UTHM Commercial Sdn.Bhd.
[10] National Research Council: Committee on Air Quality Management in the United
States, Board on Environmental Studies and Toxicology, Board on Atmospheric
Sciences and Climate, Division on Earth and Life Studies (2004). Air Quality
Management in the United States. National Academies Press. ISBN
0-309-08932-8.
[11] Devarakonda, A. Real- time Air Quality Monitoring Through Mobile Sensing in
Metropolitan Areas, Department of Computer Science , Rutgers University, NJ
08854-8091.
[12] Ang, A., L,. Air pollution monitoring and GIS modeling: a new use of
nanotechnology based solid state gas sensors, Remote Sensing and GIS FoS,
School of Advanced Technologies, Asian Institute of Technology, Klongluang,
12120 Pathumthani, Thailand,25 February 2005.
[13] Kim, S., & Paulos, E. (2010, April). InAir: sharing indoor air quality
measurements and visualizations. In Proceedings of the 28th international
conference on Human factors in computing systems.ACM:2010. pp.1861-1870.
[14] Rajiv P. and K. K. Khedo, A Wireless Sensor Network Air Pollution Monitoring System Department of Computer Science and Engineering, University of
Mauritius, Reduit, Mauritius.
[15] Zakaria, N., S., Rice Husk/Dust Air Particle Sensor Using Zigbee Wireless Sensor
Network. Degree of Master Thesis. Universiti Tun Hussien Onn Malaysia; 2013.
[16] Oh, S. J., & Chung, W. Y. Room environment monitoring system from PDA
2004.ISPACS 2004.Proceedings of 2004 International Symposium.IEEE: 2004.
pp. 497-501.
[17] P. Qili. Room Dust Monitoring System. Bachelor Degree Thesis.Universiti Tun
HussienOnn Malaysia; 2013.
[18] Ahmad. M., PM10 and Total Suspended Particulates (TSP) Measurements In
Various Power Stations; The Malaysian Journal of Analytical Sciences, Vol 11,
No 1 (2007): 255-261.
[20] SensorApp (2010). Sharp Dust Sensor and Arduino. Retrieved January 27, 2015,
from http://www.howmuchsnow.com/arduino/airquality/.
[21] SensorApp (2010). Sharp Dust Sensor and Arduino. Retrieved January 27, 2015,
from https://github.com/Trefex/arduino-airquality/blob/master/aq5s/aq5s.ino.
[22] SensorApp (2010). Sharp Dust Sensor and Arduino. Retrieved January 27, 2015,
from
http://developer.mbed.org/users/kirchnet/code/DustSensorDisplay5110/raw-annotate/99fdd85b4929/main.cpp