isolates in routine clinical practice from December 2007 to December 2010 (
n
ⴝ
102). Comparison was made to results from
pro-spective testing of subcultures at the Scottish MRSA Reference Laboratory, using an automated system (Vitek 2) and
retrospec-tive testing (Etest and CLSI reference broth microdilution [BMD] method) of stored isolates from 2006 to 2010 (
n
ⴝ
208).
Spear-man’s rank correlations revealed a significant increase in vancomycin MIC (
P
ⴝ
0.012) and a significant decrease in daptomycin
MIC (
P
ⴝ
0.03) by year of study for Etest results from the time of isolation. However, neither trend was replicated in MICs from
automated or retrospective testing. The Friedman test revealed a significant difference between vancomycin MICs obtained from
the same samples by different testing methods (
2[3 degrees of freedom]
ⴝ
97;
P
<
0.001). MICs from automated testing and
Etest analysis of stored isolates were significantly lower than those from Etest analysis at the time of isolation for both antibiotics
(
P
<
0.001). Effects of storage on the MIC appeared within the first 6 months of storage. Inconsistent evidence on vancomycin
MIC creep and the relevance of the MIC to clinical outcome may arise from differences in susceptibility testing methods,
includ-ing storage of isolates. There is a need to standardize and streamline susceptibility testinclud-ing of vancomycin against MRSA.
M
ethicillin-resistant
Staphylococcus aureus
(MRSA) is an
im-portant community and hospital pathogen which, when
iso-lated from blood, carries a high mortality rate despite appropriate
first-line antimicrobial therapy (4, 24).
Resistance to vancomycin in MRSA (MIC of
⬎
2 mg/liter)
re-mains infrequent, but there is growing evidence in the literature
that vancomycin may be ineffective against an increasing
propor-tion of isolates with MICs between 1 and 2 mg/liter (5, 18, 28).
This has been demonstrated by the emergence of strains of
inter-mediate resistance, i.e., hetero-VISA (vancomycin-interinter-mediate
S. aureus
) and VISA strains, and of increasing proportions of
MRSA isolates with high MICs within the susceptible range, the
so-called vancomycin MIC “creep” (13, 17, 28, 30). The creep
phenomenon has not been reported consistently (7, 13, 28), but it
is concerning because vancomycin still remains the cornerstone of
therapy for many serious MRSA infections (7, 14).
Vancomycin use against methicillin-susceptible
S. aureus
(MSSA) is associated with worse outcomes than beta-lactam
ther-apy, but with limited superior alternative treatment options for
MRSA, it has been postulated that the vancomycin MIC may have
a role in the clinician’s decision to continue to use this drug as
therapy (5, 15, 16). Studies evaluating whether an
in vitro
vanco-mycin MIC can be used to predict clinical success or failure have
not been able to give definitive answers (7, 15, 26). Equally, since
outcomes often remain poor despite a vancomycin MIC in the
susceptible range (MIC of
ⱕ
2 mg/liter), there has been a
sugges-tion of lowering the clinical breakpoints further (5), and a shift in
MIC population distributions may have important implications
for the incidence of treatment failure beyond individual risk
as-sessment.
However, the interpretation of literature on vancomycin MIC
creep is complicated by inconsistencies in and limitations of
sus-ceptibility testing methods. In many of the reported studies
look-ing at
in vitro
susceptibility data, MIC testing was performed
ret-rospectively on isolates retrieved from storage, not at the time of
isolation of the organism, and often this is not made explicitly
clear (1, 7, 8, 10, 12, 13, 15, 16, 18, 19, 25, 27, 28, 30, 31, 32, 34, 35).
It has been demonstrated that certain organisms can become
more susceptible when stored (3, 22), and it is possible that this
phenomenon, together with differing methodologies, may explain
some of the conflicting results in the literature (9).
(This paper was presented in part at the 21st European
Con-gress of Clinical Microbiology and Infectious Diseases, 7 to 10
May 2011, Milan, Italy [3a].)
MATERIALS AND METHODS
Aims and study design.This study aimed to assess the possibility of van-comycin MIC creep among MRSA isolates from blood cultures obtained over a 5-year period in a teaching hospital in the United Kingdom. We also evaluated trends in daptomycin susceptibility. Second, we sought to identify trends and differences in MICs for both antibiotics by using dif-ferent susceptibility testing methods.
We evaluated vancomycin susceptibility by Etest performed prospec-tively on isolates as part of routine clinical practice starting from
mid-Received31 August 2011 Returned for modification27 September 2011
Accepted13 November 2011
Published ahead of print30 November 2011
Address correspondence to Becky Edwards, [email protected].
Copyright © 2012, American Society for Microbiology. All Rights Reserved.
doi:10.1128/JCM.05520-11
on May 16, 2020 by guest
December 2007. Results were compared firstly with those from prospec-tive testing of nonfrozen subcultures at the Scottish MRSA Reference Laboratory (SMRSARL) by use of an automated system (Vitek 2), avail-able beginning November 2008. Second, results from Etest at the time of isolation were compared with those obtained retrospectively by two methods (Etest and CLSI reference broth microdilution [BMD] method), using stored isolates from the period 2006 –2010. Trends in daptomycin susceptibility were also evaluated by Etest at the time of isolation (from mid-December 2007) and on stored isolates.
Study population and data collection.The Aberdeen Royal Infirmary (ARI) is a tertiary referral center and teaching hospital in North East Scotland, serving a population of 500,000. All MRSA blood culture
iso-lates from ARI between 1 January 2006 and 31 December 2010 were iden-tified from microbiology laboratory records. Any repeat isolates from a patient within 14 days were excluded, as this would be consistent with a treatment course for a single episode of bacteremia.
Laboratory methods.Original MIC values, obtained by Etest (AB bioMérieux) at the time of isolation, were recovered from laboratory re-cords. All other tests were performed on isolates recovered from storage in Cryobank storage containers (Mast Diagnostics) at⫺70°C. All isolates recovered from storage were subcultured twice prior to any method of susceptibility testing.
Susceptibility testing at the SMRSARL, Glasgow, United Kingdom, was performed using a Vitek 2 instrument with commercially available
Staphylococcuscards (GPS-538; AB bioMérieux). Isolates were sent away on slants and subcultured once but were not frozen prior to susceptibility testing.
For retrospective testing, Etest was performed per the manufacturer’s guidelines, using Mueller-Hinton agar (Oxoid), and tests were read blind in duplicate. For prospective testing, Etest was performed as described above as part of the routine laboratory diagnostic service, so results were read only by the biomedical scientist on duty that day. The BMD method was performed with Mueller-Hinton broth (Fluka Analytical, Sigma-Aldrich) and 11 incremental dilutions of vancomycin, from 0.25 to 8.0 mg/liter (0.25, 0.375, 0.5, 0.75, 1.0, 1.5, 2.0, 3.0, 4.0, 6.0, and 8.0 mg/liter [as in the Etest]). The CLSI-recommended reference strainS. aureus
ATCC 29213 was used as the control with every set of tests. MICs derived from the Etest or BMD method were also converted to doubling dilutions (i.e., dilutions of 0.0625, 0.125, 0.25, 0.5, 1.0, and 2.0 mg/liter) by round-ing up intermediate dilutions.
Strain data were obtained from the SMRSARL. Isolates were typed by the methods routinely used by the reference laboratory at the time they were received. Methods varied slightly, but nearly all isolates had extended antibiogram and urease testing and either pulsed-field gel electrophoresis (PFGE) orspatyping. Provisionally, most isolates could be assigned phe-notypically to a known group, and this was confirmed by the PFGE pat-tern having fewer than three band differences from a known isolate of the group or thespatype being linked to a known isolate by BURP (based upon repeat pattern) analysis using Ridom software. A subset of isolates, including representatives of all groups and all isolates with unusual phe-notypes or PFGE patterns, were subjected to multilocus sequence typing (MLST) to assign the groups to MLST clonal complexes (CCs).
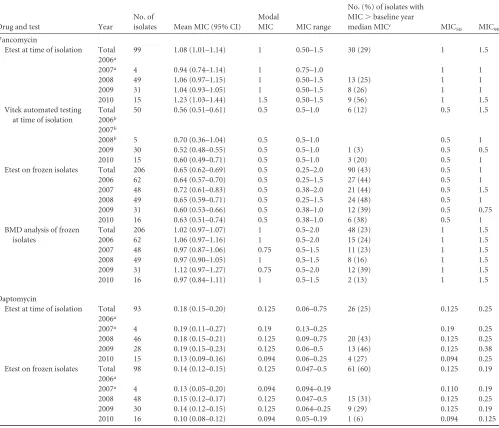
Statistical analysis. (i) MIC creep. The mean MIC, MIC range, MIC50, MIC90, and percentage of isolates with an MIC above the median
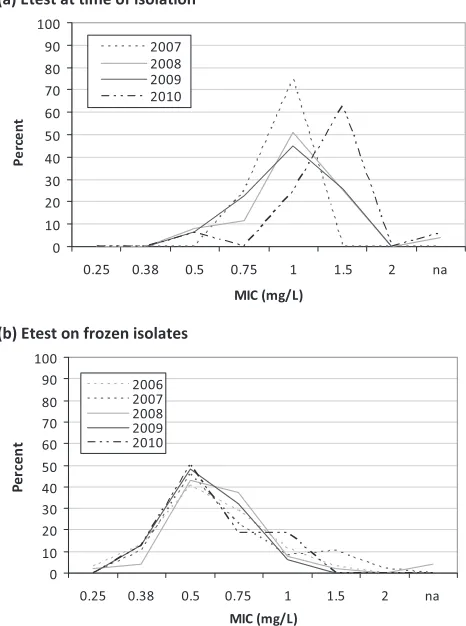
MIC in the baseline year (2006 for BMD and Etest analysis of frozen samples and 2007 [December only] for contemporaneous Etest analysis) were calculated by year. Temporal trends in vancomycin and daptomycin MICs were explored by graphing MIC population distributions for each year by each testing method. Trends were assessed formally by nonpara-metric (Spearman’s ) correlation (MIC versus year of isolate) and FIG 1Vancomycin MIC population distribution for each year of available
isolates for Etest at the time of isolation (a), Etest on frozen isolates (b), and BMD analysis of frozen isolates (c).
FIG 2Vancomycin MIC trends (2007 to 2010) obtained by Etest at the time of isolation.
on May 16, 2020 by guest
http://jcm.asm.org/
[image:2.585.298.544.68.192.2] [image:2.585.44.277.72.385.2]Mantel-Haenszel2tests of linear association (% of MIC above the
me-dian MIC in the baseline year versus year of isolate).
(ii) Temporal trends in MRSA strain distribution.To investigate the possibility of clonal expansion explaining patterns of susceptibility, iso-lates were summarized by year and MLST clonal complex. Antibiogram data were also summarized as percentages of isolates resistant to beta-lactam and non-beta-beta-lactam antibiotics by year. Temporal trends were assessed by Mantel-Haenszel2tests of linear association. Given the
num-ber of isolates available, it was not possible to formally model the effects of temporal trends in strain distribution on MIC creep. However, differ-ences in vancomycin or daptomycin MIC distribution by strain for each testing method were assessed by Kruskal-Wallis tests, withpost hoc com-parisons of individual strains by Mann-Whitney U tests.
(iii) Comparison of MICs by method.MICs obtained by different testing methods (contemporaneous Etest, automated testing by Vitek 2, Etest analysis of frozen samples, and BMD analysis of frozen samples)
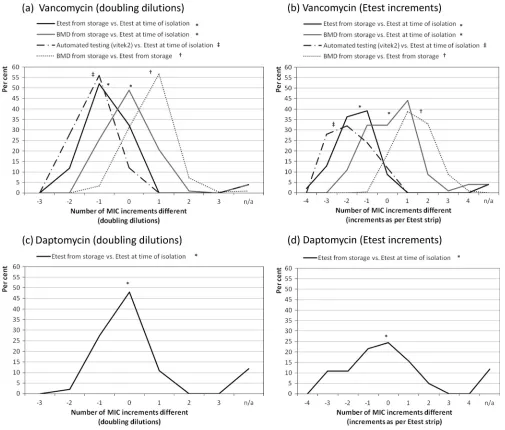
were compared for periods when Etest analysis at the time of isolation and automated testing were routine. Differences in MIC results returned by the four different methods were initially explored by graphing the per-centages of MICs from one method against differences in vancomycin increments (per Etest strip or doubling dilution) for the MICs returned by an alternative method. A difference of zero indicated no difference. The Friedman test was then used to compare MICs from the same isolates obtained by different testing methods (␣⫽0.05).Post hocanalysis to explore comparisons between methods was done by Wilcoxon signed rank tests, with a Bonferroni adjustment for multiple comparisons (␣⫽ 0.0083). Differences in daptomycin MICs obtained by Etest at the time of isolation or on stored samples were explored by the Wilcoxon signed rank test.
All analyses were repeated using data converted to doubling dilutions. Results were very similar and conclusions were unchanged, so the results are reported (unless stated otherwise) from the analysis of data in their Vitek automated testing
at time of isolation
Total 50 0.56 (0.51–0.61) 0.5 0.5–1.0 6 (12) 0.5 1.5 2006b
2007b
2008b 5 0.70 (0.36–1.04) 0.5 0.5–1.0 0.5 1
2009 30 0.52 (0.48–0.55) 0.5 0.5–1.0 1 (3) 0.5 0.5 2010 15 0.60 (0.49–0.71) 0.5 0.5–1.0 3 (20) 0.5 1 Etest on frozen isolates Total 206 0.65 (0.62–0.69) 0.5 0.25–2.0 90 (43) 0.5 1 2006 62 0.64 (0.57–0.70) 0.5 0.25–1.5 27 (44) 0.5 1 2007 48 0.72 (0.61–0.83) 0.5 0.38–2.0 21 (44) 0.5 1.5 2008 49 0.65 (0.59–0.71) 0.5 0.25–1.5 24 (48) 0.5 1 2009 31 0.60 (0.53–0.66) 0.5 0.38–1.0 12 (39) 0.5 0.75 2010 16 0.63 (0.51–0.74) 0.5 0.38–1.0 6 (38) 0.5 1 BMD analysis of frozen
isolates
Total 206 1.02 (0.97–1.07) 1 0.5–2.0 48 (23) 1 1.5 2006 62 1.06 (0.97–1.16) 1 0.5–2.0 15 (24) 1 1.5 2007 48 0.97 (0.87–1.06) 0.75 0.5–1.5 11 (23) 1 1.5 2008 49 0.97 (0.90–1.05) 1 0.5–1.5 8 (16) 1 1.5 2009 31 1.12 (0.97–1.27) 0.75 0.5–2.0 12 (39) 1 1.5 2010 16 0.97 (0.84–1.11) 1 0.5–1.5 2 (13) 1 1.5
Daptomycin
Etest at time of isolation Total 93 0.18 (0.15–0.20) 0.125 0.06–0.75 26 (25) 0.125 0.25 2006a
2007a 4 0.19 (0.11–0.27) 0.19 0.13–0.25 0.19 0.25
2008 46 0.18 (0.15–0.21) 0.125 0.09–0.75 20 (43) 0.125 0.25 2009 28 0.19 (0.15–0.23) 0.125 0.06–0.5 13 (46) 0.125 0.38 2010 15 0.13 (0.09–0.16) 0.094 0.06–0.25 4 (27) 0.094 0.25 Etest on frozen isolates Total 98 0.14 (0.12–0.15) 0.125 0.047–0.5 61 (60) 0.125 0.19
2006a
2007a 4 0.13 (0.05–0.20) 0.094 0.094–0.19 0.110 0.19
2008 48 0.15 (0.12–0.17) 0.125 0.047–0.5 15 (31) 0.125 0.25 2009 30 0.14 (0.12–0.15) 0.125 0.064–0.25 9 (29) 0.125 0.19 2010 16 0.10 (0.08–0.12) 0.094 0.05–0.19 1 (6) 0.094 0.125
aEtest analysis was not routine before December 2007.
bVitek automated testing was not routine before November 2008.
cThe baseline year was taken to be the first full year of data (2008 for Etest at time of isolation and Etest on frozen isolates for daptomycin MIC and 2009 for Vitek 2 automated
testing).
on May 16, 2020 by guest
http://jcm.asm.org/
[image:3.585.44.543.78.506.2]original form (with intermediate dilutions per Etest increments). All data were entered and analyzed in SPSS 19.0.
RESULTS
In the 5-year study period, a total of 208 MRSA blood culture
isolates were identified. It was possible to retrieve 99% of the
orig-inal isolates from storage for further susceptibility testing. MICs
from Etest analyses performed at the time of isolation were
avail-able for isolates from December 2007 (
n
⫽
102 [49%] for
vanco-mycin and
n
⫽
93 [45%] for daptomycin). MICs from automated
testing (Vitek 2) were available for 50 isolates (24%).
MIC creep. (i) Vancomycin.
Graphs of MIC distributions
from Etest results at the time of isolation by year suggested a shift
(creep) toward higher MICs between 2007 and 2010 (Fig. 1a). In
contrast, annual MIC distributions from Etest or BMD analysis of
stored isolates appeared to be stable. Spearman’s rank correlations
confirmed a significant increase in MIC by year of study for Etest
performed at the time of isolation (
P
⫽
0.012) but not in MICs
obtained by automated testing (Vitek 2;
P
⫽
0.93) or by Etest or
BMD analysis of stored isolates (
P
⬎
0.80). Between December
2007 and December 2010 (inclusive), the mean MIC increased
1.25-fold for Etest analysis at the time of isolation. This shift is
explained largely by an increase in MICs higher than the median
MIC in 2008 (1.0 mg/liter), from 25% in 2008 to 56% in 2010 (
P
⫽
0.036) (Fig. 2).
(ii) Daptomycin.
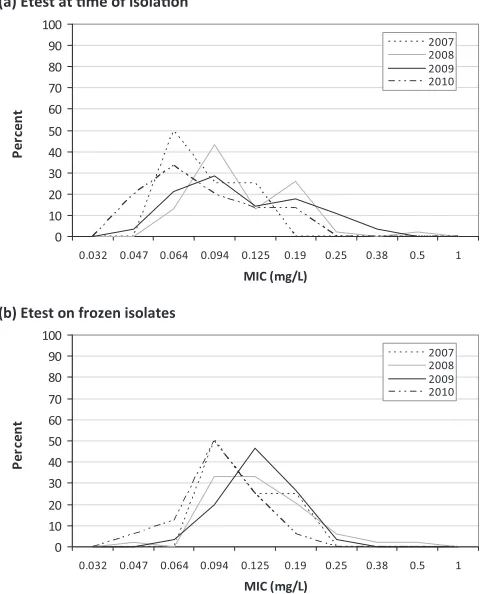
Although the proportion of daptomycin
MICs higher than the median MIC in the baseline year fell from
2008 to 2010 for both Etest at the time of isolation and Etest on
frozen isolates, the changes were not significant (Table 1 and Fig.
3). However, nonparametric linear correlations suggested a
signif-icant downward trend in MICs obtained by Etest at the time of
isolation (
P
⫽
0.03) that was not present for Etest performed on
frozen isolates (
P
⫽
0.09).
Trends in MRSA strain distribution and alternative
antibi-otic resistance.
PFGE typing identified the majority of isolates as
belonging to MLST clonal complexes CC22-MRSA-IV (73%) and
CC30-MRSA-II (10%). There was a significant shift in overall
strain distribution by year (
2[df], 26.3 [16];
P
⫽
0.029) (Fig. 4
and Table 2). This was mostly explained by a significant increase in
isolates of the CC22-MRSA-IV group (62% in 2006 to 81% in
2011;
P
⫽
0.019) and a decline in CC45-MRSA-II strains (18% to
0%;
P
⫽
0.001).
Irrespective of the testing method, there were significant
dif-ferences in vancomycin and daptomycin MIC distributions
be-tween strains (Kruskal-Wallis test;
P
⬍
0.05). Vancomycin and
daptomycin MICs for CC45, CC5, and CC8 strains were typically
higher than those for CC22 or CC30 strains (Tables 3 and 4).
Considering these two groups, there was a notable decline in those
strains with higher MICs between 2006 and 2010 (from 23% to
0%;
P
⬍
0.001) and a relative increase in those with lower MICs
(77% to 87%) (Tables 3 and 4).
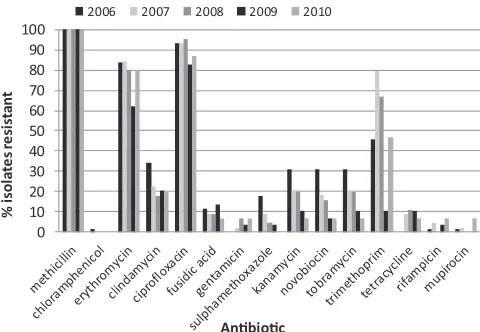
Antibiogram data revealed significant reductions in resistance
to sulfamethoxazole, kanamycin, novobiocin, and tobramycin
(
P
⬍
0.05), which have previously been attributed to regional
shifts in predominant strains from CC30-MRSA-II to
CC22-MRSA-IV (11) (Fig. 5). Patterns of resistance were otherwise
stable.
MICs obtained by different methods.
We found a significant
difference in vancomycin MICs obtained for the same isolates by
four different testing methods (Friedman test
2[3 degrees of
freedom]
⫽
97;
P
⬍
0.001) (Fig. 6a and b).
Post hoc
testing
re-vealed that vancomycin MICs from Etest analysis of stored isolates
were significantly lower than those from Etest analysis at the time
of isolation (
Z
⫽ ⫺
8.37;
P
⬍
0.001). In contrast, there was no
significant difference in the MICs obtained by BMD analysis of
stored isolates and those obtained by Etest at the time of isolation
(
Z
⫽ ⫺
1.19;
P
⫽
0.235). Vancomycin MICs from automated
test-ing (Vitek 2) were also significantly lower than those found by
Etest at the time of isolation (
Z
⫽ ⫺
5.75;
P
⬍
0.001).
Daptomycin MICs obtained by repeat Etest analysis of frozen
isolates were significantly lower than those obtained by Etest at the
time of isolation (Wilcoxon signed rank test;
Z
⫽ ⫺
4.808;
P
⬍
0.001) (Fig. 6b).
FIG 3Daptomycin MIC population distribution for each year of available isolates for Etest at the time of isolation (a) and Etest on frozen isolates (b).
FIG 4Trends in MRSA strain distribution, given as % of isolates per year. Assignment of isolates to MLST clonal complexes was done as described in Materials and Methods.
on May 16, 2020 by guest
http://jcm.asm.org/
[image:4.585.301.538.67.191.2] [image:4.585.44.286.70.367.2]There were no significant associations between the duration of
storage of isolates (months from initial isolation) and the
differ-ence between MICs from Etest on frozen samples and MICs from
Etest at the time of isolation for either vancomycin (Spearman’s
⫽
0.089;
P
⫽
0.372) or daptomycin (
⫽ ⫺
0.158;
P
⫽
0.138).
All of the above analyses were repeated on MIC data converted
to doubling dilutions. Results for both analysis of creep and
inter-method comparisons were very similar to those derived from data
for intermediate dilutions, and all conclusions were unchanged.
DISCUSSION
This study from North East Scotland found limited evidence of
vancomycin MIC creep in susceptibility testing performed at the
time of isolation. However, vancomycin MIC creep appears to be
an unstable phenomenon that is not necessarily reproducible in
stored MRSA isolates or even between different testing methods at
the time of isolation. In particular, evidence of creep was absent
from results from automated testing (Vitek 2) at the time of
iso-lation and both BMD and Etest methods used on previously
fro-zen isolates. Similarly, a declining trend in daptomycin MICs from
Etest at the time of isolation was not seen for frozen isolates. The
results revealed significant intermethod variation in MICs
ob-tained from the same isolates, irrespective of antibiotic. We noted
significant changes in MRSA strain during the study period, which
may have affected trends in susceptibility.
In the methodology of similar studies assessing vancomycin
MIC creep, isolates have been frozen previously (8, 13, 25, 32) or
this has not been made explicitly clear (1, 7, 12, 27, 28), though
there appears to be no correlation between known previously
fro-zen isolates and the presence or absence of creep. As far as we are
aware, there has been only one study where MIC trends have been
evaluated by BMD analysis of isolates at the time of clinical
isola-tion, and this study showed MIC creep (34). Our results show that
storage significantly affects the MIC, which in turn obfuscates
susceptibility trends. This effect was demonstrated by two
antibi-otics with divergent trends in antibiotic susceptibility: an increase
in vancomycin MICs and a decrease in daptomycin MICs over
time. The reliance on data from retrospective cohort studies may
explain some of the inconsistency in reporting of MIC creep for
vancomycin, and this certainly highlights the need for prospective
data collection (5).
We can draw no conclusions about whether the MIC at the
time of isolation is the most accurate reflection of an isolate’s
susceptibility to vancomycin, although it would seem reasonable
to assume that this MIC is the most clinically relevant. We know
that storage affects the susceptibility of MRSA; in particular, in
studying VISA and hetero-VISA, it can be necessary to use media
containing vancomycin to reinduce resistance after storage (2).
Our data suggest that changes in susceptibility occur early in
stor-age (within the first 6 months), as we found no association
be-tween the duration of storage and the disparity in MICs beyond
that reported here. Further work is ongoing to determine a
poten-tial cutoff duration for storage, before which isolates could safely
be assumed to have the same susceptibility as that at the time of
isolation.
This series suggests that BMD might be a more accurate way of
assessing frozen isolates, as it might be more representative of the
virulence of the original isolates. Unusually, this series showed a
BMD MIC higher than that obtained by Etest, which is in conflict
with most, but not all, of the literature (5, 21, 29, 33). It is possible
that this may be explained by the use of different suppliers for
Mueller-Hinton broth and agar. Since all controls were
satisfac-tory for each set of tests, we can offer no further explanation for
[image:5.585.43.546.79.181.2]bBy Mantel-Haenszel test of linear association.
TABLE 3Comparison of vancomycin MICs by strain and testing methoda
Strain/clonal complex No. (%) of isolates
Median (IQR) vancomycin MIC (mg/liter)b
Etest at time of isolation Etest on frozen isolates BMD analysis of frozen isolates
CC22-MRSA IV 151 (73) 1.0 (1.0–1.5) 0.5 (0.5–0.75) 1.0 (0.5–1.0) CC30-MRSA II 21 (10) 0.75 (0.75–1.0) 0.5 (0.5–0.75) 0.75 (0.5–1.0) CC45-MRSA II 16 (8) 1.5 (—) 1.0 (0.75–1.0) 1.5 (1.5–2.0) CC5-MRSA IV 9 (4) 1.5 (—) 1.0 (1.0–1.5) 1.5 (1.0–1.5) CC8/SM108/SM122 3 (1) 1.5 (—) 1.0 (—) 1.5 (—)
aAll strains were compared by the Kruskal-Wallis test, and thePvalues were 0.001,⬍0.001, and⬍0.001 for Etest at time of isolation, Etest on frozen isolates, and BMD analysis of
frozen isolates, respectively. CC22/CC30 and CC45/CC5/CC8 strains were compared by the Mann-Whitney U test, and thePvalues were⬍0.001 and 0.007 for Etest on frozen isolates and BMD analysis of frozen isolates, respectively.
bIQR, interquartile range. —, numbers were too small for valid calculation.
on May 16, 2020 by guest
http://jcm.asm.org/
[image:5.585.39.547.607.687.2]this discordant result. In our data, the BMD MIC obtained from
frozen isolates was closer to the original MIC obtained by Etest at
the time of isolation than the Etest MIC obtained from frozen
isolates.
Contention remains regarding the appropriate vancomycin
breakpoint for
S. aureus
, and the clear differences in MIC values
highlighted here, not only by methodology but also for isolates
from storage versus those at the time of isolation, may cloud this
issue further (5). For many laboratories, automated systems are in
routine use for assessing the antibiotic susceptibility of MRSA,
possibly with very few centers additionally employing either Etest
or BMD as part of routine benchwork. These issues need to be
addressed in order for both accurate and reproducible
assess-ments to be made. Differences in methodology are well known to
affect the MIC. In this setting, even small changes could have
significant consequences because of the narrow therapeutic
win-dow of vancomycin. If we used the proposed breakpoint of 1 mg/
liter by Etest on our prospectively collected data, the percentage of
resistant isolates would increase from 25% to 56% over the period
represented by the study (5). Automated systems return
vanco-mycin MICs below the breakpoint (MICs of
ⱕ
2 mg/liter) that are
known to be unreliable predictors of clinical response (5, 29, 33).
Consistent with this, our study showed large disparities between
results obtained by a Vitek 2 instrument and those obtained by
Etest at the time of isolation.
As yet, only Spanish guidelines have addressed the potential
role of vancomycin MIC in the treatment of MRSA, but this may
change as increasing evidence of clinical failure associated with
MRSA strains that have elevated MICs within the susceptible
range is gathered (6). Notably, the Infectious Diseases Society of
America (IDSA) guidelines currently suggest that the MIC is
irrel-evant in determining the continued use of vancomycin for any
infections caused by MRSA when the MIC is within the
suscepti-ble range (15). Any change in therapy should be the clinician’s
decision, based on the clinical response to treatment.
Unfortu-nately, the IDSA guidelines do not detail which methods should be
employed for susceptibility testing. We recommend that if any
guidelines incorporate a requirement for MIC testing for
vanco-mycin treatment, these would need to detail specific methods, not
merely breakpoints.
Recent articles evaluating the necessary pharmacokinetic/
pharmacodynamic (PK/PD) targets also suggest that the
proba-bility of attaining the appropriate area under the
concentration-time curve (AUC)/MIC ratio of
ⱖ
400 is the best predictor of
outcome with vancomycin (14, 23). The likelihood of attaining
this is considerably decreased as the MIC approaches 2 mg/liter,
with the associated nephrotoxicity one would expect from the
larger doses required (14). As more data become available, the
AUC/MIC ratio may become incorporated into routine practice.
However, our study suggests that interpretation in clinical
prac-tice and research should take into account the MIC testing method
used.
We are aware that this study has limitations. A small sample
size and limited clinical and therapeutic data did not permit
meaningful exploration of correlations between MIC and clinical
outcome. Evidence of actual vancomycin use was available for 128
(62%) patients, although it is likely that a proportion of those for
whom treatment was not detailed (
n
⫽
60 [38%]) may have
re-ceived vancomycin in line with the hospital’s empirical antibiotic
guidelines. We did not seek to prove the reproducibility of MIC
results for each of the testing methods, which may limit
conclu-sions about intermethod differences in MICs. However, duplicate
and independent readings of MIC results, with good agreement,
suggested limited interobserver variation (data not shown).
Fur-thermore, tests of difference suggested systematic differences
be-tween results returned by different testing methods that were not
accounted for by variation in MICs within each testing method.
[image:6.585.41.548.77.181.2]We were able to obtain only limited data on PFGE typing and
characterization of trends in strain distribution. Previous work
has shown that North East Scotland saw a relatively rapid change
in strain distribution, from a predominance of CC30/E16 to
CC22/E15 strains, from 2003 to 2007 (11), which appears to have
TABLE 4Comparison of daptomycin MICs by strain and testing methoda
Strain/clonal complex No. (%) of isolates
Median (IQR) daptomycin MIC (mg/liter)b
Etest at time of isolation Etest on frozen isolates
CC22-MRSA IV 151 (73) 0.125 (0.094–0.19) 0.125 (0.094–0.125) CC30 (ST36)-MRSA II 21 (10) 0.25 (0.125–0.25) 0.125 (0.094–0.19) Weighted avg (CC22 and CC30) 0.125 (0.094–0.19) 0.125 (0.094–0.19)
CC45 (ST45)-MRSA II 16 (8) — —
CC5-MRSA IV 9 (4) 0.250 (—) 0.19 (0.125–0.19) CC8/SM108/SM122 3 (1) 0.250 (—) 0.19 (0.19–0.25) Weighted avg (CC45, CC5, and CC8) 0.250 (0.125–0.250) 0.19 (0.125–0.19)
aAll strains were compared by the Kruskal-Wallis test, and thePvalues were 0.047 and 0.012 for Etest at time of isolation and Etest on frozen isolates, respectively. CC22/CC30 and
CC45/CC5/CC8 strains were compared by the Mann-Whitney U test, and thePvalues were 0.004 and 0.003 for Etest at time of isolation and Etest on frozen isolates, respectively.
bIQR, interquartile range. —, numbers were too small for valid calculation.
FIG 5Percentages of isolates resistant to antibiotics by year and antibiotic.
on May 16, 2020 by guest
http://jcm.asm.org/
[image:6.585.43.283.544.710.2]been sustained. Given the associations between strain and MIC,
clonal expansion may have implications for trends in
susceptibil-ity. The higher MICs obtained for CC45 are convergent with a
large proportion of VISA isolates described for the related USA600
lineage (20). The decline in strains with higher MICs in our study
may offer an explanation for increasing susceptibility of MRSA
isolates to daptomycin. However, it suggests an opposing pressure
to described increases in vancomycin MICs. Nevertheless, without
detailed typing throughout the study period, we were unable to
rule out the possibility of dissemination of subtypes within strains
(e.g., CC22) which may account for vancomycin MIC creep.
This study highlights the need to increase awareness among
clinicians of the importance of the vancomycin MIC in treating
MRSA infections, as well as the problems in its interpretation. Our
findings suggest a need to streamline susceptibility testing, and
perhaps to lower vancomycin breakpoints further, to avoid
clini-cal failure and the increased risk of mortality. As the MIC becomes
increasingly crucial in treatment decisions, the issue of MIC
dis-crepancies for isolates after storage and for measurements by
dif-ferent methods will benefit from further prospective study.
ACKNOWLEDGMENTS
We acknowledge the invaluable contributions of everyone in the diagnos-tic laboratory and media departments of ARI and also the SMRSARL for sending missing isolates and providing MIC and typing data.
I. M. Gould has received personal and grant financial support from companies manufacturing diagnostics and therapeutics for MRSA. B. Ed-wards has received grant financial support from Novartis. All other au-thors have no conflicts to declare.
We are grateful for financial support from Novartis.
REFERENCES
1.Alós J-I, García-Cañas A, García-Hierro P, Rodríguez-Salvanés F.2008. Vancomycin MICs did not creep inStaphylococcus aureusisolates from FIG 6Comparison of MICs by method of testing, given as percentages within MIC increments of alternative method. †, January 2006 to December 2010 (n⫽
206 isolates);ⴱ, December 2007 to December 2010 (n⫽102); ‡, November 2008 to December 2010 (n⫽50).
on May 16, 2020 by guest
http://jcm.asm.org/
[image:7.585.41.546.65.495.2]2002 to 2006 in a setting with low vancomycin usage. J. Antimicrob. Che-mother.62:773–775.
2.Chesneau O, Morvan A, El Solh N.2000. Retrospective screening for heterogeneous vancomycin resistance in diverse Staphylococcus aureus
clones disseminated in French hospitals. J. Antimicrob. Chemother.45: 887– 890.
3.Dan M, Richardson J, Miliotis MD, Koornhof HJ.1989. Comparison of preservation media and freezing conditions for storage of specimens of faeces. J. Med. Microbiol.28:151–154.
3a.Edwards B, Milne K, Lawes T, Cook I, Gould IM.2011. Vancomycin susceptibility trends in MRSA isolated from blood cultures in Aberdeen Royal Infirmary from 2006-2010. Is vancomycin “creep” method depen-dent?, abstr. P765. Abstr. 21st Eur. Cong. Clin. Microbiol. Infect. Dis., 7 to 10 May 2011, Milan, Italy.
4.Gomez J, et al.2007. Predictors of mortality in patients with methicillin-resistantStaphylococcus aureus(MRSA) bacteraemia: the role of empiric antibiotic therapy. Eur. J. Clin. Microbiol. Infect. Dis.26:239 –245. 5.Gould IM. 2010. Is vancomycin redundant for serious staphylococcal
infection? Int. J. Antimicrob. Agents36(Suppl 2):S55–S57.
6.Gudiol F, et al.2009. Documento de consenso sobre el tratamiento de la bacteriemia y la endocarditis causada por Staphylococcus aureus resis-tente a la meticilina. Enferm. Infecc. Microbiol. Clin.27:105–115. 7.Hawser SP, Bouchillon SK, Hoban DJ, Dowzicky M, Babinchak T.
2011. Rising incidence of Staphylococcus aureus with reduced suscepti-bility to vancomycin and susceptisuscepti-bility to antibiotics: a global analysis 2004 –2009. Int. J. Antimicrob. Agents37:219 –224.
8.Holmes RL, Jorgensen JH.2008. Inhibitory activities of 11 antimicrobial agents and bactericidal activities of vancomycin and daptomycin against invasive methicillin-resistantStaphylococcus aureusisolates obtained from 1999 through 2006. Antimicrob. Agents Chemother.52:757–760. 9.Howden BP, Davies JK, Johnson PDR, Stinear TP, Grayson ML.2010.
Reduced vancomycin susceptibility inStaphylococcus aureus, including vancomycin-intermediate and heterogeneous vancomycin-intermediate strains: resistance mechanisms, laboratory detection, and clinical implica-tions. Clin. Microbiol. Rev.23:99 –139.
10. Hsu DI, et al.2008. Comparison of method-specific vancomycin mini-mum inhibitory concentration values and their predictability for treat-ment outcome of methicillin-resistantStaphylococcus aureus(MRSA) in-fections. Int. J. Antimicrob. Agents32:378 –385.
11.Hunt AC, et al. 2011. Methicillin-resistantStaphylococcus aureus in northeastern Scotland in 2003 to 2007: evolving strain distribution and resistance patterns. J. Clin. Microbiol.49:1975–1978.
12. Jones RN.2006. Microbiological features of vancomycin in the 21st cen-tury: minimum inhibitory concentration creep, bactericidal/static activ-ity, and applied breakpoints to predict clinical outcomes or detect resistant strains. Clin. Infect. Dis.42(Suppl 1):S13–S24.
13. Kehrmann J, et al.2011. Vancomycin MIC creep in MRSA blood culture isolates from Germany: a regional problem? Eur. J. Clin. Microbiol. Infect. Dis.30:677– 683.
14. Kullar R, Davis SL, Levine DP, Rybak MJ.2011. Impact of vancomycin exposure on outcomes in patients with methicillin-resistant Staphylococ-cus aureusbacteraemia: support for consensus guidelines suggested tar-gets. Clin. Infect. Dis.52:975–981.
15. Liu C, et al.2011. Clinical practice guidelines by the Infectious Diseases Society of America for the treatment of methicillin-resistant Staphylococ-cus aureusinfections in adults and children. Clin. Infect. Dis.52:285–292. 16. Lodise TP, et al.2008. Relationship between vancomycin MIC and failure among patients with methicillin-resistantStaphylococcus aureus bactere-mia treated with vancomycin. Antimicrob. Agents Chemother.52:3315– 3320.
17. Lubin AS, Snydman DR, Ruthazer R, Bide P, Golan Y.2011. Predicting high vancomycin minimum inhibitory concentration in
methicillin-resistantStaphylococcus aureusbloodstream infections. Clin. Infect. Dis. 52:997–1002.
18. Moise PA, North D, Steenberg JN, Sakoulas G. 2009. Susceptibility relationship between vancomycin and daptomycin inStaphylococcus au-reus: facts and assumptions. Lancet Infect. Dis.9:617– 624.
19. Moise PA, Sakoulas G, Forrest A, Schentag JJ.2007. Vancomycin in vitro bactericidal activity and its relationship to efficacy in clearance of methicillin-resistant Staphylococcus aureusbacteremia. Antimicrob. Agents Chemother.51:2582–2586.
20. Moore C, et al.2010. USA600 (ST45) methicillin-resistantStaphylococcus aureusbloodstream infections in urban Detroit. J. Clin. Microbiol.48: 2307–2310.
21. Musta AC, et al.2009. Vancomycin MIC plus heteroresistance and out-come of methicillin-resistantStaphylococcus aureusbacteremia: trends over 11 years. J. Clin. Microbiol.47:1640 –1644.
22. Ohkusa T, Miwa H, Endo S, Okayasu I, Sato N. 2004. Helicobacter pylori is a fragile bacteria when stored at low and ultra-low temperatures. J. Gastroenterol. Hepatol.19:200 –204.
23. Patel N, et al.2011. Vancomycin: we can’t get there from here. Clin. Infect. Dis.52:969 –974.
24. Paul M, et al.2010. Importance of appropriate empirical antibiotic ther-apy for methicillin-resistantStaphylococcus aureusbacteraemia. J. Antimi-crob. Chemother.65:2658 –2665.
25. Robert J, Bismuth R, Jarlier V.2006. Decreased susceptibility to glyco-peptides in methicillin-resistantStaphylococcus aureus: a 20 year study in a large French teaching hospital, 1983–2002. J. Antimicrob. Chemother. 57:506 –510.
26. Rojas L, et al.2010. Impact of vancomycin MIC and vancomycin serum levels on the outcome of methicillin-resistantStaphylococcus aureus
(MRSA) bloodstream infection (BSI), abstr K-337. Abstr. Intersci. Conf. Antimicrob. Agents Chemother., Boston, MA.
27. Rybak MJ, et al.2008. Characterization of vancomycin-heteroresistant
Staphylococcus aureusfrom the metropolitan area of Detroit, Michigan, over a 22-year period (1986 to 2007). J. Clin. Microbiol.46:2950 –2954. 28. Sader HS, et al.2009. Evaluation of vancomycin and daptomycin potency
trends (MIC creep) against methicillin-resistantStaphylococcus aureus
isolates collected in nine U.S. medical centers from 2002 to 2006. Antimi-crob. Agents Chemother.10:4127– 4132.
29. Sader HS, Rhomberg PR, Jones RN.2009. Nine-hospital study compar-ing broth microdilution and Etest method results for vancomycin and daptomycin against methicillin-resistantStaphylococcus aureus. Antimi-crob. Agents Chemother.53:3162–3165.
30. Sakoulas G, et al.2004. Relationship of MIC and bactericidal activity to efficacy of vancomycin for treatment of methicillin-resistant Staphylococ-cus aureusbacteremia. J. Clin. Microbiol.42:2398 –2402.
31. Soriano A, et al.2008. Influence of vancomycin minimum inhibitory concentration on the treatment of methicillin-resistantStaphylococcus au-reusbacteremia. Clin. Infect. Dis.46:193–200.
32. Steinkraus G, White R, Friedrich L.2007. Vancomycin MIC creep in non-vancomycin-intermediate Staphylococcus aureus (VISA), vancomycin-susceptible clinical methicillin-resistantS. aureus(MRSA) blood isolates from 2001– 05. J. Antimicrob. Chemother.60:788 –794. 33. Tenover FC. 2010. The quest to identify heterogeneously resistant
vancomycin-intermediateStaphylococcus aureusstrains. Int. J. Antimi-crob. Agents36:303–306.
34. Wang G, Hindler JF, Ward KW, Bruckner DA.2006. Increased vanco-mycin MICs forStaphylococcus aureusclinical isolates from a university hospital during a 5-year period. J. Clin. Microbiol.44:3883–3886. 35. Yoon YK, Kim JY, Park DW, Sohn JW, Kim MJ.2010. Predictors of
persistent methicillin-resistantStaphylococcus aureusbacteremia in pa-tients treated with vancomycin. J. Antimicrob. Chemother.65:1015–1018.