2015 3rd AASRI Conference on Computational Intelligence and Bioinformatics (CIB 2015) ISBN: 978-1-60595-308-3
Research on the Gene Sequence Data Mining Model Based on
Information Theory and Data Dimension Reduction Algorithm
Tianhua Yu
School of Public Health, Jilin University, China
Department of Blood Transfusion, China-Japanese Friendship Hospital of Jilin University, China
Chang Xu
School of Life Sciences, Central China Normal University, China
Xinyu Zhang
Graduate School of Art and Science (Statistics), Columbia University, USA
ABSTRACT: This paper addresses gene sequence data mining model by incorporating information theory and data dimension reduction algorithm. Unlike the previous work focusing more on the issues from the gene’s perspective it-self, we combine the information science and data analysis model to achieve better performance. We firstly discuss the state-of-the-art reviews on the data dimension reduction algorithms to serve as the foundation. Later, we address the information theory into the traditional analysis model to synthetize to data analysis process. Then, we revise the basic data mining model with the assistance of the dimension reduction algorithm and information theory. Finally, we simulate the method and compare it with the other approaches and our algorithm out performs compared with the others.
KEYWORDS: Gene Sequence; Data Mining; Information Theory; Data Dimension Reduction
1 INTRODUCTION
1.1 Background Research
DNA sequence data is one of the main research objects of the bioinformatics. Through the analysis of DNA sequence, scientists can not only solve the existing sequence, sequence and its function to gain the better ability to research new reading sequence roles in organisms, and understand the essence of life. The modern research on the DNA could be categorized as the following aspects: Genome annotation, gene sequence function prediction and the identification of coding and non-coding area.
Data mining is a common technology, for the DNA sequence mining, the combination with characteristics of the DNA sequence mining algorithm design is the key for the DNA sequence data mining technology research and promotes the development of DNA sequence data mining technology research one of the main factors. Biology research indicate that DNA sequence is not random, desultorily string. The primary compositions are the linear combination of the adenine, cytosine, guanine and thymine. Different genes hold different function, as their distribution in the DNA of a certain area is different from general data and the DNA sequence
data has its own characteristics. The modern DNA data mining techniques are generally separated into following forms. (1) DNA sequence clustering mining. To differentiate DNA sequence data set into several clusters, each cluster as similar as possible between the sequences, and similar to other clusters in the sequence as much as possible. (2) DNA pattern mining. Look for the specific repetitive pattern of DNA sequences or multiple sequences of DNA sequence in the collection of the conservative patterns. (3) DNA sequence associated mining. Looking for two or more sequences of the DNA or sequential patterns figures a relationship as well as the close degree, usually in the form of association rule. (4) DNA sequence classification mining. Define a set of DNA sequence data to a class set of the mapping relationship, for unknown class label DNA sequence specified for its class. (5) Abnormal DNA sequence mining. Look for the DNA sequence data set sequence generation mechanism that is very different from the other sequences [1-2].
biological background is the basis of DNA sequence data mining which will help to improve the accuracy of the mining results. In the following figure one, we illustrate the composition of the data mining technique. The rest of the paper is organized as the follows. We first review the current state-of-the-art gene sequence data mining technique, then, we theoretically analyze the information theory and data dimension reduction algorithm as the core part of our model. Later, we conduct numerical simulation on the proposed model to test the feasibility. Finally, we summarize the article and finalize the future research direction.
Figure 1.The composition of the data mining technique.
1.2 Literature Review
In recent years, sufficient research groups have been focusing on the topic of gene sequence data mining. Mehdi used pattern structures to undertake gene expression data mining task in formal concept analysis [3]. They compare two FCA-based methods for mining numerical data and show the equivalent features of the two approaches. Kemal conducted the comparative analysis of bi-clustering algorithms for gene expression data in paper [4]. From their perspective, bi-clustering algorithm has been successfully applied to gene expression data mining that the local model, in which a subset of genes showed a similar expressions level more than a subset of conditions. They analyzed the existing 12 algorithms to find out the optimal solution under the guidance of testing accuracy. In [5], Yang used the data mining technique for discovering the target in gene sequences. They explicated various data mining approaches and their applications to target discovery from text data analysis level. More review work could be found in [6-8].
2 GENE SEQUENCE DATA REDUCTION Data dimension reduction is by linear or non-linear methods to map data from high dimension space to low dimension space, and the low dimensional space data can expresses the high-dimensional space data of much of the information expressed by the process. Along with the increase of the dimension of high-dimensional data with redundancy, high-high-dimensional
sample number needed to and dimension exponential growth holds the corresponding relationship.
Principal component analysis is a kind of linear dimension reduction method that has been widely applied to the analysis of statistical data. Through the calculation of covariance matrix of the original data of the eigenvectors and eigenvalues, PCA transforms multiple variables for a handful of variables, and most of these variables reflect the original information, and we call these integrated variables as main component. The principal component is usually expressed as a linear combination of the original variables, the greater the relevance of the initial data, the main ingredients needed to the less [9-10].
Suppose we havePsample data with the data set matrix defined as the formula 1.
11 12 1
21 22 2
1 2
n n
p p pn
x x x
x x x
X
x x x
=
(1)
Our goal is to find a vector projection that makes original data set get the sum of squares of the largest in the direction of this vector. Sum of squares of all the projection is a function ofudefined as follows.
( )
2(
T) (
T T)
T TJ u = P = X u X u =u XX u (2)
To maximize theJ u
( )
, we use the Lagrange multiplier to create a new objective function.(
,)
T T(
1 T)
J u λ =u XX u+λ −u u (3)
In order to maximize the new value of the objective function, gradient can find it and make it to zero following the condition expressed in formula 4.
2XX uT −2λu=0→XX uT =λu (4)
According to the mentioned equations, we could get the total projection at the condition thatucomes into identical to the feature vectors ofXXTas the follows and we could also get the descending orders of the feature vectors.
( )
2 T T TJ u = P u XX u=u λu=λ (5)
1 2 d
λ ≥λ ≥≥λ (6) Therefore, we find the first principal component and then, it can be found in accordance with the constraint conditions that all projection to maximize the second principal component. To enhance traditional approach, we introduce diffusion mapping method in the objective function [11].
nuclear matrix is also gradually reduce along with diffusion. The first step of the algorithm is normalizing the data set.
(
)
(
2 2)
exp − x / 2σ (7) Through the Gaussian function defined above, we could get the weight matrix.
The standardized matrix within
[
0,1]
is expressed as the follows where thePrevisedrepresents the revised weight vector for further processing [12].( )
(
min)
/ max(
( )
min( )
)
revisedP = P− P P − P (8)
Then, we build up the weight matrix as follows.
(
)
1
n ij ij
W w
=
= (9) The scope of thewijis divided by the threshold
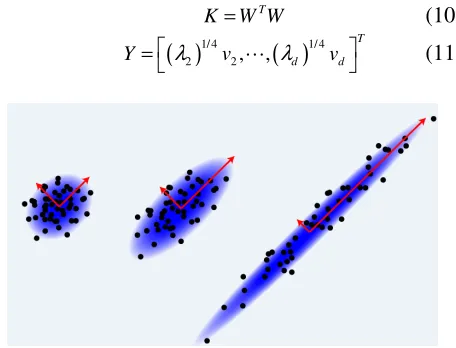
and the selection of threshold value is referring to the definition of the distance between the point and the threshold value, the greater the matrix is sparse. Later, we construct the kernel function and finalize the decomposition procedure as the following equations. The principle of the principal component analysis is also demonstrated in the figure 2.
T
K =W W (10)
(
)
1/ 4(
)
1/ 42 2, ,
T
d d
Y= λ v λ v
[image:3.612.65.293.316.490.2] (11)
Figure 2. The principal component analysis.
3 OUR PROPOSED ALGORITHM
3.1 Information Theory based Gene Analysis Research suggests that genes are mostly not existed independently as a gene expression will promote or inhibit the other gene expression. Because of a gene expression after change the cell's biochemical environment, and will affect a series of gene expression, at the same time, the expression of genes holds a lot of feedback [13]. In order to study the relationship between genes, the gene regulatory network is established. The establishment of the network has a lot of ways, such as the graph method, Boolean network, Bayesian network and differential equation method. But as a result of gene networks are complex nonlinear networks, it will holds very complex mathematical description methods, and meet same functional gene system there may be a
different network structure. The computation of information should satisfy the two conditions: (1) Independent events occur together brought about by the amount of information is the sum of all the events independent of the amount of information; (2) The smaller the probability of the greater the amount of information should be brought by the incident. To measure two source contact close degree, we introduce the two source average mutual information. The normalized mutual information is defined as contacting between mutual information, the greater the source, the greater the vice the less. The formula 12 defines the features.
(
,)
(
)
(
)
(
)
I M N =H M +H N −H MN
(12) Each gene as a source could be divided into several gene expression level intervals and signal from the gene will be for one of these intervals. We must first determine the mutual information threshold and the mutual information is higher than the threshold value of the two genes linked to. Threshold is established after the need to create a probability distribution, according to the experimental data of gene expression data can be obtained by chip technology and the experiment is repeated many times to get the degree of gene expression data statistics [14].
If the system in the moment of the state for the known conditions, the system state of the conditional distribution int>nhas nothing to do with before in the state, the system satisfies the Markov property. We suppose the three sources form the chain and the latter probability is defined by the former one.
X →Y→Z (13)
In the data pre-processing step, we will use the feature for data size reduction. Gene regulation was established based on mutual information network is an effective method for study of gene interactions, through mutual information to establish a connection to reduce influence of nonlinear system of computing complexity, secondly by removing indirect correlation method, the network is greatly simplified.
good features to verify effectiveness of this method in the later part.
Based on hybrid algorithm of the principle of the gene microarray data selection method is first calculated by a scoring function score of each gene, then gene in descending order according to the score, and form a descending order list, then pick out the score value is greater than the threshold value of choice of the genes to the next step, this is the filter method to choose the gene, and then by the filtering method to screen out the gene set on the basis of using ant colony algorithm, through the ant colony algorithm to filter out the gene cluster, with further eliminate redundant genes and thus forming a good classification performance characteristics of the gene.
Microarray data based on hybrid algorithm of genetic selection method has the two main steps. (1) By filtering method for primary gene. (2) Using ant colony algorithm for primary out a second gene screening, so as to screen out distinguishes ability of gene as a feature subset.
Suppose we have the sample size ofm, in each of the specimen withngenes, we use the matrixMto represent the content. The sample of each column represents a matrix and the elements in the matrix represent the gene expression values.
11 12 1
21 22 2
1 2
m
m
n n nm
g g g
g g g
D
g g g
=
(14)
Later, we use the scoring function to express the ability of distinguishing the samples for the gene. To calculate the score value of each gene, the score values according to the descending order of these genes. The calculation of the function is shown below.
( )
2 2
ln 2
i i i i
i i i i
u u
S i σ σ
σ σ σ σ
+ − + −
+ − + −
− +
= +
− (15) Using ant colony algorithm for genetic selection of specific steps is shown as follows. (1) Initialization. Put the primary screening out above genes randomly in a plane, the size of the matrix by the data objects will be put in the matrix. (2) Decision. For each ant, based on the distance between the genes in each little decided to choose or discard a or certain genes and then move to another new little ants.
There are two types of ants that carry genes and not carrying genes of ants, for the two different ants make the corresponding operation. (1) For not carrying genes of ants, the ants on the 2D plane randomly select a small case, and this is not a little empty, punctuated with genetic data, and then select genes from this little operation. (2) To carry the gene of the ants, the ants within yourself now little, and
according to the corresponding probability rejected his already carry the gene, the ant of this action is called gene manipulation. The detailed steps of the whole processes could be found in the [13].
4 EXPERIMENT AND SIMULATION
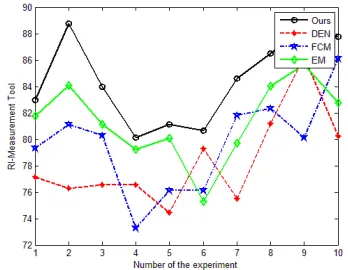
In this section, we numerically simulate the proposed algorithm with the selected database [15-16]. The databases are founded and maintained by Agarwal and Dai, in the figure 3, we compare our algorithm with the traditional EM, FCM and DEN algorithms from the perspective of accuracy. The result reflects that in most of the cases, our method outperforms.
[image:4.612.345.519.259.394.2]In the figure 4, we illustrate the comparison result on the time consuming with the standardized data. The result proves the efficiency of our method.
[image:4.612.342.519.429.566.2]Figure 3. The Data Mining Accuracy Simulation.
Figure 4. The Time Consumption Comparison.
5 SUMMARY AND CONCLUSION
method and the ant colony algorithm to achieve the better performance. In the experiment part, we test the method in the time-scale and accuracy-scale, the result proves that our algorithm performs better compared with the other latest algorithms. In the near future, we plan to conduct mire experimental analysis to test the robustness and the overall feasibility of the proposed approach.
REFERENCES
[1] Siemens, George, and Ryan SJ d Baker. "Learning analytics and educational data mining: towards communication and collaboration." In Proceedings of the 2nd international conference on learning analytics and knowledge, pp. 252-254. ACM, 2012.
[2] Yoo, Illhoi, Patricia Alafaireet, Miroslav Marinov, Keila Pena-Hernandez, Rajitha Gopidi, Jia-Fu Chang, and Lei Hua. "Data mining in healthcare and biomedicine: a survey of the literature." Journal of medical systems 36, no. 4 (2012): 2431-2448.
[3] Kaytoue, Mehdi, Sergei O. Kuznetsov, Amedeo Napoli, and Sébastien Duplessis. "Mining gene expression data with pattern structures in formal concept analysis." Information Sciences 181, no. 10 (2011): 1989-2001.
[4] Eren, Kemal, Mehmet Deveci, Onur Küçüktunç, and Ümit V. Çatalyürek. "A comparative analysis of biclustering algorithms for gene expression data." Briefings in bioinformatics 14, no. 3 (2013): 279-292.
[5] Yang, Yongliang, S. James Adelstein, and Amin I. Kassis. "Target discovery from data mining approaches." Drug discovery today 17 (2012): S16-S23.
[6] Rung, Johan, and Alvis Brazma. "Reuse of public genome-wide gene expression data." Nature Reviews Genetics 14, no. 2 (2013): 89-99.
[7] Yoo, Illhoi, Patricia Alafaireet, Miroslav Marinov, Keila Pena-Hernandez, Rajitha Gopidi, Jia-Fu Chang, and Lei Hua. "Data mining in healthcare and biomedicine: a survey
of the literature." Journal of medical systems 36, no. 4 (2012): 2431-2448.
[8] Robbins, Paul F., Yong-Chen Lu, Mona El-Gamil, Yong F. Li, Colin Gross, Jared Gartner, Jimmy C. Lin et al. "Mining exomic sequencing data to identify mutated antigens recognized by adoptively transferred tumor-reactive T cells." Nature medicine 19, no. 6 (2013): 747-752.
[9] Abdi, Hervé, Lynne J. Williams, and Domininique Valentin. "Multiple factor analysis: principal component analysis for multitable and multiblock data sets." Wiley Interdisciplinary reviews: computational statistics 5, no. 2 (2013): 149-179. [10] Abdi, Hervé, Lynne J. Williams, Domininique Valentin,
and Mohammed Bennani Dosse. "Statis and distatis: optimum multitable principal component analysis and three way metric multidimensional scaling." Wiley Interdisciplinary Reviews: Computational Statistics 4, no. 2 (2012): 124-167.
[11] Wang, Haoxiang, and Jingbin Wang. "An effective image representation method using kernel classification." In Tools with Artificial Intelligence (ICTAI), 2014 IEEE 26th International Conference on, pp. 853-858. IEEE, 2014. [12] Zheng, Xiuwen, David Levine, Jess Shen, Stephanie M.
Gogarten, Cathy Laurie, and Bruce S. Weir. "A high-performance computing toolset for relatedness and principal component analysis of SNP data." Bioinformatics 28, no. 24 (2012): 3326-3328.
[13] Kitsukawa, T., and T. Yagi. "The transfer and transformation of collective network information in gene-matched networks." Scientific reports 5 (2014): 14984-14984.
[14] Brier, Søren. "The transdisciplinary view of information theory from a cybersemiotic perspective." In Theories of Information, Communication and Knowledge, pp. 23-49. Springer Netherlands, 2014.
[15] Dai, Hong-Jie, et al. "T-HOD: a literature-based candidate gene database for hypertension, obesity and diabetes." Database: the journal of biological databases and curation 2013 (2013).