IMPROVE IMAGE REGISTRATION JEFFREY’S
DIVERGENCE METHOD FOR INSUFFICIENT OVERLAP
AREA USING KMEANS++ IN REMOTE SENSED IMAGES
1
MOHAMMAD AWWAD ALNAGDAWI,
2SITI MARIYAM HJ.SHAMSUDDIN ,
2
SITI ZAITON MOHD HASHIM,
3ALA' ABURUMMAN
1
Soft Computing Research Group (SCRG), Faculty of Computing, Universiti Teknologi
Malaysia Skudai, Malaysia
2
UTM Big Data Centre, Ibnu Sina Institute for Scientific and Industrial Research, Universiti
Teknologi Malaysia, Skudai, Malaysia
3
School of Information Technology & Mathematical Sciences, University of South Australia, ,
Adelaide, SA, Australia
E-mail:
1[email protected]
ABSTRACT
In remote sensing, lacking sufficient overlap area is a common problem for image registration. To address this issue, Jeffrey’s divergence intensity-based registration technique was developed. This technique is not robust enough when dealing with multimodal images because it influences by the amount of variance in the data, so it may fail to find the optimal registration. Image segmentation can help to reduce the difference between the multimodal images while keep the salient features. kmeans++ was adopted for image segmentation because of it simple and efficient. This segmentation help Jeffrey’s divergence to be more robust with local intensity variation and get the optimal registration even with smaller overlap area. Comprehensive results were conduct to shows the impact of the proposed method to get a better result to compare with the state-of-the-art methods, Jeffrey’s divergence (JD) and mutual information (MI).
Keywords: K-Means++; Jeffrey’s Divergence; Multimodal Image Registration; Mutual Information; Remote Sensing Image;
1.
INTRODUCTION
Due to the increasing number of satellites, the quantity of remote images has increased very rapidly during last few years. Remote sensing images that are collected using different instruments are basically multimodal images. In order to efficiently utilize the data, collected from remote satellite sensors, many techniques have been developed in past. One of such techniques is Multimodal Similarity Measure. The similarity measure is a technique for measuring the degree of likeness between two images and it gives highest value when the two images are completely similar.
Multimodal similarity measures are a core part of many multimodal image related applications and are classified into three categories based on their information handling capability: entropy-based (intensity-based), features-based and the hybrid.
methods are relatively fast [9], however, they have certain limitations like; less features extraction accuracy in multimodal images [10], difficulty in finding the matched point between the image pair and its implementation. In Hybrid-based technique, the advantages of the intensity and feature-based techniques are combined in order to get faster and more accurate response [9]. One of the major methods of this category is wavelet-based RC (WRC) which employs Multi-modal RC (MRC) in order to match the echogenic structures in MR probabilistic map and US in the wavelet domain [11]. The major disadvantages of using these methods are that they can only deal with narrow scope problems and highly dependent on data representation, which contradicts our aim of building a data independent method for remote image sensing.
Compared to features-based and hybrid, intensity-based multimodal similarity methods are more robust and data independent. In intensity-based similarity measure, mutual information (MI) is a standard reference in the field of automatic multimodal registration [3]. However, MI has a notable limitation that is, it gives higher similarity than the optimal one by a small overlap area as can be seen in Fig. 1. which contradicts the ideal similarity measure that always assumed the highest (optimal) value when the two images are totally matched. Many intensity-based modified MI methods proposed to enhance registration accuracy for multimodal images, such as normalized MI (NMI) [12] in 1999, the regional MI [13] in 2006,
the localized MI [14] in 2008 and the conditional MI [15] in 2010. However, none of them study small overlap region until Xu. X et al proposed Jeffrey’s divergence in 2016. Xu. X et al (2016) study small overlap issue in details in two aspects mathematically and practically. They improve feasible search space for small overlap images. However, JD evaluate using limited verity of samples so the robustness under debate and the method provide relatively small search space with different variety of multimodal images compare to proposed method. Our proposed method overcome robustness and small overlap issue. In experiment
section, we show how our proposed method improves the JD by integrating it with k-means++.
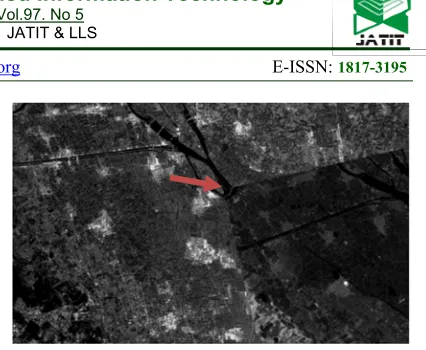
Fig 1 shows an example of small overlap area between the floating and the fixed image that may have happened while searching for the optimal registration. During the searching process for optimal registration, the transformation parameters keeps on changing which can cause the overlap area to get smaller continuously and hence unable to calculate the similarity between the images correctly.
In order to overcome the above-mentioned issue, X. Xu et al [2] proposed Jeffrey’s divergence (JD) similarity measure which is a symmetrical form of MI and is capable of enhancing similarity measure in case of a small area overlapping. As the influence of overlapping area on similarity measure reduces, the
feasible search space gets wider in order to improve the registration result. Furthermore, increase the range of feasible search space will help the registration algorithm to find the correct translation parameters even when the images are vastly misaligned. Hence this technique is adopted in this research work for increasing the feasible search space in remote image sensing.
[image:2.612.317.530.45.220.2]As multimodal intensity-based similarity measures are affected deeply by local intensity variations. For example, mutual information,
[image:2.612.100.523.471.577.2]Fig 1 Example of overlap area between Landsat and PalSAR image
correlation coefficient and correlation ratio similarity methods do not ensure exact similarity when local intensity variation is present [3]. So, depending on the intensity values alone may cause misleading information [16] and hence leads to incorrect results.
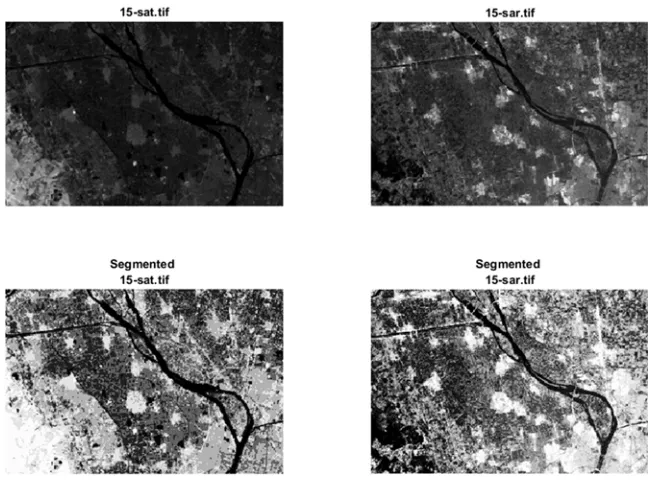
In this paper, we aim to enhance the multimodal similarity measure to deal with small overlap area and local intensity variations more effectively than mutual information and Jeffrey’s divergence. The proposed method is divided in two steps. The first step involves segmenting the image into regions using k-means++ clustering method, to reduce local intensity variation on both images that will
increase the similarity between the images (see second row). In order to reduce the segmentation influence [17], it is then combined with a statistical similarity measure. In the second step, the similarity of the segmented images is calculated by using the JD. JD is basically the state of art of the intensity-based registration and inherits a high robustness when dealing with remote sensing multimodal images. Furthermore, the advantage of the proposed method has been validated by conducting registration experiments between PalSAR and Landsat images.
The rest of the paper is organized as follows. Section 2 describes the proposed similarity measure process with k-means++ segmentation. In Section 3, the image data sets for this study are highlighted along with
experimental methodology. Finally, the conclusions are summarized in Section 4.
2.
SEGMENTED JEFFERY’S
DIVERGENCE
To overcome the ineffectiveness of JD and MI in similarity estimation due to the mentioned reasons, the proposed technique aims to enhance multimodal similarity effectiveness by preprocessing the images using k-means++ then calculating the similarity by using state-of-art similarity estimation
[image:3.612.148.474.261.505.2]method. Both of these steps are discussed in the subsequent sections.
Fig 4 Plot Representing The Similarity Variations Of Jeffrey’s Divergence (J-Div), Mutual Information (MI) And Segmented Jeffrey’s Divergence (Segmented J-Div) Of An Aligned Image Pair When Involving Horizontal Translation, With Landsat As A
Reference Image And Palsar As A Floating Image.
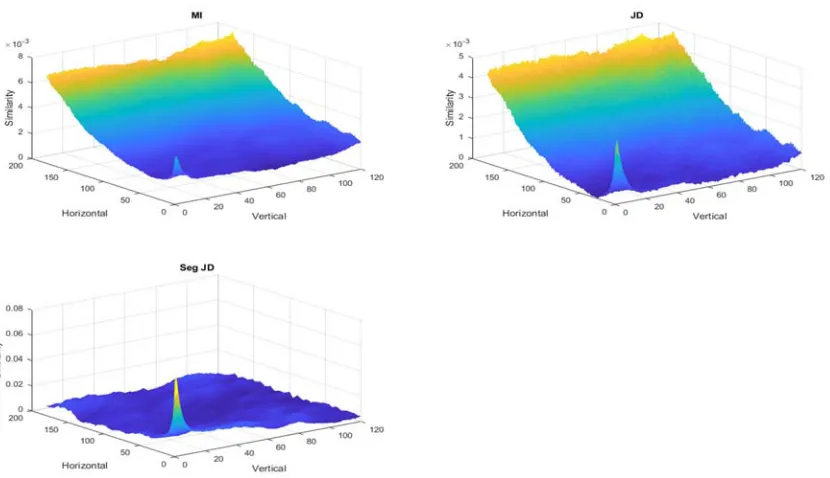
Fig 5 Two-Dimension Surfaces Of Mutual Information (Mi), Jeffery’s Divergence (Jd) And Segmented Jeffery’s Divergence (Seg Jd) When The Images Of The Landsat And Palsar Image Pair Move Away From Each Other In Both Horizontal And Vertical
[image:4.612.81.496.435.674.2]2.1.
Image segmentation using k-means++
Image segmentation is the technique of separating an image into several segments based on its features. The technique consists of identifying complete image pixels based on similar attributes and form clusters of pixels [18]. The simplicity and comparatively low processing time make the segmentation process a favorable choice for enhancement of the similarity measure [19]. The k-means++ clustering algorithm is an unsupervised machine learning algorithm which is used to classify the objects into a predefined K (a positive integer value) number of attribute based clusters [20] [18] [17] [16] [15] [14] [13] [12]. In this work, the k-means++ pixels intensity value is used as an attribute of the image pixel. In order to make the clustering result constant, the k-means++ initial centroid has been placed in the same random position by using seed-based randomization [18]. An example of the remote sensing image before and after applying k-means++ is shown in Fig. 3. The first row represents the original image before segmentation while the second row shows the segmented image. It can be noted that the segmentation reduces the local intensity variation between the images so that they become more similar to each other.
2.2.
Jeffrey’s divergence similarity measure
Jeffrey’s divergence was first proposed in [21] to find the divergence between two distributions. This divergence is a symmetrical Kullback-Leibler divergence and gives more stable between joint probability and the product of marginal probability of two multimodal images, R, and F, as;
𝐽𝐷 𝑅, 𝐹 ∬ 𝑃, 𝑟, 𝑓
𝑃 𝑟 . 𝑃 𝑓 log , ,
. . 𝑑𝑟 . 𝑑𝑓 (1)
where 𝑃 , is the joint probability distribution while 𝑃 and 𝑃 are the marginal probability distributions [22] and are calculated using following equations;
𝑃, 𝑟, 𝑓 ∑ , ,
, (2)
𝑃 𝑟 ∑ (3)
𝑃 𝑓 ∑ (4)
where 𝐻 𝑟 and 𝐻 𝑓 are the histograms of images R and F while 𝐽 is a joint histogram.
To find the joint and marginal probability, the values of compute intensity histogram and joint intensity histogram are required. Intensity histogram is basically the statistical number of pixels for each intensity level present in the image which does not involve spatial information to build a spatial relationship between the two images required to calculate image similarity correctly [2].
To overcome the above-mentioned issue many intensity-based works, such as [2], [17], [23], adopted joint histogram to define the spatial relationship between two image models along with the intensity distribution. Joint histogram is the statistical 2D array which counts the number of times when the pair of intensity value 𝐽 𝑟, 𝑓 at the same corresponding locations of the image pair R and F occurs [2], [22].
The method adopts segmentation to reduce local intensity variation effect [19] while Jeffrey divergence has less overwhelming similarity optimum due to it symmetrical properties [2]. In the next section, we shall be examining this assumption in practice.
3.
EXPERIMENTS AND DISCUSSION
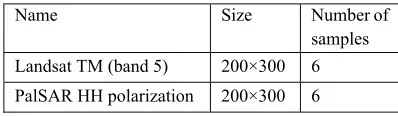
[image:5.612.322.521.541.599.2]To evaluate the performance of the proposed multimodal similarity metric empirically, the remote sensing images collect by different remote sensing sensors has been used. In order to conduct the experimental work the multispectral Landsat TM (band 5) and radar imagery (PalSAR HH polarization) images are used (see Table 1).
Table 1dataset properties
Name Size Number of
samples Landsat TM (band 5) 200×300 6 PalSAR HH polarization 200×300 6
We download our dataset from two websites: EarthExplorer and Alaska Satellite Facility, to get Landsat and PalSAR, respectively. The number of images is six pairs for different locations. Same as Fig 2, each of the six image pairs has the same size (200×300) and all the images are geo-aligned using MapGIS to represent the same geographic region.
three different similarity measures is conducted during horizontal image pair translation and overlap area decrement, as you will see in section 3.2.
3.1.
K value for k-means++
To determine the number of clusters with k-means++ algorithm “trial and error” method is used. It was noticed that with a lower k combination in the image regions, some features of image are lost. Meanwhile, larger k requires more processing time and reduces the region cluster accuracy. The optimal number of clusters (k) based on our experiments is 9 which works well with our dataset.
3.2.
Horizontal transformation
In this section, we test our multimodal similarity methods with image registration. Image registration is a search for the optimal image alignment between two images, reference, and floating image. To find the optimal alignment, the algorithm requires a search function to represent the similarity of the overlap area between the reference and floating images while the floating image is being translated. In a search function, the peak represents maximum similarity (as shown in Fig 4) as well as the ideal transformation parameter. However, insufficient overlap region of two images sometimes produces incorrect similarity value since it is higher than the optimal value.
To overcome the previous issue and to avoid the search function distortion, the effect of insufficient overlap region is reduced in this study. The search function ranges below the optimal similarity (within the green lines in Fig 4) is called as feasible search space [2]. Increasing the feasible search space results in registration functionality improvement. Furthermore, the effect of similarity measure on enhancing the image registration mechanism is studied using a real task. In image registration, the size of the overlap area between the two images has a crucial effect on similarity and therefore, on the search space. In Fig 4, the plot represents the search space for three different similarity measures, Jeffrey’s divergence, MI and segmented Jeffrey’s divergence. Jeffrey’s divergence and MI estimate the similarity between the original images (the first row in Fig 3) while the second row of Fig 3 shows the segmented images of the proposed method after applying k-means++.
As you can see in Fig 4, the proposed method shows less sensitivity to the images overlap area size since it provides the widest feasible search space (within the green line). By maximizing similarity
value, we can reach the optimal alignment using the segmented JD with 13% overlap area only, while Jeffrey’s divergence and mutual information needs at least 53% and 65% overlap area, respectively for the same task and operating conditions.
3.3.
2-D transformation experiment
Fig 5 shows the 2-dimensional variations of mutual information, Jeffery’s divergence and segmented Jeffery’s divergence as the floating images move away from the perfectly aligned position. It can be seen from figures that three similarity measures obtained the peak value when the image pairs are aligned precisely (Horizontal =0 and Vertical =0).
3.4.
Rigid Registration
This registration experiment is conducted as follow, we have the following configurations to keep the registration model running properly: (1) the overlap region of vertical and horizontal transformation between the two images are set to be not less than 70% while searching the transformation parameters; (2) for rotation we choose fix range from -20 to 20 degrees; (3) to remove the search algorithm effect we tried all possible combination of (1) and (2) to find the similarity value for all of them. Consistent with the above analysis, the feasible search space provided by segmented JD is much larger than that of JD and MI. When looking for the transformation parameters in a larger range, segmented JD is more likely to identify the correct registration than other similarity measures.
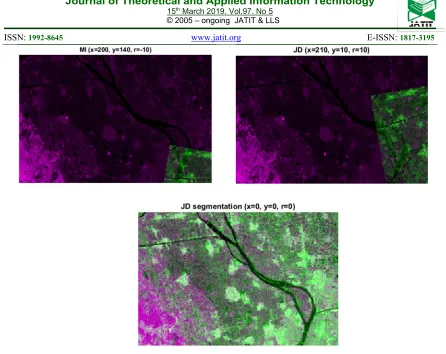
Fig 6 illustrates real experiment outputs for image registration between Landsat and PalSAR images based on MI, JD and segmented JD. The search space we define for our experiments should not exceed 70% of image height for vertical transformation and 70% of image width for horizontal transformation while –20 to 20 degrees for rotation. The search strategy we are
using here is trying all possible combination of these parameters. The output shows clearly the superiority of segmented JD to find the correct registration while the MI and JD fail to register the images. The reason behind these results because of small overlap area between the image. The similarity measure, in this case, obtains incorrect similarity value higher than the optimal one which means incorrect transformation parameters end up with an invalid registration.
3.5.
Feasible search space quantities result
[image:7.612.86.532.41.395.2]In order to quantitatively judge on the feasible search space estimated by segmented JD, we presented a below table to demonstrate the advantage of segmented JD over JD and MI in registering many multimodal image pairs. Table 2 presents the results of six image pairs while the optimal registration is known, i.e. 0-displacement. These images have been downscaled to 300×200 pixels. In the quantitative experiments, we estimate the segmented JD, JD, and MI of the image pair to find similarity values according to pre-defined range, as follow: the search range of vertical translation equal to image width-1 while horizontal translation equal to image height-1 in both directions. We exclude one from image height and
width to avoid zero overlap area. Then the floating images were registered along horizontal translation and vertical translation in pixel unit. Meanwhile, segmented JD, JD, and MI of the transformed image pairs were estimated. The registration continued until the estimated similarity value of the image pair along of pre-defined search range which is (-299 to 299) for horizontal and (-199 to 199) for vertical in our case. Only the values below the optimal similarity value consider within the feasible search space of the transformation parameter. Only within this feasible search space can the correct registration be found based on the maximum similarity value. Similarity measure that can provide larger feasible search space always better than others.
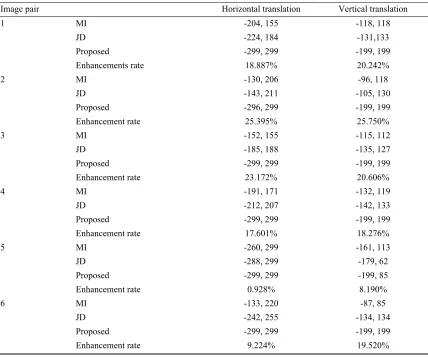
In Table 2, the feasible search space provided by MI, JD and segmented JD in two transformation parameters are presented. Although, the enhancements rate of the proposed method over JD in
[image:8.612.95.523.382.740.2]each component are evaluated along with the length of the feasible search space. For instance, the Image pair #2 in Table 2, the interval of the feasible search space in Horizontal Translation is (-143, 211) and (-296, 299) to JD and segmented JD respectively. For JD according to Horizontal Translation component varies within (-143, 211), we can assure JD obtains its maximum similarity at 0-displacement (the optimum value). The same situation is correct with proposed method segmented JD within interval (-296, 299). The feasible search space of segmented JD is larger than JD by 25.395%, we can say now the proposed algorithm get better result than the state-of-art JD in Horizontal Translation. Notice, we calculate the enhancement rate between our result and JD only because MI results below than JD in all experiments.
Table 2 Comparisons of feasible search space based on six remote sensing image pairs in two translation parameters, shows the of segmented JD in providing larger feasible search space, with Landsat as the reference images and PalSAR as the
floating image.
Image pair Horizontal translation Vertical translation
1 MI -204, 155 -118, 118
JD -224, 184 -131,133
Proposed -299, 299 -199, 199
Enhancements rate 18.887% 20.242%
2 MI -130, 206 -96, 118
JD -143, 211 -105, 130
Proposed -296, 299 -199, 199
Enhancement rate 25.395% 25.750%
3 MI -152, 155 -115, 112
JD -185, 188 -135, 127
Proposed -299, 299 -199, 199
Enhancement rate 23.172% 20.606%
4 MI -191, 171 -132, 119
JD -212, 207 -142, 133
Proposed -299, 299 -199, 199
Enhancement rate 17.601% 18.276%
5 MI -260, 299 -161, 113
JD -288, 299 -179, 62
Proposed -299, 299 -199, 85
Enhancement rate 0.928% 8.190%
6 MI -133, 220 -87, 85
JD -242, 255 -134, 134
Proposed -299, 299 -199, 199
3.6.
Sum up
In Fig. 4, Fig. 5, Fig. 6 and Table 2 we prove that our method can register a different kind of images with wider feasible search space compare to JD and MI which has smaller feasible search space and less robust across verity remote sensing images. As well as, we conduct the experiment qualitatively in section 3.2, 3.3 and 3.4 and quantitatively in section 3.5.
4.
CONCLUSION
MI and JD, as an information theoretic similarity measure, use a statistical intensity relationship across multimodal images to find the similarity measure. These kinds of measures are usually unreliable with small overlap area. Also, they are severe to local intensity variations, such as illumination. Applying image segmentation can enhance their results as it makes the probability relationship more consistent. Segmented JD was introduced as the intensity-based image registration for multimodal images consisting of two stages, namely, image segmentation and similarity estimation. Segmentation uses k-means++ cluster algorithm to segment the image based on pixels intensity, while initial centroid location was chosen by seed-based randomization to keep the output consistent. The second stage used the latest intensity-based similarity measure called Segmented Jeffrey’s divergence as similarity estimation between the segmented images. The research problem we are trying to solve in this paper, intensity variation and small overlap area was solved by adopting the proposed method with good improvement. The proposed method is limited to provide enhancement when rotation present.
The proposed method was empirically explained and its performance was compared with JD and MI methods for multimodal image registration. The results proved the effectiveness of the proposed method over JD and MI in case when overlap region small. More efforts are required to simplify the processing complexity of joint histogram in the similarity stage. Also, the method can be tested with larger dataset to be able to generalize the results in more convincing way.
ACKNOWLEDGMENT
The authors would like to express their gratitude to the Ministry of Higher Education (MOHE) in Malaysia and Universiti Teknologi Malaysia (UTM) for providing the financial support for this research through the HICOE grant (R.J130000.7823.4F965
4J215). The grant is managed by Research Management Center (RMC) at UTM.