A FUZZY LOGIC BASED HYBRID APPROACH FOR
DISEASE INTERPRETATION AND PREDICTION
1MR. RAVI AAVULA, 2DR. R. BHRAMARAMBA
1Associate Professor, Department of C.S.E, Guru Nanak Institutions Technical Campus Hyderabad, (T.S), India
2Associate Professor, Department of Information Technology, GIT, GITAM, Visakhapatnam, (A.P), India
E-mail: [email protected], [email protected]
ABSTRACT
Data mining and data exploration in databases are attracting a big quantity of analytics, research, industry, and media attention these days. Despite the growing number of machine-learning algorithms that have been formed, still to implement them and provide the effectiveness and practicality is much desired. However, in order to help the medical experts to suggest a proper and an efficient medical plan by employing the predicted output of the built model, it is significantly needful to determine which attribute-variables have more significance to the final outcome of cancer patients’ patterns. This paper presents a novel fuzzy logic based hybrid approach for cancer disease interpretation and prediction. The earlier forecast and location of disease cells can be useful in curing the illness in medical applications. We performed the experiments on Breast Cancer Wisconsin Data Set utilizing our proposed method. Experiment analysis in later section prove the efficiency of our proposed method. Proposed method is computationally more efficient than existing methods and, therefore, suited even for massive sized data sets in the biomedical field.
Keywords: Knowledge discovery, Data mining, Machine learning, Medical data, Cancer prognosis.
1. INTRODUCTION
Across a range of disciplines, information is being accumulated and gathered at a forceful speed. there’s a vital want for a recent formation of machine theories, methodologies and tools to support humans in etymologizing helpful information from the fleetly growing amounts of digital information. These approaches and tools are the topic of the rising field of information learning discovery in databases (KDD) [7]. At associate degree abstract level, the KDD domain is considered the development of strategies and systems for building sense of knowledge. At the heart of the process is the utilization of particular data- mining approaches for pattern detection and extraction.
Data mining could also be expressed because the machine-controlled or semi-automated methodology [5] of uncovering
patterns from large electronic datasets
exploitation trained models, wherever the patterns could then be used on new information
for the needs of prediction [20]. The method of ’training’ a model is additionally synonymously represented as a sort of ’learning’ [34][35][36] wherever ’machine-learning’ is outlined because the process of exploring the relationships between predictor and response variables
exploitation computer based statistical
approaches [21][22].A proper knowledge illustration is a fundamental part of all knowledge discovery processes. An implicit representation don’t have a for- mal representation and, hence, the associated knowledge cannot be transferred unambiguously. Data mining and KDD is a vast area of research and there exist plenty of techniques that can produce implicit and explicit knowledge.
Various learning methods are mentioned below:-
k-means clustering - It [23] is a kind of unsupervised learning. Clustering is a key tool for understanding sample data. The objective of this algorithm is to search groups in the data and variable K(number of
groups or cluster). In this algorithm, each data point is assigned with one of K groups on iteration basis. Clustering on data point is based on feature similarity. The output of the K-means grouping algorithm are the K cluster groups centroid and labels for the training data.
Active learning - It chooses a subset of an unstructures and critical occurrence for purpose of labeling. The active learner [24] obtains larger accuracy using diminished number of occurrences.
Kernel-based learning - It is proven to be a dominant methodology to efficiently improve the computational potential.
It is advantageous in terms of that, both
linear as well as non-linear vector kernel functional methods [25] are present to deal with the non-linearity of data in N-dimensional feature space.
Transfer learning - It is mainly beneficial in the sense that it can efficiently apply knowledge, which has been learned previously in order to find solution for new problems in fast and effective manner [26][32].
Distributed learning - This kind of learning inhibits the cluster group configuration, in which one processing thread is al- located to each cluster in plan to perform multi-threading in parallel and distributed manner [27].
Deep learning - Deep learning [28][29] considers more complicated, compartmented statistical patterns of inputs and manages to be robust for new domains as compared to traditional learning systems.
Association rule learning - ARL [30][31] is an approach for locating some attention- grabbing relations between the variables in giant databases.
Representation learning - These
procedures [33] frequently decide to
protect the knowledge in their input however mold it in an exceedingly manner that produces it useful, typically as a pre-processing step before doing classification or predictions, allowing restoration of the inputs returning from the unknown knowledge forming distribution, whereas not being considerably trustworthy for
configurations that are implausible under this
division.
i.
Motivation and ContributionA routine that can reduce the dimensionality
without any pre-knowledge available, simply utilizing the information comprised within the dataset and conserving the essence of the original features is fully desirable. Further an efficient classification process can be employed for the categorization of objects in spatial data. Data mining and Knowledge discovery is having many significant roles in health sector, bio- informatics etc. The earlier forecast and location of disease cells can be useful in curing the illness in medical applications. Much research has already done for early detection of cancer cells and an efficient and timely treatment of breast cancer, however, this problem is still needs further an extensive research. There is the need to convert the available unstructured data into structured format before starting the data mining process. Predictive analytics and modeling
encompasses a variety of statistical
methodologies from machine learning that can analyze the present along with historical facts to make the predictions about the future events. Still, computationally efficient and practically usable techniques for disease prediction and prognosis are need of the hour. The contribution in this paper is summarized as below points
We propose a novel fuzzy logic based
hybrid approach for cancer disease interpretation and prediction.
We performed experiment on standard
dataset and obtained results prove the efficiency of our proposed method.
We have given comparison results of our
proposed system with other existing methods.
ii.
Related WorkGeraldin B. Dela Cruz et al. [6] described about "hybrid data mining method which is based on PCA-GA. Both the classifiers are used as fitness function in GA and also in data mining classification process in which performance is increased". Lao H Saal et al. [8] has described about "BioArray Software Environment (BASE)
and presented the web customizable
bioinformatics solution named as Bio Array Software Environment which is used for the management and analysis of major areas of microarray experimentation". Brenner et al. [9] mainly discussed about "Gene expression analysis by massively parallel signature sequencing (MPSS) on micro bead arrays, which provides unprecedented depth of analysis by allowing application of powerful statistical
•
•
•
• •
techniques". Filippo Piccinini et al. [10] described about "Advanced Cell ClassiïnˇA˛er, the graphical software package for phenotypic analysis". Boukaye et al. [11] discussed "the remote sensing satellite data processing by employing data mining procedures to discover the risk places of epidemic disease". S. Bandaru et al. [12] has given "some significant existing data mining procedures and categorizes them by methodology along with the type of knowledge discovered". S. Sengupta [13] has used "the concepts of particle swarm optimization technique and ARM to design a rule based classification system". Linear discriminate analysis(LDA) is mostly utilized in discriminate analysis for the prediction of the class. Jen et al. [14] employed "the LDA" in their respective work. Decision tree phenomenon is utilized by C T Su et al. [15] and R. Armaanzas [16]. Yeh et al. [17], Fei 2010[18] and Abdi and Giveki [19] have employed "the swarm intelligence method to design their diagnosis model". W.C.Yeh [41], S.W.Fei [42] and Aahan et al. [43] used "k nearest neigh- bour in their predictive models". P.J.Garca et al. [44] and Samanta et al. [45] adopted "LR in their respective research work". Garca et al. [41], Zheng et al. [46] also utilized compelling method in their model for intent of medical diagnosis.
iii.
Organization order of the paperIn remaining paper, section 2 discusses the two significant terms i.e. Data Mining and Knowledge Discovery(KDD). Some significant classifiers are given in section 3. Our proposed sys- tem is given in section 4. Experimental results on standard datasets along with the comparative analysis are given in section 5. Finally, section 6 concludes the paper.
2. DATA MINING AND KNOWLEDGE
DISCOVERY(KDD)
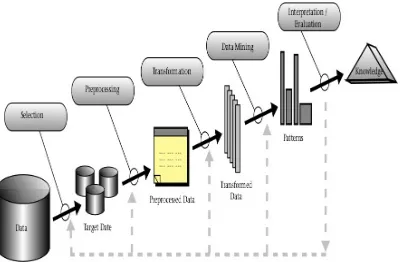
The data-mining element of KDD presently depends heavily on famed techniques from machine learning, and statistics to seek out pat- terns from information within the data-mining step of the KDD method. Algorithms will be scaled to huge information sets and still run with efficiency, however results will be understood and pictured, and the way the man- machine interaction will usefully be sculptured and supported. KDD places viewpoint on finding perceivable patterns which will be understood as helpful or fascinating data. Thus, for instance,
[image:3.612.366.566.238.369.2]neural networks, though a robust modeling tool, are comparatively troublesome to grasp compared to decision trees. Knowledge discovery from information is essentially a applied statistics endeavor. Most data-analytics algorithmic procedures from "statistics, pattern recognition, and machine learning" taken consideration that information aspects are within the main memory and pay very less attention to however the rule formulates if solely restricted views of the information are potential. A general KDD process is represented in fig.1 –
Fig 1. KDD process
Figure 1 Data-Mining Methods
The two high-level primary goals of knowledge mining in practice tend to be prediction and outline. As expressed earlier, prediction involves victimization some variables or fields within the info to predict unknown or future values of alternative variables of interest, and description focuses on finding human- interpretable patterns describing the information. Though the boundaries between prediction and outline aren’t sharp (some of the prophetical models are often descriptive, to the degree that they’re intelligible, and vice versa), the distinction is beneficial for understanding the general discovery goal. The relative importance of prediction and outline for explicit data-mining applications will vary significantly. The goals of prediction and outline are often achieved employing a sort of explicit data-mining strategies.
Classification is process of learning a function that maps (classifies) a knowledge item into one in all many predefined categories (Weiss and Kulikowski 1991 [37] Hand 1981 [38]). Group of classification strategies used as a part of data
discovery applications embody the
of interest in giant image databases (Fayyad, Djorgovski, and Weir 1996 [40]). The bank may wish to use the classification regions to mechanically decide whether or not future loan candidates are going to be given a loan or not.
Clustering is a common descriptive task wherever one seeks to spot a finite set of classes or clusters to explain the info. The classes are often reciprocally exclusive and
complete or incorporates a richer
illustration, like hierarchal or overlapping classes. Samples of clustering applications in an exceedingly data discovery context
embody discovering consistent
subpopulations for customers in marketing databases and distinguishing subcategories of spectra.
3. SIGNIFICANT CLASSIFIERS
Some practically used and efficient classifiers description is as below:-
i.
Artificial Neural NetworkIt is a kind of classifier, whose model design structure and functionality is somewhat similar to human brain structure algorithmic model [1]. For classification problem, the specific structure of neural network changes. First, the training is carried out for ANN, where the topology and number of network nodes present in the hidden layer are decided. Unlike SVM, there is no phenomenon i.e. n-dimensional planes and hyper planes. Still, training of data sets process here is time taking, produces less accurate and efficient results also.
ii.
Support Vector RegressionAs we know that the classification procedure falls into one of the category, either supervised or unsupervised classification. So in the area of machine learning, support vector networks are supervised machine learning models. They are aimed for learning and training procedures for the data used in regression analysis and classification tasks. An SVM [2][3] is the representation of points or attribute values in the plane, along with that the non-linear hyperplanes for seperation task in classification. Some parame ters like gaussian kernals, standard deviation and variance of data, kernel functions are some significant parameters which affect the
performance of SVM.
iii.
Fuzzy Support vector machineIn FSVM, each training point belongs exactly to no more than one particular class [3]. Some points having noise and that could not classified by SVM, are dealt here through FSVM. Pre-knowledge information about data sets is needed, like - stochastic and probabilistic information. Here, several stochastic correlations can be identified.
iv.
Bayesian ClassifiersIn these type of classifiers [4], the
statistical information and probabilistic
knowledge is employed for metadata creation. Here, Bayes’ theorem is utilized with naive independence assumptions among features. Since 1950’s, it is being continuously explored. This is having applications in medical diagnosis
analytics, spatial imaging data, text
categorization etc. This classifier is highly scalable and requires a number of parameters which are linear in number of variable predictors. The excess risk of a general classifier C (possibly depending on some training data) is
defined as R(C) R(CBayes ). Thus this
non-negative quantity is important for assessing the
performance of different classification
techniques.
4. PROPOSED SYSTEM
The detailed description of our proposed sys- tem is given in this section. First we have given the abstract view of our adopted methodology, further we have given detailed algorithmic steps.
i. Research Methodology
Given a cancer disease medical database in either discrete or continuous(real valued) do- main, we process this large dimension data and
×
process. For this, we adopted Multilayer perceptron procedure. Thus there will be computational complexity advantages when this reduced dimension data is further processed for modeling and building prediction system.
ii. Detailed Procedure
The proposed procedure in detailed algorithmic format is described as below –
Further, we adopt classification with reduced disease attributes subset vectors. Here, "forward and backward propagation to compute the gradient for fully-connected neural networks" is employed. A model representation of dense and extensive hidden layers in multilayer perceptron is shown as Fig-2.
Fig-2: Multilayer Perceptron model
4.2.1 Network Layers in multilayer perceptron
Layers in Multilayer perceptron network exist in three types:-
Convolutional layer posses a rectangular
shape grid, consisting of neurons. From the previous layer of each rectangular section, each neuron use to take inputs; the weights in the section are normally equal for each
neuron in this layer. "There may be several
grids in each convolutional layer; each grid takes inputs from all the grids in the previous layer, using potentially different filters".
Max-Pooling layer occurs subsequent to
convolutional layer. This layer posses small rectangular blocks from the convolutional layer and split into sub-granules to generate a single o/p from that particular block. Out of many available ways for this pooling - (i) one way is to take the average (ii) choose maximum or (iii) linear combination of the neurons in particular block, any one way may be adopted. Here, we adopted second choice.
Fully-Connected is considered as the
high-level logic in the NN which is per- formed through fully connected layers. This layer obtains all the neurons in previous layer and makes a connection with each neuron it posses. These layers are normally one-dimensional in nature.
Our filters within the method can simply become suitably dimensioned, and our pooling layers can amend dimension furthermore. Now, we tend to adopt forward and backward propagation to try and do prediction, gradient computations and classification in these neural networks. Both the forward and back- ward propagation scenarios use mainly two layers - Convolutional functional Layer and Max-Pooling functional Layer. are made up of neurons with learnable weights and biases. Each neuron receives several inputs, takes a weighted sum over them, pass it through an activation function and responds with an output.
4.2.1 Forward Neurons Propagation -
• Convolutional functional Layers
– Consider, N N dimensioned neuron
layer.
– Let, m X m dimension filter ωis utilized,
•
•
– Convolutional layer produces out- put with
size as – (N-M+1)x(N-M+1).
– Compute the pre-nonlinearity in- put to
some particular unit xl
in our layer, by summing up the weighted filter components from the antecedent layer cells -
• Max-Pooling functional Layers
– These layers adopts k k sub-space and
outputs a single value, that is maximal in that particular computational space.
– If input layer is a N X N dimensioned layer,
then they produce out- put as a N X N
dimensioned layer, considering each k X k
dimensioned block is shrinked to just a single value through max fn.
– Backward Propagation procedure is below –
4.2.4 Backward Neurons Propagation –
Here, as the error at the current layer is pre-known, we can very easily
compute the deltas ∂E at the current layer.
∂x l i,j
– Now, propagation of errors is performed back
to the previous layer.
– It provides us the above mentioned value for
the error at the preceding layer.
– Padding procedure is performed to fill the
topmost and left edges with zeros.
– k × k dimensioned blocks are attenuated to a single value in forward propagation.
– Further, this single value procures an error
calculated from backwards propagation.
– Forward propagation of the error is done. The
back-propagated errors from max-pooling layers are analogously dispersed by behavior.
– Multilayer perceptron utilizing advanced
neural nets are an architecturally contrasting way of handling dimensioned and ordered data. Multilayer neural nets adopted in our proposed procedure make the assumption of locality (autocorrelation), and hence are more powerful. With less wiring, we have more data per coefficient, which speeds things up and makes for better results.
iii. Analysis
This section presents analysis of the adopted methodology. We discussed here through significant proposition, lemmas and definitions.
PROPOSITION: Consider S = (U, C) an IS
(information system) and suppose P be a family
of the pair wise and disjoint subsets of universe
set U: P = U. Suppose, Q ⊆P and
|Q| > 1. Then it infer [39] –
1. Set BdS(Q, P) is definable in S.
2. If x ∈ BdS(Q, P) then [x]C⊆ S
Q.
3. If x ∈ BdS(Q, P) then for each
p ∈ P.
4. Approxi_Class{S} (P) - {∅} is
partition of U.
Lemma 1: When X is a fuzzified subset of
universe set of objects U and r is defined as
similarity relation on U, then the lower and upper approximations of X are fuzzy sets defined by following set of membership functions:-
µρX (x) = INFy∈U ρ(x, y) →min µX (y)
⇒
Where, →min : is the resituated implication
operator with respect to min. Definition: In an approximation space apr = (U, ρ(U/E)), a pair of granularized
approximation operators apr, , apr: 2U→2U
can be well defined by:
apr(A) = TS{X ∈g(U/E)|X ⊆A} apr(A) ={X ∈g(U/E)|A ⊆X}
Lemma 2: A prime and important issue in big data analysis is to discover the dependencies
among the attributes. A set of attributes Q
depends totally on a set of attributes P, denoted
P ⇒Q, if all attribute values from Q can be
uniquely determined by values of attributes from
P. Dependency is defined in the following
manner -
For P, Q ⊆A, Q depends on P in a degree
k(0 ≤ k ≤ 1), denoted P ⇒k Q, if -
k = γP (Q) = |POSP |U| (Q)|
Where, |S| denotes as the cardinality of set S.
5. EXPERIMENT RESULTS
This section summarizes our experimental analysis carried out on the standard cancer dataset obtained from UCI machine learning repository. Further details are described below -
i. Input Dataset availability and details The input dataset details are as below:-
-Data Set catalog: UCI Machine Learning
Repository;
-Resource name: Breast Cancer Wisconsin
Data Set [47][48][49]; -Number of Attributes: 10; -Total no of instances: 699;
-Data Set Characteristics: Multivariate; -Attribute Characteristics: integer;
-Attributes detail are - "Sample code
number(id number), Clump Thickness,
Uniformity of Cell Size, Uniformity of Cell Shape, Marginal Adhesion, Single Epithelial Cell Size, Bare Nuclei, Bland Chromatin, Normal Nucleoli, Mitoses and Class attribute: (benign & malignant).
This cancer databases was obtained from the University of Wisconsin Hospitals, Madison from Dr. William H. Wolberg. Attributes 2 through 10 have been used to represent in- stances. Each instance has one of 2 possible
classes: benign or malignant".
i. Output Results
In our experiments, system specifications (Software and Hardware) utilized are as - - OS: Ubuntu 16.04 LTS, 64 bit is used; - Java version - "1.8.0 111" is installed. - Our hardware consists 4 GB RAM size.
- Intel core i3 4030U CPU processor @1.90GHz X 4 clock speed.
By utilizing our proposed mechanism, we performed the experiments on Breast Cancer Wisconsin Data Set [47][48][49]. We achieved the attribute subset selection based dimension reduction in an optimal way. Further classification is performed. The output results are given in Table-1.
Results Summary Table Dataset Attr. Avg
classifi cation ac curacy
Precis
ion F- msr MSE Timetaken( in sec.) Unreduc
ed (Origin al)
10 95.85% 0.959 0.959 0.184 1.18
Propose d
method 7 96.14% 0.962 0.961 0.187 0.64
Table-1: Experiment results
The graphical representation is given as Fig-3.
Fig-3: Results Summary Graph
ii. Comparative Performance Analysis
results in Table-2.
Comparative Summary
Method Attr. Avg Classif
ic-tion accura
cy
Precisio
n msr F- MSE Time taken(i
n sec.)
Unreduc ed (Origi-
nal)
10 95.85% 0.959 0.959 0.184 1.18
PCA+J4 8
DT 8 94.98% 0.95 0.95 0.214 0.10
CFS subset eval+GA
9 95.41% 0.954 0.954 0.214 10.48
Propose d
method 7 96.14% 0.962 0.961 0.187 0.64
Table-2: Comparative Analysis table
The comparative analysis shown in Table-2
proves that our proposed method
outperforming than other existing significant methods in terms of various performance parameter values. The system computes the various performance matrices given in Table-2 through statistical calculations using confusion
matrix as input which mainly consists - True
Positive (TP), False Negative (FN), True
Negative (TN) and False Positive (FP). Our
proposed method is able to select minimal length attributes subset and further in the classification it gives comparatively better classification accuracy.
6. CONCLUSION
In present era, machine learning methods are getting much popularity in the classification area because of the effectiveness and accuracy of classification task. Even though the various available techniques are there to classify the massive data in an efficient manner, still there should be further improvement in the methods for more efficiently classifying medical data. At the heart of the process is the utilization of particular data-mining approaches for pattern detection and extraction from medical data.
We obtained motivation through an extensive state-of-the-art review. After listing out some significant methods and known
classifiers, we presented our proposed
framework in detail. Further, we proved the novelty of proposed model through experimental analysis on standard health care dataset.
i.
Limitations and future workThere is an essential need for a fresh genera- tion of computational theories, methodologies and tools to support humans in deriving useful knowledge from the swiftly growing amounts of digital data. The present study of an extensive state of the art review by us triggers the possible future works. The earlier forecast and location of disease cells can be useful in curing the illness in medical applications. We are also aimed to discover techniques which can deal with incomplete and inconsistent decision systems, which may help to further modeling it in that particular scenario.
Data Availability
The multivariate dataset details used to sup- port the findings of this study are included as subsection: V-(i) within this article.
REFERENCES
[1] Tai-hoon Kim, Pattern Recognition Using
Artificial Neural Network: A Review, ISA 2010, pp. 138-148, Springer-Verlag Berlin Heidelberg (2010).
[2] Cortes, C., Vapnik, V. (1995). Support-
vector networks. Machine Learning, 20(3), 273âA˘ S¸ 297.
[3] C.-F. Lin and S.-D. Wang, Fuzzy support
vector machines, IEEE Transactions on Neural Networks, vol. 13, no. 2, March (2002).
[4] Luis Enrique Sucar, Bayesian Classifiers,
Probabilistic Graphical Models, Advances in Computer Vision and Pattern Recognition pp. 41-62, (2015).
[5] Khan U, Shin H, Choi JP, Kim M, Weighted
Fuzzy Decision Trees for Prog nosis of Breast Cancer Survivability. In The Proceedings of the Seventh Australasian Data Mining Conference, Vol- ume 87, Pages: 141-152 .
[6] Geraldin B. Dela Cruz, Bobby D. Gerardo,
[7] D. Lu and Q. Weng, A survey of image classification methods and techniques for improving classification performance, Int. J. Remote Sens., vol. 28, no. 5, pp. 823-870, Jan. 2007.
[8] Saal, L.H., C. Troein, J. Vallon-
Christersson, S. Gruvberger, A. Borg, and C. Peterson. 2002. BioArray Soft- ware Environment (BASE): a platform for comprehensive management and analysis of
microarray data. Genome
Biol.3:SOFTWARE0003.
[9] Brenner, S., M. Johnson, J. Bridgham, G.
Golda, D.H. Lloyd, D. Johnson, S. Luo, S. McCurdy, et al. 2000. Gene expression analysis by massively parallel signature sequencing (MPSS) on microbead arrays. Nat. Biotechnol 18:630-634.
[10]FilippoPiccinini, TamasBalassa, Abel-
Szkalisity, CsabaMolnar, KrisztinaBuzas, Advanced Cell Classifier: User-Friendly
Machine-Learning-Based Software for
Discovering Phenotypes in High-Content Imaging Data, Volume 4, Issue 6, 28 June 2017, Pages 651-655.e5.
[11]Boukaye BoubacarTraore, BernardKamsu-
Foguem, FanaTangara, Data mining
techniques on satellite images for discovery of risk areas, Expert Systems with Applications Volume 72, 15 April 2017, Pages 443-456.
[12] SunithBandaru, Amos H.C.Ng, Kalyan-
moyDeb, Data mining methods for knowl- edge discovery in multi-objective opti- mization: Part A - Survey, Expert Systems with Applications Volume 70, 15 March 2017, Pages 139-159.
[13] ShampaSengupta, Asit K.Das, Particle
Swarm Optimization based incremental classifier design for rice disease predic- tion, Computers and Electronics in Agri- culture,Volume 140, August 2017, Pages 443-451.
[14] R. Veloso, F. Portela, M. F. Santos, ÃA˛.
Silva, F. Rua, A. Abelha, and J. Machado, "A Clustering Approach for Predicting Readmissions in Intensive Medicine," Pro- cedia Technol., vol. 16, pp. 1307-1316, 2014.
[15] C. T. Su, P. C. Wang, Y. C. Chen, and L. F.
Chen, "Data mining techniques for assist- ing the diagnosis of pressure ulcer devel- opment in surgical patients," J. Med. Syst., vol. 36, no. 4, pp. 2387-2399, 2012.
[16] R. ArmaÃs´anzas, C. Bielza, K. R. Chaud-
huri, P. Martinez-Martin, and P. Lar- raÃs´aga, "Unveiling relevant non-motor
ParkinsonâA˘ Z´ s disease severity symp-
toms using a machine learning approach," Artif. Intell. Med., vol. 58, no. 3, pp. 195- 202, 2013.
[17] N. Sharma and H. Om, "Data mining mod- els
for predicting oral cancer survivabil- ity," Netw. Model. Anal. Heal. Informat- ics Bioinforma., vol. 2, no. 4, pp. 285-295, 2013.
[18] K.-J. Wang, B. Makond, and K.-M. Wang,
"An improved survivability prognosis of breast cancer by using sampling and fea- ture selection technique to solve imbal- anced patient classification data.," BMC Med. Inform. Decis. Mak., vol. 13, p. 124, 2013.
[19] H. M. Zolbanin, D. Delen, and A. Hassan
Zadeh, "Predicting overall survivability in comorbidity of cancers: A data mining approach," Decis. Support Syst., vol. 74, pp. 150-161, 2015.
[20] Witten, I.H., Frank, E., 2005. Data Min-
ing: Practical Machine Learning Tools and Techniques. 2nd ed. Elsevier, San Fran- cisco, CA (525 pp.).
[21] Hastie, T., Tibshirani, R., Friedman, J.,
2009. The Elements of Statistical Learning: Data Mining, Inference, and Prediction. 2nd ed. Springer, New York, NY (734 pp.).
[22] Friedman, J., Hastie, T., Tibshirani, R.,
2000. Additive logistic regression: a sta- tistical view of boosting. Ann. Stat. 38, 337-374.
[23] Kanungo T., Mount D. M., Netanyahu N. S.,
Piatko, C. D., Silverman, R., Wu A.
Y. (2002). An efficient k-means clustering algorithm: Analysis and implementation. IEEE Trans. Pattern Analysis and Machine Intelligence. 24(7): 881-892.
[24] Y Fu, B Li, X Zhu, C Zhang. Active
learning without knowing individual in- stance labels: a pair wise label homogeneity query approach. IEEE Trans Knowl Data Eng 26(4), 808-822 (2014).
[25] M. Chen, S. Mao, Y. Zhang, V.C.M. Leung.
Big Data: Related Technologies Challenges and Future Prospects, Springer, Cham, Heidelberg, New York, Dordrecht, London, 2014.
[26] EW Xiang, B Cao, DH Hu, Q Yang.
Bridging domains using world-wide
[27] D Peteiro-Barral, B Guijarro-Berdias. A survey of methods for distributed ma- chine learning. Progress in Artificial Intelligence 2(1), 1-11 (2012).
[28] D Yu, L Deng. Deep learning and its
applications to signal and information processing. IEEE Signal Proc Mag 28(1), 145-154 (2011).
[29] I Arel, DC Rose, TP Karnowski. Deep ma-
chine learning-a new frontier in artificial intelligence research. IEEE Comput Intell Mag 5(4), 13-18 (2010).
[30]
https://www-users.cs.umn.edu/kumar/dmbook/ch6.pdf
[31] Stephen M., Inductive Logic Program-
ming, New Generation Computing, 8 (1991) pp. 295-318.
[32] http://web.stanford.edu/class/cs234/index.h
tml
[33] Yoshua Bengio, Aaron Courville, and Pas-
cal Vincent, Representation Learning: A
Review and New Perspectives,
International Conference on Learning Representations, 1993.
[34] http://researchers.lille.inria.fr/abellet/talks/me
tric/CIL.pdf
[35] Goldberg, David E.; Holland, John H.
(1988). Genetic algorithms and machine learning. Machine Learning.
[36] Michie, D. Spiegelhalter, D. J. Taylor, C.
C. (1994). Machine Learning, Neural and Statistical Classification. Ellis Horwood.
[37] Weiss, S. I., and Kulikowski, C. 1991.
Computer Systems That Learn:
Classification and Prediction Methods from Statistics, Neural Networks, Machine Learning, and Expert Systems. San Francisco, Calif.: Morgan Kaufmann.
[38] Hand, D. J. 1981. Discrimination and
Classification. Chichester, U.K.: Wiley.
[39] Apte, C., and Hong, S. J. 1996. Predicting
Equity Returns from Securities Data with Minimal Rule Generation. In Advances in Knowledge Discovery and Data Mining, eds. U. Fayyad, G. Piatetsky-Shapiro, P. Smyth, and R. Uthurusamy, 514-560. Menlo Park, Calif.: AAAI Press.
[40] Elder, J., and Pregibon, D. 1996. A Statis-