ISSN: www.jatit.org E-ISSN:
4103
ANALYSIS
CONTENT
WITH
K-MEANS
CLUSTERING
FOR
PROFILING
ON
POSTFIX
SERVER
1BAMBANG SUGIANTORO, 2MUSLIM HERI KISWANTO
1, Department of Informatics Engineering, Sunan Kalijaga State Islamic University, Yogyakarta, Indonesia
2Department of Informatics Engineering, University of Duta Bangsa (STMIK), Surakarta, Indonesia
E-mail: 1[email protected], 2[email protected],
ABSTRACT
Clustering email content is a way of categorization of email content based on specific criteria to obtain the category types of emails that can be used for content profiling email. There are several types and content of the email on a mail server that is not desired by the client so that if this occurs continuously will result in performance mail server will be disrupted. Email content profiling was conducted to determine patterns and behavior in the Postfix SMTP email delivery server using the K-means algorithm to know the type of email that can disrupt the performance of the mail server. The profiling process begins with taking the log file content stored on the Postfix Simple Mail Transfer Protocol (SMTP) email server and then analyze the log file using Clustering techniques with K-means algorithm for Profiling email content on Postfix-based mail server using three criteria, namely: message_id, access from and content. Email content analysis was conducted using K-Means Clustering until the 3rd iteration. The clustering results obtained from four categories of e-mail stored in the postfix mail server, that is a true email, fraud, advertising, and emails which do not have a clear purpose. The step profiling using the deductive method to the content of the email that will be obtained information about the type and characteristics of e-mail stored in the Postfix SMTP server. Using the deductive method for the profiling is the solution to assign profiles based on data obtained from the scene, in this case, is the content of the email on the SMTP Mail Server. There are 3 main things done in this deductive technique, namely: analysis of the operation mode refers to the clustering process, as a characteristic signature in email delivery and victimology identified as a victim in email delivery.
Keywords: Profiling, Email, K-Means clustering, Postfix
1. INTRODUCTION
Internet and email have changed the world with annual growth increasing with the development of mobile technology and the email itself [1] [2]. Then from an existing email content, nearly a quarter are expected to e-mail spam or not accepted by the account owner. The rise of cybercrime today also an impact on e-mail users, it also can be seen the number of distribution messages or unwanted data example is junk email [3]. Spam email is one of the most complex problems in the mail service [4] [5]. Email spam is unsolicited email, which is not addressed to specific recipients delivered whether for marketing purposes, or for frauds, and hoaxes [6].
In some cases, the abuse of email, the sender will try to hide real identity to avoid detection. For
example, a false return address or anonymized by routing e-mail through the mail server anonymously, or e-mail content and header information which has been modified to conceal the identity of the sender [7][8]. To find out what content is on the email server for delivery of traffic to occur, the need for categorization of the content [9]. In conducting the necessary categorization data mining technique with clustering algorithms aimed at grouping several data/objects into groups/clusters and create distance between clusters as far as possible [10].
ISSN: www.jatit.org E-ISSN:
4104 mapping and classification of content on the mail server to determine the type of content is useful and junk mail. By using clustering techniques in the categorization of the type of content on Postfix Simple Mail Transfer Protocol (SMTP) server can be used as a solution [11]. Clustering types of content that no mail server can assist in optimizing mailing services, because it will know what is good or link content objects that are often sent to the mail server. In this papers in our research on email content analysis used algorithm Clustering with K-Means. Profiling for the process on the stages Postfix SMTP server is profiling email content with K-Means Cluster on Postfix SMTP Server. The first stage begins by capturing the log file from the SMTP server, and then analyzed K-Means Clustering using a tool RapidMiner, the next stage is profiling the content of the email Profiling methods used in this study is the deductive method, namely setting up profiles based on data obtained from the scene, in this case, is the content of the email on the SMTP Mail Server.
The results we present in this paper is a K-Means Clustering Algorithm can be used to analyze the types of email content on postfix mail server to obtain four categories of email, namely: True email, Scam / Fraud, Promotion and Unpurpose, by classifying each pattern characteristic of mail by 3 criteria, namely message_id, Access from and Content. Profiling email content with K-Means Clustering method can classify types of email content in accordance with the character, so it can be used to filter the content of the category of unsolicited email, promotion, fraud and performance of Postfix SMTP Mail Server work optimally
2. BASIC THEORY 2.1 Data Mining
Data mining is an interactive and interactive process to find patterns or new models are valid, useful and can be understood into a very large database [12] [13]. Data mining provides the search for patterns or trends are desirable in large databases to assist decision making in the future[8]. Where these patterns recognized by a device that can provide a useful analysis and insightful data that can then be studied more closely, which may use other decision support tools [3].
Data mining commonly involves four classes of tasks:
a. Clustering: groups and structures in the data b. Classification: generalizing known structure to
apply to new data. For example, an email program might attempt to classify an email is legitimate or spam. Common algorithms include decision tree learning, nearest neighbor, naive Bayesian classification, neural networks, and support vector machines.
c. Regression: the effort to find a function which models the data with minimal errors.
d. Association rule learning: the search for relationships between variables. For example, a supermarket might gather data on customer purchasing habits. Using association rule learning as market basket analysis, for example, the supermarket can determine which products are frequently bought together and use this information for marketing purposes[4].
2.2 Clustering
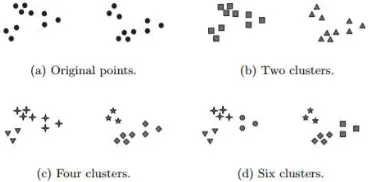
[image:2.612.324.508.479.570.2]Clustering is one of data mining technique that is often used with the aim to identify homogeneous groups or clusters of a set of objects [5] [6]. This technique goes by partitioning the data set into several subsets or groups such that the elements of a particular group have a set of properties that are shared, with a high degree of similarity in one group and the degree of similarity between the groups is low. Clustering process is to divide activity data in a set into groups of data commonality within a group is greater than the similarities that data with data in other groups [7]. Shown in Figure 1 Different ways of clustering the same set of points[8]
Figure 1: Different ways of clustering the same set of points
2.3 Algoritma K-Means
K-means clustering is a method of non-hierarchical clustering of data that categorize the data in the form of one or more clusters/groups [6]. Data that has the same characteristics are grouped into one cluster/group and data that have different characteristics grouped by cluster/group to another so the data are in one cluster/group has a small degree of variation [14] [15] [16]
ISSN: www.jatit.org E-ISSN:
[image:3.612.91.245.154.264.2]
4105 point determined by the distance calculation, K-Means algorithm to perform clustering will do looping until the center point unchanged [16]. In our study is the value of X determined in four categories of email content to be inserted shown in figure 2.
Figure 2: Clustering K-Means algorithm
Explanation of figure 2 is:
a. The true email, is a useful email, meaning that the account owner desires email.
b. Scam / Fraud, an email which aims to commit fraud, of this type can be:
1. Lottery/award 2. Business proposals 3. Requests for favors
4. Financial offers (e.g. loans or credit cards) 5. Phishing
c. Promotion/advertising, an email that aims at offering certain products that are not specified by the user.
d. Unclear Purpose, an email content that has the purpose unclear
2.4 Postfix Mail Server
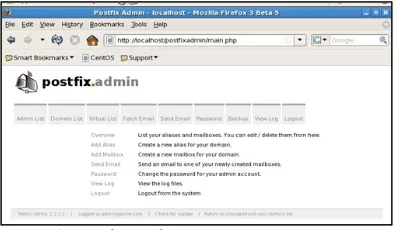
Postfix is software MTA (Mail Transfer Agent) that can receive, forward, and send an email. This a software is open source and works on Unix and Linux OS [17], postfix does not support windows. Postfix installation generally performed to replace send mail program by default has been installed on the operating system Unix or Linux [18]. Postfix can be an option for mail server software for the claimed performance and high speed, besides Postfix also supports the use of the database [18]. Beginning of Postfix named V mailers and IBM Secure Mailer, but for reasons of similarity with existing trademark, then changed to postfix on IBM's own suggestion. Wietse Venema is the creator postfix when he worked at IBM, and until now still being developed.
In terms of security and modularity postfix positioning itself as a rival mail server artificial D. J. Bernstein, both are very concerned about security and modularity. Various people argue about Postfix
[image:3.612.313.511.162.277.2]faster. Postfix is implementing a reliable alternative to Sendmail program has been widely used in UNIX sites. Postfix can do things such as virtual domains, which have multiple domains on the same computer, the Control Host to blacklist certain hosts and many others
Figure 3: Postfix Mail server
Some excellent features of Postfix as a reliable email system [18]:
a. Multi-transport: Postfix designed flexible enough where he can operate in a variety of environments, such as Internet, DECnet, and UUCP, without requiring a virtual domain. Even so, the initial release of Postfix admittedly can only communicate with SMTP and limited to UUCP.
b. Virtual Domains: Adding virtual domains in Postfix is easy enough where we just need to change a single lookup table, while the other of mailers generally require multilevel aliasing or redirect to obtain the same results.
c. Restriction Relay: Postfix provides a way for us to host restriction, the name of which can relay mail through Postfix system, and which one is permitted to enter the mail. For Postfix needs to implement the operation blacklist, RBL lookups, HELO/sender DNS lookups.
d. Table lookups: Postfix does not implement address rewriting language, it employs what is called a table lookups. The tables can be local DB or DB files, or other lookup mechanisms are also quite easy.
3. METHODOLOGY
3.1 Network Topology Scenarios
[image:3.612.312.490.594.715.2]ISSN: www.jatit.org E-ISSN:
4106 Following is an explanation of each component contained in the network topology in Figure 4: a. DNS Server is used to translate a domain name
into an IP address used by the Public Mail Server or otherwise. Design scenarios mail server is registered with the primary domain webmail.herismadelta.id
b. Mail Server, designed as the main server where taking research data. In this design, Mail Server will be set up in a VPS (Virtual Private Server) with Public IP 219.83.63.150 with the following specifications: 1.7 GHz Quad Core Processor, 1 GB Ram, 40 GB hard drive, network card 2 virtual mode, system Debian 6.0.1 operation Systems using Postfix Mail Server, POP3, IMAP4 and web Mail
c. The Internet is a large-scale network that connects computers to the Mail Server client through an ISP that allows users to access the mail service.
d. Router Internet Service Providers, Hardware which serves as a gateway bridging communication with the client computer services through the Internet Mail Server. e. Email Client is a computer used by clients in the
use of the mail service. Applications that are used can be varied, ranging applications such as web browsers Chrome and Mozilla.
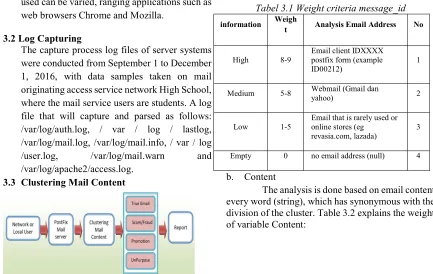
3.2 Log Capturing
The capture process log files of server systems were conducted from September 1 to December 1, 2016, with data samples taken on mail originating access service network High School, where the mail service users are students. A log file that will capture and parsed as follows: /var/log/auth.log, / var / log / lastlog, /var/log/mail.log, /var/log/mail.info, / var / log /user.log, /var/log/mail.warn and /var/log/apache2/access.log.
3.3 Clustering Mail Content
Figure 5 Flow Stages Clustering Mail Content
Explanation of Figure 5 on Clustering Mail Flow Stages Content is the first stage in making an email sent clustering is to describe the area of network and email users who have registered in the system. Then the second phase is to create a policy rule in the Postfix queue so that every email that is sent is always recorded in the log file. The third stage is to force every email that is sent to the recorded content and headers always be a base64 encryption-based file. The fourth step is to perform clustering the content of the email, and the last step is to write a report.
Clustering process based on the number of emails that go out or go to the postfix mail server clustered by type into four categories, namely: a. Email True, symbolized by T
b. Scam / Fraud is fraud email, symbolized by S c. Promotion is the email form of advertising /
promotional event of a product, symbolized by P
d. Unpurpose that email has no clear purpose or misdirected, symbolized by U
Determine the weight of each criterion cluster email content. The criteria used in conducting email cluster consisting of:
a. Message ID
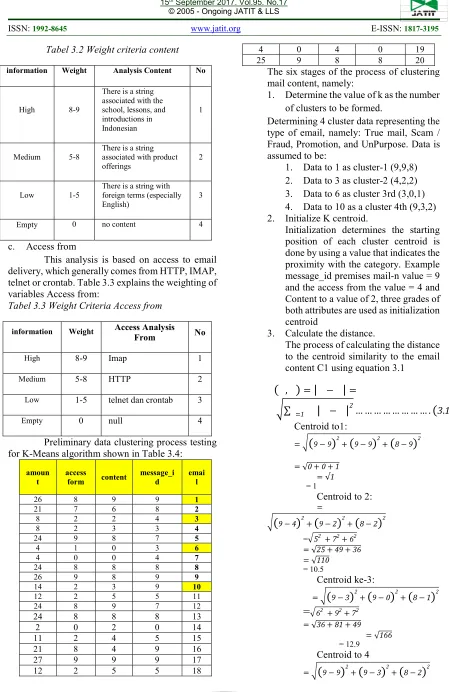
[image:4.612.87.520.438.712.2]Email sent via postfix mail server will be recorded and analyzed based on its address. Table 3.1 explains the weight of variable message_id:
Tabel 3.1 Weight criteria message_id
No Analysis Email Address Weigh
t information
1 Email client IDXXXX
postfix form (example ID00212)
8-9 High
2 Webmail (Gmail dan
yahoo) 5-8
Medium
3 Email that is rarely used or online stores (eg revasia.com, lazada) 1-5
Low
4 no email address (null)
0 Empty
b. Content
ISSN: www.jatit.org E-ISSN:
4107
Tabel 3.2 Weight criteria content
No Analysis Content
Weight information
1 There is a string
associated with the school, lessons, and introductions in Indonesian 8-9
High
2 There is a string
associated with product offerings
5-8 Medium
3 There is a string with foreign terms (especially English)
1-5 Low
4 no content
0 Empty
c. Access from
[image:5.612.82.532.50.742.2]This analysis is based on access to email delivery, which generally comes from HTTP, IMAP, telnet or crontab. Table 3.3 explains the weighting of variables Access from:
Tabel 3.3 Weight Criteria Access from
No Access Analysis
From
Weight information
1 Imap
8-9 High
2 HTTP
5-8 Medium
3 telnet dan crontab 1-5
Low
4 null
0 Empty
Preliminary data clustering process testing for K-Means algorithm shown in Table 3.4:
emai l message_i
d content access
form amoun
t
1 9
9 8
26
2 8
6 7
21
3 4
2 2
8
4 3
3 2
8
5 7
8 9
24
6 3
0 1
4
7 4
0 0
4
8 8
8 8
24
9 9
8 9
26
10 9
3 2
14
11 5
5 2
12
12 7
9 8
24
13 8
8 8
24
14 0
2 0
2
15 5
4 2
11
16 9
4 8
21
17 9
9 9
27
18 5
5 2
12
19 0
4 0
4
20 8
8 9
25
The six stages of the process of clustering mail content, namely:
1. Determine the value of k as the number of clusters to be formed.
Determining 4 cluster data representing the type of email, namely: True mail, Scam / Fraud, Promotion, and UnPurpose. Data is assumed to be:
1. Data to 1 as cluster-1 (9,9,8) 2. Data to 3 as cluster-2 (4,2,2) 3. Data to 6 as cluster 3rd (3,0,1) 4. Data to 10 as a cluster 4th (9,3,2) 2. Initialize K centroid.
Initialization determines the starting position of each cluster centroid is done by using a value that indicates the proximity with the category. Example message_id premises mail-n value = 9 and the access from the value = 4 and Content to a value of 2, three grades of both attributes are used as initialization centroid
3. Calculate the distance.
The process of calculating the distance to the centroid similarity to the email content C1 using equation 3.1
(
,)
=|
−|
=∑
1
|
−|
2… … … .(
3.1)
Centroid to1:=
(
9−9)
2+(
9−9)
2+(
8−9)
2= √0+0+1
= √1 = 1
Centroid to 2:
=
(
9−4)
2+(
9−2)
2+(
8−2)
2 = 52 +72+62= √25+49+36
= √110
= 10.5
Centroid ke-3:
=
(
9−3)
2+(
9−0)
2+(
8−1)
2=
62 +92+72= √36+81+49
= √166
= 12.9 Centroid to 4
ISSN: www.jatit.org E-ISSN:
4108 = 02 +62+62
= √0+36+3649
= √72
= 8.5
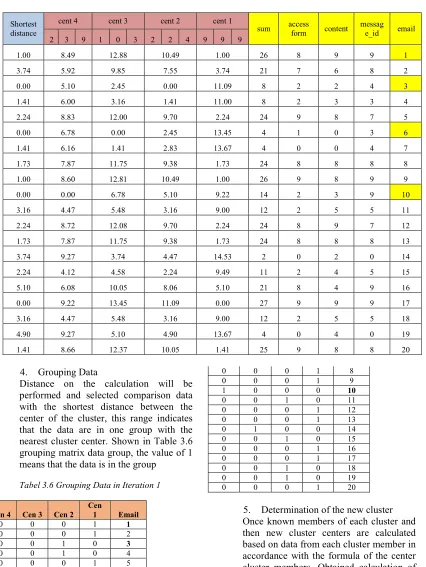
The following is shown in Table 3.5 is a calculation Iteration 1:
Tabel 3.5 Calculation Iteration 1
email messag e_id content access form sum cent 1 cent 2 cent 3 cent 4 Shortest
distance 2 3 9 1 0 3 2 2 4 9 9 9
1 9 9 8 26 1.00 10.49 12.88 8.49 1.00 2 8 6 7 21 3.74 7.55 9.85 5.92 3.74 3 4 2 2 8 11.09 0.00 2.45 5.10 0.00 4 3 3 2 8 11.00 1.41 3.16 6.00 1.41 5 7 8 9 24 2.24 9.70 12.00 8.83 2.24 6 3 0 1 4 13.45 2.45 0.00 6.78 0.00 7 4 0 0 4 13.67 2.83 1.41 6.16 1.41 8 8 8 8 24 1.73 9.38 11.75 7.87 1.73 9 9 8 9 26 1.00 10.49 12.81 8.60 1.00 10 9 3 2 14 9.22 5.10 6.78 0.00 0.00 11 5 5 2 12 9.00 3.16 5.48 4.47 3.16 12 7 9 8 24 2.24 9.70 12.08 8.72 2.24 13 8 8 8 24 1.73 9.38 11.75 7.87 1.73 14 0 2 0 2 14.53 4.47 3.74 9.27 3.74 15 5 4 2 11 9.49 2.24 4.58 4.12 2.24 16 9 4 8 21 5.10 8.06 10.05 6.08 5.10 17 9 9 9 27 0.00 11.09 13.45 9.22 0.00 18 5 5 2 12 9.00 3.16 5.48 4.47 3.16 19 0 4 0 4 13.67 4.90 5.10 9.27 4.90 20 8 8 9 25 1.41 10.05 12.37 8.66 1.41
4. Grouping Data
[image:6.612.106.532.147.714.2]Distance on the calculation will be performed and selected comparison data with the shortest distance between the center of the cluster, this range indicates that the data are in one group with the nearest cluster center. Shown in Table 3.6 grouping matrix data group, the value of 1 means that the data is in the group
Tabel 3.6 Grouping Data in Iteration 1
Email Cen 1 Cen 2 Cen 3 Cen 4 1 1 0 0 0 2 1 0 0 0 3 0 1 0 0 4 0 1 0 0 5 1 0 0 0 6 0 0 1 0 7 0 0 1 0 8 1 0 0 0 9 1 0 0 0 10 0 0 0 1 11 0 1 0 0 12 1 0 0 0 13 1 0 0 0 14 0 0 1 0 15 0 1 0 0 16 1 0 0 0 17 1 0 0 0 18 0 1 0 0 19 0 1 0 0 20 1 0 0 0
ISSN: www.jatit.org E-ISSN:
[image:7.612.116.527.123.355.2]
4109
Tabel 3.7 Iteration Calculation To 2
email message _id conten t access form Su m cent 1 NEW cent 2 NEW
cent 3 NEW cent 4 NEW Shortest distance 8 8 8 4 2 11 2 0 5 9 3 2 1 9 9 8 26 1.56 9.25 11.63 8.49 1.56 2 8 6 7 21 2.15 7.03 8.58 5.92 2.15 3 4 2 2 8 9.48 8.84 3.73 5.10 3.73 4 3 3 2 8 9.42 8.91 3.90 6.00 3.90 5 7 8 9 24 1.42 7.10 10.13 8.83 1.42 6 3 0 1 4 11.82 10.06 3.82 6.78 3.82 7 4 0 0 4 12.08 11.02 5.09 6.16 5.09 8 8 8 8 24 0.47 7.92 10.29 7.87 0.47 9 9 8 9 26 1.10 8.23 11.25 8.60 1.10 10 9 3 2 14 7.90 10.37 7.95 0.00 0.00 11 5 5 2 12 7.56 9.42 6.16 4.47 4.47 12 7 9 8 24 1.79 8.25 10.55 8.72 1.79 13 8 8 8 24 0.47 7.92 10.29 7.87 0.47 14 0 2 0 2 12.99 11.44 5.34 9.27 5.34 15 5 4 2 11 7.98 9.15 5.44 4.12 4.12 16 9 4 8 21 3.80 6.36 8.58 6.08 3.80 17 9 9 9 27 1.68 8.99 11.95 9.22 1.68 18 5 5 2 12 7.56 9.42 6.16 4.47 4.47 19 0 4 0 4 12.24 11.61 6.26 9.27 6.26 20 8 8 9 25 0.79 7.62 10.66 8.66 0.79
6. Repeat steps 3rd (three) if the data is still changing.
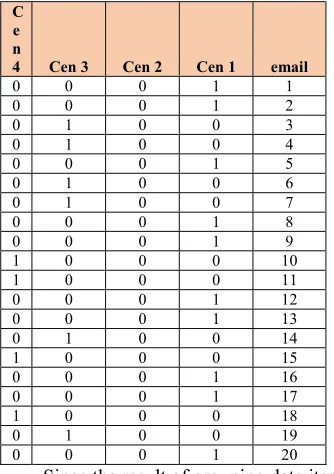
Distance on the calculation will be performed and selected comparison data with the shortest distance between the center of the cluster, this range indicates that the data are in one group with the nearest cluster center. The following are shown in Table 3.8 grouping matrix data group, the value of 1 means that the data is in one group, the following table illustrates the group for grouping data iteration 2:
Tabel 3.8 Iteration Data Grouping to 2
email Cen 1 Cen 2 Cen 3 C e n 4 1 1 0 0 0 2 1 0 0 0 3 0 0 1 0 4 0 0 1 0 5 1 0 0 0 6 0 0 1 0 7 0 0 1 0 8 1 0 0 0 9 1 0 0 0 10 0 0 0 1 11 0 0 0 1 12 1 0 0 0 13 1 0 0 0 14 0 0 1 0 15 0 0 0 1 16 1 0 0 0 17 1 0 0 0 18 0 0 0 1 19 0 0 1 0 20 1 0 0 0
[image:7.612.327.494.405.642.2]ISSN: www.jatit.org E-ISSN:
[image:8.612.125.533.121.348.2]
4110
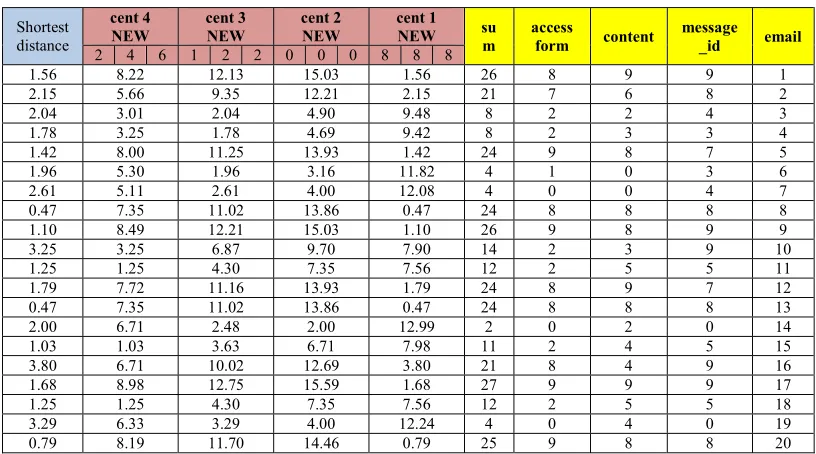
Tabel 3.9 Iteration Calculation To 3
email message _id content access form su m cent 1 NEW cent 2 NEW cent 3 NEW cent 4 NEW Shortest
distance 2 4 6 1 2 2 0 0 0 8 8 8
1 9 9 8 26 1.56 15.03 12.13 8.22 1.56 2 8 6 7 21 2.15 12.21 9.35 5.66 2.15 3 4 2 2 8 9.48 4.90 2.04 3.01 2.04 4 3 3 2 8 9.42 4.69 1.78 3.25 1.78 5 7 8 9 24 1.42 13.93 11.25 8.00 1.42 6 3 0 1 4 11.82 3.16 1.96 5.30 1.96 7 4 0 0 4 12.08 4.00 2.61 5.11 2.61 8 8 8 8 24 0.47 13.86 11.02 7.35 0.47 9 9 8 9 26 1.10 15.03 12.21 8.49 1.10 10 9 3 2 14 7.90 9.70 6.87 3.25 3.25 11 5 5 2 12 7.56 7.35 4.30 1.25 1.25 12 7 9 8 24 1.79 13.93 11.16 7.72 1.79 13 8 8 8 24 0.47 13.86 11.02 7.35 0.47 14 0 2 0 2 12.99 2.00 2.48 6.71 2.00 15 5 4 2 11 7.98 6.71 3.63 1.03 1.03 16 9 4 8 21 3.80 12.69 10.02 6.71 3.80 17 9 9 9 27 1.68 15.59 12.75 8.98 1.68 18 5 5 2 12 7.56 7.35 4.30 1.25 1.25 19 0 4 0 4 12.24 4.00 3.29 6.33 3.29 20 8 8 9 25 0.79 14.46 11.70 8.19 0.79
Distance to the calculation in iteration 3 will do a comparison and have the shortest distance between the data center cluster, this range indicates that the data are in one group with the nearest cluster center. If there are no more clusters are not the same then the iteration process has been completed. In the data classification, 3rd iteration already represents the outcome of the clustering process carried out in the framework of profiling email content. The following will be displayed matrix data to the data classification 3rd iteration, the value of 1 means that the data resides in the data and a value of 0 means that are outside the data
Tabel 3.10 Grouping Data Iteration to 3
[image:8.612.305.494.388.601.2]email Cen 1 Cen 2 Cen 3 Cen 4 1 1 0 0 0 2 1 0 0 0 3 0 0 1 0 4 0 0 1 0 5 1 0 0 0 6 0 0 1 0 7 0 0 1 0 8 1 0 0 0 9 1 0 0 0 10 0 0 0 1 11 0 0 0 1 12 1 0 0 0 13 1 0 0 0 14 0 0 1 0 15 0 0 0 1 16 1 0 0 0 17 1 0 0 0 18 0 0 0 1 19 0 0 1 0 20 1 0 0 0
Table 3:10 above illustrates how a sample data taken for clustering process is carried out and the results obtained for each centroid. Of the 20 samples of the processed data generating centroid as follows:
ISSN: www.jatit.org E-ISSN:
4111 4 RESULT
a. Clustering with RapidMiner
[image:9.612.313.521.88.241.2]At this stage, the file used to cluster with RapidMiner is data_mailku.csv. This CSV file to be imported from RapidMiner then do clusters. The steps carried out in a cluster of email content with RapidMiner shown in Figure 6.
Figure 6 Importing file data-mailku.csv
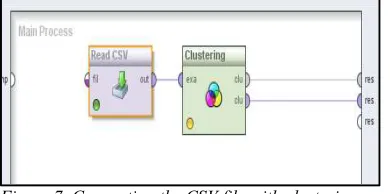
After importing the file data_mailku.csv next steps for the attributes and cluster validation. On the Modeling tab window and Clustering and Segmentation Plug Read CSV Clustering operator as shown in Figure 7.
Figure 7. Connecting the CSV file with clustering
[image:9.612.91.292.176.340.2]Set the number of clusters is required, the process is made 4 clusters consisting of True Mail, Promotion, Scam, and Unpurpose and click the Execute button. The results of the cluster can be seen in the Result Overview which can be displayed in a variety of perspectives. Figure 8 The following is the result of the cluster
Figure 8: Result of the Cluster
Results in RapidMiner describe clustering
cluster seen in Figure 9, the explanation for
each cluster: Cluster 0 as Unpurpose, as
Promotion Cluster 1, Cluster 2 as Fraud,
and Cluster 3 as True email.
Figure 9. The clustering results by TextView
The clustering results can also be presented in various forms, following 10 images comparison of the forms of presentation of cluster process. One is a model that describes the pivot clustering email classification by type of cluster.
Figure 10: Results Clustering with Pivot view
b. Content profiling Email
From the results of email content above clustering, profiling will be conducted by the deductive method is to set the profile based on the data obtained from the scene, in this case, is the content of the email on the SMTP Mail Server. In the deductive method, the author using three main things:
[image:9.612.90.285.434.531.2] [image:9.612.312.522.504.614.2]ISSN: www.jatit.org E-ISSN:
4112 incoming email to the SMTP Mail Server and their characteristics. Referring to the clustering process that uses three criteria, namely: a. Message ID, analysis is done by finding a
common e-mail name format that is often used primarily Indonesian speaking, the more common email formats, it will have a bigger weight value
b. Access from, Analysis is done by finding the method used to access e-mail, for example, Imap, HTTP, telnet or the other. Access emails that have largest weight value are Imap because it is a commonly used method for accessing email.
c. Content, content analysis done by finding similarities string of email content itself compared to category generated email, including email true, scam/fraud, promotion, and unpurpose.
d. Signature, MO Although it can be different, but still there is one thing that must be present in every email access, in this case, the email address itself. Although email submissions via a relay that will disguise their email addresses, but still the main e-mail address will be detected. Signature is always associated with the perpetrator and is associated with motive. So, it will be unbelievably motive closely associated with Signature
2. Victimology
Analysis related to the victim, in this case, is a client of Postfix SMTP server, which in turn will impact on the performance of a machine that server. Of the 153-existing incoming mail on the server profiling results obtained include the category Unpurpose 4.58%, 14.38 Promotion categories, 12,42 Scam / Fraud categories and 68.63 True Email categories. For more details see the following table 4.11:
Tabel 4.11 Results in the percentage of email content classification
No Category
Percentage
1 UnPurpose
4.58%
2 Promotion
14.38%
3 Scam/Fraud
12.42%
4 True Email
68.63%
Email the Postfix SMTP server cluster consisting of four illustrates that not all mail to the mail server desired by the client because there are some emails that are content just as trash/junk email that can interfere with the performance of the server. Suggestions for further research is the amount of mail on the Postfix mail server is reproduced, it should be added elaboration of the email category unpurpose making kind would be more detailed and that the last should be made to the content of e-mail filtering interfere with the performance of Postfix SMTP Mail Server
5. CONCLUSION
ISSN: www.jatit.org E-ISSN:
4113 REFERENCES:
[1] A. Kurniawan, I. Riadi, and A. Luthfi, “Forensic Analysis and Prevent of Cross Site Scripting in Single Victim Attack Using Open Web Application Security Project (Owasp) Framework,” J. Theor. Appl. Inf. Technol., vol. 95, no. 6, pp. 1363–1371, 2017.
[2] E. Husni and A. Wibowo, “E-mail System for Delay Tolerant Network,” 2012. [3] S. Nizamani, N. Memon, M. Glasdam, and
D. D. Nguyen, “Detection of fraudulent emails by employing advanced feature abundance,” Egypt. Informatics J., vol. 15, no. 3, pp. 169–174, 2014.
[4] F. A. Hermawati, Data Mining. Yogyakarta: Andi Offset, 2013.
[5] C. Amanpreet, M. Gaurav, and G. Kumar, “Survey on Data Mining Techniques in Intrusion Detection,” Int. J. Sci. Eng. Res., vol. 2, no. 7, pp. 2–5, 2011.
[6] T. Balasubramanian and R. Umarani, “An analysis on the impact of fluoride in human health (dental) using clustering data mining technique,” in International Conference on Pattern Recognition, Informatics and Medical Engineering (PRIME-2012), 2012, pp. 370–375.
[7] A. Pathak, S. A. R. Jafri, and Y. C. Hu, “The case for spam-aware high performance mail server architecture,” Proc. - Int. Conf. Distrib. Comput. Syst., pp. 155–164, 2009. [8] C. C. Aggarwal and C. K. Reddy, DATA
CLUSTERING Algorithms and Applications. 2013.
[9] M. Bramer, “Introduction to Data Mining,” 2016, pp. 1–8.
[10] P.-N. Tan, Introduction to DATA MINING Second Edition. Boston : Pearson Addison Wesley, 2013.
[11] I. Riadi, J. Eko, A. Ashari, and Subanar, “Log Analysis Techniques using Clustering in Network Forensics,” Int. J. Comput. Sci. Inf. Secur., vol. Vol. 10, N, no. August 2016, 2013.
[12] B. Ratner and D. Ph, Statistical and Machine-Learning Data Mining, no. 1908. CRC Press, 2013.
[13] W. Wu and M. Peng, “A Data Mining Approach Combining K-Means Clustering with Bagging Neural Network for Short-term Wind Power Forecasting,” IEEE Internet Things J., vol. 4662, no. c, pp. 1–1,
2017.
[14] K. Adi, “Detection of the Beef Quality,” pp. 253–259, 2016.
[15] A. Al-Wakeel and J. Wu, “K-means based cluster analysis of residential smart meter measurements,” Energy Procedia, vol. 88, pp. 754–760, 2016.
[16] D. Kulshreshtha, V. P. Singh, A. Shrivastava, A. Chaudhary, and R. Srivastava, “Content-Based Mammogram Retrieval Using k-means Clustering and Local Binary Pattern,” pp. 634–638, 2017. [17] N. K. M. Madi, S. Salehian, F. Masoumiyan,
and A. Abdullah, “Implementation of secure email server in cloud environment,” 2012 Int. Conf. Comput. Commun. Eng. ICCCE 2012, no. July, pp. 28–32, 2012.