ORIGINAL RESEARCH
ADULT BRAIN
Quantitative Susceptibility Mapping of Time-Dependent
Susceptibility Changes in Multiple Sclerosis Lesions
XS. Zhang,XT.D. Nguyen,XS.M. Hurtado Ru´a,XU.W. Kaunzner,XS. Pandya,X I. Kovanlikaya,XP. Spincemaille,XY. Wang, and XS.A. Gauthier
ABSTRACT
BACKGROUND AND PURPOSE: MR imaging studies have demonstrated that magnetic susceptibility in multiple sclerosis lesions is dependent on lesion age. The objective of this study was to use quantitative susceptibility mapping to determine whether lesions with a hyperintense rim, indicative of iron-laden inflammatory cells (rim⫹), follow a unique time-dependent trajectory of susceptibility change compared with those without (rim⫺).
MATERIALS AND METHODS: We studied patients with MS with at least 1 new gadolinium-enhancing lesion and at least 3 longitudinal quantitative susceptibility mapping scans obtained between 1.1 and 6.1 years. Lesions were classified as rim⫹if a hyperintense rim appeared on quantitative susceptibility mapping at any time. A multilevel growth curve model compared longitudinal susceptibility among rim⫹and rim⫺lesions.
RESULTS:Thirty-two new gadolinium-enhancing lesions from 19 patients with MS were included, and 16 lesions (50%) were identified as rim⫹. Quantitative susceptibility mapping rim⫹lesions were larger than rim⫺lesions with gadolinium enhancement (P⬍.001). Among all lesions, susceptibility increased sharply after enhancement to a peak between 1 and 2 years followed by a decrease. The overall suscep-tibility curve height for rim⫺lesions was 4.27 parts per billion lower than that for rim⫹lesions (P⫽.01). Rim⫺lesions demonstrated a higher linear slope relative to rim⫹lesions (P⫽.023) but faster cubic decay relative to rim⫹lesions (P⫽.005). Rim⫺lesions started decaying approximately 2 years earlier compared with rim⫹lesions.
CONCLUSIONS: There was a marked difference in the susceptibility temporal trajectory between rim⫹and rim⫺lesions during the first 6 years of lesion formation. Most rim⫹lesions retain iron for years after the initial lesion appearance.
ABBREVIATIONS:Gd⫽gadolinium; Gd⫹ ⫽Gd-enhancing; GRE⫽gradient recalled-echo; QSM⫽quantitative susceptibility mapping; ppb⫽parts per billion; rim⫹ ⫽rim positive; rim⫺ ⫽rim negative
Q
uantitative susceptibility mapping (QSM)1provideseffi-cient in vivo quantification of susceptibility changes related to iron deposition and helps identify lesions with iron-laden
in-flammatory cells.2It has been widely used in studying multiple
sclerosis and can demonstrate the retention of iron among a sub-set of chronic lesions.3-5Enhancing MS lesions identified on
post-gadolinium (Gd) T1WI in the routine MR imaging surveillance are representative of the breakdown of the blood-brain barrier and acute disease activity.6As the BBB closes, lesions transition to
the chronic stage. However, a subset of lesions may retain a rim of iron-enriched inflammatory cells with ongoing damage. Chronic active MS lesions, characterized by a hyperintense rim on QSM, have been shown to contain iron-enriched, activated microglia and macrophages on histopathology5and have been linked to
greater tissue damage on in vivo MR imaging.7,8Identifying
le-sions likely to retain chronic inflammation would be useful for potential therapeutic targeting. Accordingly, it would be valuable to study MS lesion-evolution trajectories from the time of en-hancement to the chronic lesion stage.
QSM is a phase-based magnetic field deconvolution technique that overcomes blooming artifacts and provides accurate quanti-Received January 29, 2019; accepted after revision April 17.
From the Departments of Radiology (S.Z., T.D.N., S.P., I.K., P.S., Y.W., S.A.G.) and Neurology (U.W.K., S.A.G.) and Feil Family Brain and Mind Research Institute (S.A.G.), Weill Cornell Medicine, New York, New York; Department of Radiology (S.Z.), Tongji Hospital, Tongji Medical College, Huazhong University of Science and Technology, Wuhan, China; Department of Mathematics and Statistics (S.M.H.R.), College of Science and Health Professions, Cleveland State University, Cleveland, Ohio; and Department of Biomedical Engineering (Y.W.), Cornell University, Ithaca, New York.
This work was supported, in part, by grants from the National Institutes of Health (R01NS090464, R01NS104283, R01NS105144, S10 OD021782), the National Multiple Sclerosis Society (RG-1602-07671), and grant UL1 TR000456-06 from the Weill Cor-nell Clinical and Translational Science Center.
Please address correspondence to Susan A. Gauthier, DO, MPH, Department of Neurology, Weill Cornell Medical College, 1305 York Ave, Suite Y217, NY, NY 10021; e-mail: [email protected]
fication and localization of the magnetic sources.1,9,10Previous
QSM studies demonstrated that MS lesion susceptibility increases as the acute, enhancing MS lesion transitions to the nonenhanc-ing stage, reaches a peak in the chronic active stage, and eventually decays away in the final stage of a glia scar.11-14Although these
studies identified a unique time-dependent trajectory in suscep-tibility on QSM, they are limited given the cross-sectional design or short longitudinal follow-up. In addition, a number of recent gra-dient recalled-echo (GRE) imaging studies have identified a unique subpopulation of chronic MS lesions with a hypointense rim on the phase image or a hyperintense rim on QSM. These studies have used histopathologic validation7,15-17and, more recently, PET imaging18
to validate that these lesions have persistent inflammation repre-sented by iron-laden microglia and macrophages. Initial detection and the expected life span of lesions with a hyperintense rim appear-ance on QSM (rim⫹) as well as the time-dependent susceptibility changes among these lesions compared with those without a rim (rim⫺) have yet to be explored, to our knowledge.
The aim of this study was to assess longitudinal tissue-suscep-tibility changes in new Gd-enhancing lesions for up to 6 years after the first identification and to determine whether lesion tra-jectories depend on the development of a hyperintense rim on QSM.
MATERIALS AND METHODS
Patient SelectionThis was a retrospective study of a cohort of 19 patients with relapsing-remitting MS selected from an ongoing, prospective MS MR imaging and clinical data base for which annual MR im-aging scans (including QSM) were collected during 6 years. Pa-tients were selected for this study if they met the following inclu-sion criteria: 1) They had at least 1 new Gd-enhancing (Gd⫹) MS lesion on routine annual MR imaging, 2) had at least 3 longitudi-nal QSM scans (including at the time of Gd⫹lesion detection), 3) had at least 1 MR imaging performed⬎1 year after Gd⫹lesion detection, and 4) had prior MR imaging to ensure that Gd⫹ le-sions were newly formed lele-sions and not re-enhancement of older lesions. MR images were acquired on 2 different imaging plat-forms during the 6 years (GE Healthcare and Siemens, details below). Clinical data collected for patients included the following: age, sex, Expanded Disability Status Scale scores, disease duration, and treatment duration. This study was approved by Weill Cor-nell Medicine institutional review board, and written informed consent was obtained from each subject.
MR Imaging Protocol and Image Processing
Brain MRIs (from 2011 to 2018) were performed on 3T MR im-aging scanners (Signa HDxt, GE Healthcare, Milwaukee, Wiscon-sin, with a product 8-channel head coil; Magnetom Skyra, Sie-mens, Erlangen, Germany with a product 20-channel head/neck coil). The scanning protocol consisted of standard 3D-T1WI, 2D-T2WI, and 3D-T2-weighted FLAIR sequences for ana-tomic structure, multiecho 3D-GRE imaging for QSM, and gadolinium-enhanced 3D-T1WI to detect blood-brain barrier disruption. The acquisition parameters for multiecho GRE were the following: FOV⫽ 24 cm, TR⫽ 49 –58 ms, TE1/ ⌬TE⫽ 4.5– 6.7/4.1– 4.8 ms, last TE ⫽ 47.7 ms, acquisition
matrix⫽320 – 416⫻205–320, readout bandwidth⫽244 –260 Hz/pixel, axial slice thickness⫽3 mm, flip angle⫽15°–20°, acceleration factor⫽2, number of averages⫽1. The scan time was around 4 minutes and 30 seconds (48 slices), varying slightly with brain superior-inferior dimensions.
This QSM imaging protocol was harmonized for both scanner manufacturers and was demonstrated to be reproducible across manufacturers.19,20QSM was reconstructed from complex GRE
images using a fully automated morphology-enabled dipole in-version (MEDI⫹0) method zero-referenced to the ventricular CSF.21All the conventional images (T1WI, T1WI⫹Gd, T2WI,
T2-weighted FLAIR) and the follow-up QSM images were coreg-istered to the baseline GRE magnitude images using the FMRIB Linear Image Registration Tool (FLIRT; http://www.fmrib.ox. ac.uk/fsl/fslwiki/FLIRT).22
Lesion Susceptibility and Volume Measurements
New Gd⫹MS lesions were identified on T1WI⫹Gd images and visually classified on QSM as rim⫹or rim⫺8by 2 independent
reviewers (S.Z., a neuroradiologist with 7 years of experience; S.A.G., an MS neurologist with 16 years of experience).8A lesion
was designated as rim⫹if QSM was hyperintense at the edge of the lesion at any of the longitudinal time points. In addition, at each time point, newly identified Gd⫹lesions were dated as zero years. Lesions were also classified as either “nodular” or “shell” enhancing to estimate the stage of lesion enhancement (ie, early or late stage, respectively).12,23In case of a rare (4 lesions)
disagree-ment, a third neuroradiologist (I.K., with 22 years of experience) determined the lesion type. ROI analysis was performed using ITK-SNAP software (Version 3.6.0; http://www.itksnap.org/) to obtain regional volume and QSM measurements within the iden-tified lesions. To assess a change in lesion volume, we drew lesion ROIs on raw T2-weighted FLAIR images, which had isotropic 1-mm high-resolution images, at all time points. To assess longi-tudinal susceptibility change, we first created ROIs on coregis-tered T2-weighted FLAIR images and then overlaid them on the QSM images at initial lesion detection. When necessary, these ROIs were manually edited to better match lesion geometry on QSM and removal of the central veins (vessel-like structures with hyperintense QSM appearance). The edited ROIs were overlaid onto QSM images from all other subsequent time points. The susceptibility value of the adjacent normal-appearing white mat-ter was subtracted from the lesion susceptibility to offset the in-fluence of local fiber orientation.
Statistical Analysis
A regression model with orthogonal time polynomials was used to analyze the longitudinal evolution of lesion volumes for rim⫹ and rim⫺lesions at the lesion level while adjusting for multiple lesions per patient. The final model included a third-order or-thogonal polynomial, the fixed conditional effect was lesion group, and patient was the random effect.
treatment duration) and multiple lesions per patient (random effects). An eighth-order orthogonal polynomial model was nec-essary to capture the upward and downward evolution of QSM values within lesion groups. Orthogonal polynomials are trans-formations that make the original time terms independent. They allow a precise and robust evaluation of QSM longitudinal differ-ences. Our orthogonal polynomial was defined on the basis of the lesion-age octiles (8 quantiles). This approach accounts for the sample lesion age distribution. The statistical analysis was per-formed using R statistical and computing software (2017; http://www.r-project.org/).
RESULTS
Patient and Lesion Characteristics
Nineteen patients with relapsing-remitting MS (15 women and 4 men, 36.3⫾6.4 years of age) met the inclusion criteria with a total of 32 new T1WI⫹Gd lesions: 9 nodular-enhancing (28%, suscep-tibility, 6.87⫾5.80 parts per billion [ppb]) and 23 shell-enhanc-ing (72%, 12.10⫾8.95 ppb) lesions. Central veins were found in 10 (31%) lesions. Patients had a mean disease duration of 4.8⫾ 3.2 years and an Expanded Disability Status Scale score of 1.4⫾ 1.7. The average time from initial MR imaging to the last MR imaging was 3.6⫾1.4 years (range, 1.1– 6.1 years). Patients were treated with various disease-modifying therapies, and at the time of lesion identification, the cohort was on therapy for a mean duration of 3.5⫾3.0 years.
Lesions with a Hyperintense Rim on QSM
Among the 32 new Gd⫹lesions, 16 lesions (50%) were identified as QSM rim⫹, and evidence of the rim was seen at the time of enhancement for most (81%) of these lesions. Qualitatively, rim⫹lesions were visualized on QSM scans longer than rim⫺ lesions (Figs 1–3), and once identified, the hyperintense rim was consistently found on all subsequent scans in 14 (88%) of the rim⫹lesions (Figs 2and3). Although susceptibility values were lowest at the time of Gd-enhancement, subtle evidence of a rim could be seen in 13 (81%) lesions at that time. The longitudinal evolution of lesion volume, adjusting for multiple lesions per pa-tient and conditioning on lesion group, is presented inFig 4. Fitted volumes derived from the regression model demonstrated that rim⫹lesions (1042.45 mm3) were significantly larger than
rim⫺lesions (322.34 mm3) at the time of Gd-enhancement (P⬍
.001). Following the start of a decline in volume after Gd-en-hancement, rim⫹lesions remained larger than rim⫺lesions and maintained a significant difference at lesion ages 0.5, 2, and 4 years (allP⬍.001) (Fig 4).
Time-Dependent Susceptibility Change in QSM Rimⴙand RimⴚLesions
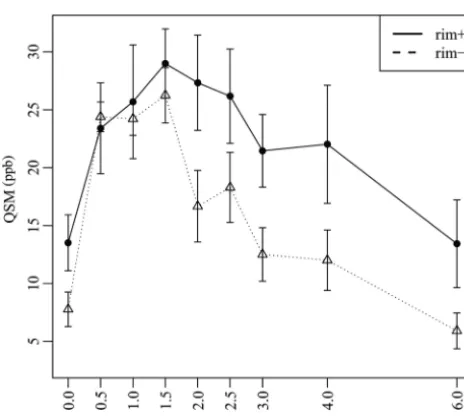
The final model for the longitudinal lesion evolution of QSM values included T2-weighted FLAIR lesion volume and Expanded Disability Status Scale scores at baseline as patient-level fixed ef-fects (allPvalues⬍.05). All lesions demonstrated a continued increase in susceptibility until a peak between 1 and 2 years, which was followed by a reduction during the subsequent years. There was a significant effect of lesion group (rim⫹versus rim⫺) on the intercept term, indicating lower overall QSM values for the rim⫺
lesions relative to the rim⫹(estimate⫽ ⫺4.27, SE⫽1.62,P⫽
.01) (Fig. 5). There was also a significant effect of lesion group on the slope and cubic terms, indicating a faster linear growth rate for rim⫺lesions relative to rim⫹lesions (estimate⫽8.42, SE⫽3.66,
P ⫽.023) as well as significantly faster cubic decay for rim⫺ lesions relative to rim⫹lesions (estimate⫽ ⫺10.64, SE⫽3.75,
P⫽.005). All other effects of lesion group conditioning on time decay were not significantly different between the 2 groups. When considering lesion-volume change, as opposed to baseline lesion volume, as a covariate in the model, a significant association was found between QSM change and volume change (P⫽.002) (for every 1-mm3decrease in volume, there was 0.014-ppb reduction
in QSM). The relationship between susceptibility and volume change was similar among rim⫹and rim⫺lesions (P⬎.27).
[image:3.594.298.532.44.464.2]tibility means for rim⫺lesions demonstrated a decay after 1.5 years with 95% confidence, while the estimated means for rim⫹ lesions remained persistently elevated from lesions 0.5– 4 years of age. A decline in susceptibility is found in rim⫹lesions only after the fourth year.
DISCUSSION
The current study is the longest longitudinal lesion-based sus-ceptibility study examining the time-dependent sussus-ceptibility changes quantified on QSM. Our study indicates that QSM rim⫹ lesions have a unique time-dependent trajectory. Compared with QSM rim⫺lesions, rim⫹lesions start with a higher susceptibility and larger volume and, most important, retain a high-susceptibil-ity value for a number of years after initial detection. This study provides further insight into a distinct subgroup of MS lesions, those that retain a rim of iron-laden inflammatory cells and have the potential for continued tissue damage.7,8,17
QSM provides a noninvasive way to quantify the susceptibility change in MS lesions. The susceptibility increase observed in our study is consistent with previous studies in which a jump in lesion susceptibility occurs as an enhancing lesion evolves to the chronic, nonenhancing state.11-14The initial rise in susceptibility,
occurring within weeks, in active lesions may be related to myelin
digestion,24 and the subsequent increase, which occurs for
months, is more likely related to removal of the myelin debris within macrophages25 and the release of iron.12 A subset of
chronic MS lesions, identified as chronic active or slowly expand-ing lesions, has been described as havexpand-ing a hypocellular lesion center and a rim of activated proinflammatory microglia and macrophages.17,26,27These lesions demonstrate evidence of active
demyelination and axonal destruction at their rim and are thought to contribute to long-term, ongoing tissue damage in MS.8,17,26-28A number of studies have demonstrated that most
microglia and macrophages found at the rim of chronic active MS lesions contain iron.7,15,17,29-32The source of the released iron is
presumed to be derived from damaged myelin and dying oligo-dendrocytes in acute lesions31and functions to promote
polariza-tion of microglia and macrophage cells to a proinflammatory state.30Our data suggest that the development of rim⫹lesions
FIG 2. Longitudinal QSM and T2-weighted FLAIR images of a new Gd-enhancing MS lesion with a QSM rim appearance (rim⫹). This lesion was slightly hyperintense on QSM at the time of Gd-enhancement (mean lesion susceptibility⫽12.74 ppb), became most hyperintense at 3 years (34.28 ppb), and remained hyperintense at 6 years (25.15 ppb).
[image:4.594.296.532.46.457.2] [image:4.594.51.283.48.389.2]may be related to a higher level of iron release, given the higher susceptibility peak among these lesions, and that the extent of iron release potentially contributes to the development of chronic
in-flammation. In addition, we found that rim⫹lesions were much larger at the time of Gd-enhancement, a finding that supports the concept of a larger inflammatory event leading to more demyeli-nation and iron release. Studying the physiologic mechanisms driving iron release within the acute lesion could identify thera-peutic targets aimed at decreasing the occurrence of chronic ac-tive MS lesions.
The reduction of susceptibility in both rim⫹and rim⫺lesions was related to volume loss; however, the relationship was similar and suggests that pathologic differences may explain our observed differences in the decay rate. The relatively abrupt reduction in susceptibility found among the QSM rim⫺lesions would be con-sistent with either loss of iron from the lesion or, more likely, a higher potential for remyelination among these lesions.5
Remy-elination occurring in rim⫺lesions would be consistent with his-tologic observations indicating that iron-enriched microglia and macrophages are not found at the rim of remyelinated or shadow plaques17and in vivo MR imaging studies demonstrating less
tis-sue damage in lesions without a QSM rim.7,8
The slow decay of susceptibility in rim⫹lesions and retention of the hyperintense rim suggest that these lesions retain iron for a number of years; thus, they have the potential for ongoing damage across a more extended period.17Although iron is retained, there
is an eventual reduction in susceptibility, which suggests that most of these lesions have a life span of only a few years before iron loss and probable transition to a chronic inactive state or glia scar.25Histologically, chronic active lesions have been found to be
associated with longer disease duration and to predominantly oc-cur in progressive disease, in which new Gd⫹lesions are infre-quently found.27However, given the aforementioned MR
imag-ing GRE studies, these lesions can occur frequently within the relapsing phase of the disease, and consistent with others,7we
found that lesions that become chronic active lesions can show subtle evidence of a rim at the Gd⫹stage. These combined obser-vations suggest that QSM rim⫹lesions could serve as an early-stage imaging biomarker for disease prognosis, and this possibil-ity warrants further exploration.
QSM has been shown to provide a high level of diagnostic accuracy in predicting Gd⫹lesions.13In this study, most lesions
were shell-enhancing, which are thought to be slightly older en-hancing lesions and tend to demonstrate a slightly higher suscep-tibility.12Most important, the average susceptibility at the time of
enhancement of all lesions (nodular and shell enhancing) was comparable with that of the previous work12and below the cutoff
value of 13.5 ppb for predicting Gd⫹MS lesions.13Furthermore,
GRE imaging is being explored to improve the diagnostic accu-racy of MS based on the identification of a central vein or central vein sign. Most interesting, we found that only one-third of le-sions had a central vein on QSM, which is lower than previously suggested, using a combined T2-weighted FLAIR and T2* se-quence,33and this finding suggests that more research is required
to assess the frequency of the central vein sign in MS lesions. There are limitations in this study. Our lesion sample size is relatively small, and more important, not all lesions were mea-sured at each time point or followed through to all 6 years. We will continue to identify Gd⫹lesions from our ongoing data base to expand on our observations and provide more data to each lesion-FIG 4. Longitudinal lesion-volume evolution changes among QSM
rim⫹and rim⫺lesions. Rim⫹lesions were statistically larger at Gd-enhancement (time⫽0), 0.5, 2, and 4 years (allP⬍.0001).
FIG 5.Longitudinal lesion age-dependent susceptibility time course of QSM rim⫹and rim⫺MS lesions. Rim⫹lesions demonstrate a higher peak QSM value and significantly slower decay rate compared with rim⫺(see text).
The mean susceptibility of rimⴙand rimⴚlesions derived from the regression model
Time (yr)
Rim+ Rim−
No. of Lesions
Mean
(ppb) 95% CI
No. of Lesions
Mean
(ppb) 95% CI
0 16 13.51 11.09–15.93 16 7.77 6.27–9.26
0.5 10 23.40 19.47–27.33 9 24.39 23.11–25.67
1 7 25.69 20.78–30.60 11 24.22 22.79–25.64
1.5 5 28.99 26.00–31.98 5 26.25 23.86–28.63
2 6 27.33 23.22–31.44 7 16.66 13.57–19.76
2.5 8 26.17 22.10–30.25 10 18.29 15.27–21.31
3 7 21.45 18.31–24.59 9 12.50 10.19–14.81
4 8 22.02 16.92–27.12 10 12.00 9.40–14.61
[image:5.594.67.273.44.231.2] [image:5.594.53.285.278.486.2]age year. This expansion will allow further exploration into the effect of individual lesion size as well as patient-specific covariates such as disease duration, disability status, and treatment effect. As mentioned above, very early changes in susceptibility are likely due to a number of pathophysiologic mechanisms at play: Imag-ing the early-stage lesions with frequent and short-interval QSM with the addition of myelin imaging34would allow a more
de-tailed analysis of the early rise in susceptibility. Similarly, a serial MR imaging study with both QSM and myelin imaging during the decay stage can evaluate the loss of iron versus remyelination in rim⫺lesions. Last, our study focused on white matter MS lesions and excluded cortical gray matter lesions, which are known to occur quite frequently in MS and require ultra-high-field imaging for depiction.35 Most interesting, a high-field 7T study using
QSM identified cortical lesions as having a much lower suscepti-bility compared with white matter lesions, suggesting less iron in cortical lesions compared with white matter lesions.36Thus, as we
move forward with 7T QSM MR imaging, we intend to explore and compare the time-dependent susceptibility changes among smaller regions within the lesion (ie, regions of tissue enhance-ment) as well as lesions located within the cortex.
CONCLUSIONS
We identified unique trajectories of lesion time-dependent change in susceptibility among different subtypes of MS lesions. These observations are consistent with the iron-laden inflamma-tory cells present within the rim of a select subset of chronic le-sions retaining iron for a number of years and slowly transitioning to an inactive state. This study supports the use of serial QSM to provide information regarding the current state of inflammation within chronic MS lesions.
Disclosures: Sandra M. Hurtado-Ru´a—RELATED:Grant: National Institutes of Health, Comments: R01-NS104283– 01A1.* Pascal Spincemaille—UNRELATED: Patents (Planned, Pending or Issued): Cornell University,Comments: P.S. is an inventor on a patent describing methods (QSM) used in this work*;Stock/Stock Options: Medim-agemetric LLC. Yi Wang—RELATED: Grant: National Institutes of Health R01NS090464, R01NS095562*;UNRELATED:Patents (Planned, Pending or Issued): Cornell University,Comments: QSM technology patents*;Stock/Stock Options: Medimagemetric LLC,Comments: Cornell spinoff company. Susan A. Gauthier— RELATED:Grant: R01NS104283, R01NS105144*;UNRELATED:Consultancy: one-time Celgene Advisory Board;Grants/Grants Pending: Genzyme, Mallinckrodt.* Thanh D. Nguyen—RELATED:Grant: National Multiple Sclerosis Society, National Institutes of Health.* *Money paid to the institution.
REFERENCES
1. de Rochefort L, Liu T, Kressler B, et al.Quantitative susceptibility map reconstruction from MR phase data using Bayesian regularization: validation and application to brain imaging. Magn Reson Med2010;63:194 –206CrossRef Medline
2. Wang Y, Spincemaille P, Liu Z, et al.Clinical quantitative suscepti-bility mapping (QSM): biometal imaging and its emerging roles in patient care.J Magn Reson Imaging 2017;46:951–71CrossRef Medline
3. Langkammer C, Liu T, Khalil M, et al.Quantitative susceptibility mapping in multiple sclerosis.Radiology2013;267:551–59CrossRef Medline
4. Stuber C, Pitt D, Wang Y.Iron in multiple sclerosis and its nonin-vasive imaging with quantitative susceptibility mapping.Int J Mol Sci2016;17CrossRef Medline
5. Wisnieff C, Ramanan S, Olesik J, et al.Quantitative susceptibility mapping (QSM) of white matter multiple sclerosis lesions:
inter-preting positive susceptibility and the presence of iron.Magn Reson Med2015;74:564 –70CrossRef Medline
6. Filippi M, Rocca MA, Ciccarelli O, et al; MAGNIMS Study Group.
MRI criteria for the diagnosis of multiple sclerosis: MAGNIMS con-sensus guidelines.Lancet Neurol2016;15:292–303CrossRef Medline
7. Absinta M, Sati P, Schindler M, et al.Persistent 7-Tesla phase rim predicts poor outcome in new multiple sclerosis patient lesions. J Clin Invest2016;126:2597– 609CrossRef Medline
8. Yao Y, Nguyen TD, Pandya S, et al.Combining quantitative suscep-tibility mapping with automatic zero reference (QSM0) and myelin water fraction imaging to quantify iron-related myelin damage in chronic active MS lesions.AJNR Am J Neuroradiol2018;39:303–10
CrossRef Medline
9. Li JQ, Chang SX, Liu T, et al.Reducing the object orientation depen-dence of susceptibility effects in gradient echo MRI through quan-titative susceptibility mapping.Magn Reson Med2012;68:1563– 69
CrossRef Medline
10. Zhou D, Liu T, Spincemaille P, et al.Background field removal by solving the Laplacian boundary value problem.NMR Biomed2014; 27:312–19CrossRef Medline
11. Zhang Y, Gauthier SA, Gupta A, et al.Longitudinal change in mag-netic susceptibility of new enhanced multiple sclerosis (MS) lesions measured on serial quantitative susceptibility mapping (QSM).J Magn Reson Imaging2016;44:426 –32CrossRef Medline
12. Zhang Y, Gauthier SA, Gupta A, et al.Quantitative susceptibility mapping and R2* measured changes during white matter lesion development in multiple sclerosis: myelin breakdown, myelin de-bris degradation and removal, and iron accumulation.AJNR Am J Neuroradiol2016;37:1629 –35CrossRef Medline
13. Zhang S, Nguyen TD, Zhao Y, et al.Diagnostic accuracy of semiau-tomatic lesion detection plus quantitative susceptibility mapping in the identification of new and enhancing multiple sclerosis le-sions.Neuroimage Clin2018;18:143– 48CrossRef Medline
14. Chen W, Gauthier SA, Gupta A, et al.Quantitative susceptibility mapping of multiple sclerosis lesions at various ages.Radiology
2014;271:183–92CrossRef Medline
15. Bagnato F, Hametner S, Yao B, et al.Tracking iron in multiple sclerosis: a combined imaging and histopathological study at 7 Te-sla.Brain2011;134(Pt 12):3602–15CrossRef Medline
16. Yao B, Ikonomidou VN, Cantor FK, et al.Heterogeneity of multiple sclerosis white matter lesions detected with T2*-weighted imaging at 7.0 Tesla.J Neuroimaging2015;25:799 – 806CrossRef Medline
17. Dal-Bianco A, Grabner G, Kronnerwetter C, et al.Slow expansion of multiple sclerosis iron rim lesions: pathology and 7 T mag-netic resonance imaging. Acta Neuropathol 2017;133:25– 42
CrossRef Medline
18. Kaunzner UW, Kang Y, Zhang S, et al.Quantitative susceptibility mapping identifies inflammation in a subset of chronic multiple sclerosis lesions.Brain2019;142:133– 45CrossRef Medline
19. Deh K, Kawaji K, Bulk M, et al.Multicenter reproducibility of quan-titative susceptibility mapping in a gadolinium phantom using MEDIⴙ0 automatic zero referencing.Magn Reson Med2019;81: 1229 –36CrossRef Medline
20. Deh K, Nguyen TD, Eskreis-Winkler S, et al.Reproducibility of quantitative susceptibility mapping in the brain at two field strengths from two vendors.J Magn Reson Imaging2015;42:1592– 600CrossRef Medline
21. Liu Z, Spincemaille P, Yao Y, et al.MEDIⴙ0: morphology enabled dipole inversion with automatic uniform cerebrospinal fluid zero reference for quantitative susceptibility mapping.Magn Reson Med
2018;79:2795– 803CrossRef Medline
22. Jenkinson M, Bannister P, Brady M, et al.Improved optimization for the robust and accurate linear registration and motion correction of brain images.Neuroimage2002;17:825– 41CrossRef Medline
23. Gaita´n MI, Shea CD, Evangelou IE, et al.Evolution of the blood-brain barrier in newly forming multiple sclerosis lesions.Ann Neu-rol2011;70:22–29CrossRef Medline
as diamagnetic molecules breakdown: myelin digestion during multiple sclerosis lesion formation contributes to increase on QSM.J Magn Reson Imaging2018;48:1281– 87CrossRef Medline
25. Kuhlmann T, Ludwin S, Prat A, et al.An updated histological clas-sification system for multiple sclerosis lesions.Acta Neuropathol
2017;133:13–24CrossRef Medline
26. Frischer JM, Bramow S, Dal-Bianco A, et al.The relation between inflammation and neurodegeneration in multiple sclerosis brains. Brain2009;132:1175– 89CrossRef Medline
27. Prineas JW, Kwon EE, Cho ES, et al.Immunopathology of second-ary-progressive multiple sclerosis. Ann Neurol 2001;50:646 –57
CrossRef Medline
28. Singh S, Dallenga T, Winkler A, et al.Relationship of acute axonal damage, Wallerian degeneration, and clinical disability in multiple sclerosis.J Neuroinflammation2017;14:57CrossRef Medline
29. Stephenson E, Nathoo N, Mahjoub Y, et al.Iron in multiple sclerosis: roles in neurodegeneration and repair.Nat Rev Neurol2014;10: 459 – 68CrossRef Medline
30. Mehta V, Pei W, Yang G, et al.Iron is a sensitive biomarker for inflammation in multiple sclerosis lesions.PLoS One2013;8:e57573
CrossRef Medline
31. Hametner S, Wimmer I, Haider L, et al.Iron and neurodegenera-tion in the multiple sclerosis brain.Ann Neurol2013;74:848 – 61
CrossRef Medline
32. Lassmann H.The pathologic substrate of magnetic resonance alter-ations in multiple sclerosis. Neuroimaging Clin N Am 2008;18: 563–76CrossRef Medline
33. Maggi P, Absinta M, Grammatico M, et al.Central vein sign differ-entiates multiple sclerosis from central nervous system inflamma-tory vasculopathies.Ann Neurol2018;83:283–94CrossRef Medline
34. Nguyen TD, Deh K, Monohan E, et al.Feasibility and reproducibil-ity of whole brain myelin water mapping in 4 minutes using fast acquisition with spiral trajectory and adiabatic T2prep (FAST-T2) at 3 Tesla.Magn Reson Med2016;76:456 – 65CrossRef Medline
35. Magliozzi R, Reynolds R, Calabrese M.MRI of cortical lesions and its use in studying their role in MS pathogenesis and disease course. Brain Pathol2018;28:735– 42CrossRef Medline