Cellular non-linear network model of microbial fuel cell
Michail-Antisthenis Tsompanasa,∗, Andrew Adamatzkya, Ioannis Ieropoulosb, Neil Phillipsa, Georgios Ch. Sirakoulisc, John Greenmanb
aUnconventional Computing Centre, University of the West of England, Bristol BS16 1QY,
UK
bBristol BioEnergy Centre, University of the West of England, Bristol BS16 1QY, UK cDepartment of Electrical and Computer Engineering, Democritus University of Thrace,
Xanthi 67100, Greece
Abstract
A cellular non-linear network (CNN) is a uniform regular array of locally
con-nected continuous-state machines, or nodes, which update their states
simul-taneously in discrete time. A microbial fuel cell (MFC) is an electro-chemical
reactor using the metabolism of bacteria to drive an electrical current. In a
CNN model of the MFC, each node takes a vector of states which represent
ge-ometrical characteristics of the cell, like the electrodes or impermeable borders,
and quantify measurable properties like bacterial population, charges produced
and hydrogen ion concentrations. The model allows the study of integral
re-action of the MFC, including temporal outputs, to spatial disturbances of the
bacterial population and supply of nutrients. The model can also be used to
evaluate inhomogeneous configurations of bacterial populations attached on the
electrode biofilms.
Keywords: Microbial fuel cells, cellular non-linear network, spatial models
1. Introduction
Microbial Fuel Cells are renewable bioelectrochemical transducers that
con-vert biochemical energy into electricity. MFCs empower simultaneous treatment
of waste-water and energy extraction from mixed organic media via the usage
∗Corresponding author
of microbial consortia as bio-catalysts. In addition to treating anthropogenic
waste and wastewater, whilst producing rather than consuming electrical energy,
MFCs have the ability of degrading toxic pollutants and the advantage of not
burdening further the carbon cycle in the way fossil fuels do [1]. They bear some
resemblance to conventional fuel cells, given that they comprised two
compart-ments, the anode and the cathode, divided by a Proton Exchange Membrane
(PEM), where oxidation and reduction reactions occur. A major difference is
that MFCs use abundant, renewable fuels, such as organic substrates, that are
metabolised by bacteria, whereas chemical fuel cells are fuelled by pure
com-pounds (which could be toxic as methanol or explosive as hydrogen) oxidised by
precious metals. As a result, their inexpensive functionality and maintenance
designate MFCs as a viable solution for producing energy in isolated areas.
Despite the fact that MFCs were proposed more than a century ago [2], it is
still a subject of rigorous research, due to the increased power densities that have
been achieved in the last decade. In addition, since they operate in ambient
con-ditions (ambient environment temperature, atmospheric pressure, neutral pH)
and given the aforementioned advantages, they can efficiently support systems
for applications like remotely deployed sensors and robotics [3]. Nonetheless,
their analysis in copious conducted experiments reveal significant limitations on
their performance due to low microbial activity (low growth rate or metabolic
rate, due to non-optimal growth conditions or unsuitable microcosm —
insu-ficient anodophiles), ohmic losses, mass transfer limitations on the electrode
surfaces, non-optimised electrode architectures and transfer potential through
the PEM. The process of defining the factors that limit the performance of
MFCs can lead to more efficient designing methods. Although some techniques
used in the conventional chemical fuel cells could be adopted, they can not be
expected to provide the same results due to the fundamental differences of the
systems particularly due to the biological nature.
MFCs are complicated devices that contain bio-electrochemical reactions,
mass and charge balance principles, biotic or abiotic transformation processes.
ap-proach with background in electrochemistry, microbiology, physics and
engi-neering. On top of that, there are numerous differentiations in the MFCs
stud-ied which range from their configurations (having two chambers separated by
a PEM or a membrane-less single-chamber MFCs) to the type of their
incor-porated mechanism of donating electrons to the anode electrode (mediated or
mediator-less MFCs).
Given the complexity of these systems, the number of parameters that affect
their outputs and the costs in time and money needed to perform laboratory
experiments, the development of computerised mathematical models simulating
these systems is of great importance. The implementation of modelling
tech-niques can contribute to the investigation of the principles covering their
oper-ation and affecting their performance, producing better arrangement designs of
MFCs and working circumstances.
To address spatial dynamics of biophysical processes in a MFC we designed a
cellular non-linear network (CNN) model. A CNN is a uniform regular array of
locally connected continuous-state machines, or nodes, which update their states
simultaneously in discrete time [4, 5]. Essentially, CNN is a finite-difference
scheme with time step one. A CNN is a subset of cellular automata (CA). A
CA is the same as CNN but states of nodes are discrete. CA and CNN are often
mixed, many researchers do not differentiate these two types of machines. What
is imitated in CA can be imitated in CNN and both offer powerful modelling
capability as well. There are several studies published on CNN/CA or hybrid
models of reaction-diffusion [6, 7, 8, 9, 10, 11, 12, 13, 14, 15] and prototyping
of chemical computers [16, 17, 18, 19, 20, 21] and molecular computers [22],
spatial dynamics of bacterial colonies [23, 24, 25, 26, 27]. Other approaches
relevant to CNN modelling of MFCs are CA models of fuel loading patterns
in nuclear reactors [28], dynamics of nuclear reactors [29, 30, 31, 32], neutron
transport [33], waste water treatment by aerobic granules [34], sequencing batch
reactor [35], fluid flow in a porous medium [36].
The proposed CNN-based model simulates biochemical and electrochemical
au-thors’ knowledge this is the first attempt to simulate the outputs of a MFC with
a CNN model. Despite the fact that the application of CNNs have been widely
used to simulate several biological, chemical and physical processes as indicted
previously, the novelty of this study can be pinpointed in the fact that all the
processes and, thus, the behavior of a batch-fed MFC has not been previously
presented in a single CNN lattice with a local state comprised of all the critical
quantities (several chemical species concentrations, biomass concentrations and
current produced). Such a model will allow for a detailed analysis of integral
out-comes of spatial processes inside MFCs, including a possible uneven distribution
of nutrients in the MFC chamber, patterns of bacterial population in biofilms
covering electrodes and distributions of diffusing metabolites. Nonetheless, the
use of CNN as the mathematical basis for the model allows the employment of
the inherent fully parallel nature of synchronised locally interconnected simple
unities. The subject device is a two chamber MFC with the presence of
elec-troactive microbes in suspension in the bulk liquid and forming biofilms on the
surface of a planar anode electrode and assuming electron transfer from the
mi-crobes to the electrode with the use of an externally added diffusible chemical
mediator. That mechanism can be differentiated to emulate various types of
MFCs, that will be the aim of future works. Nonetheless, the present study can
lead towards exploiting the parallelism of the simulating tools and, as a result,
intensively accelerating the simulation of MFCs, by the implementation of the
CNN-based algorithm on parallel hardware, as illustrated in [37, 38].
2. Previous work
Despite the intense investigation in the laboratory experimental field to
op-timise the performance of MFCs, results from computational models are not
derived with the same rate. Moreover, the few models developed are targeting
specific MFC configurations each and are so strictly specified that they become
impractical for implementation on different configurations. The first model
re-ceptor of electrons. That model analysed the correlation of the concentration
of the external mediator with the higher possible power output.
The authors of [40] introduced the simulation of a MFC with an added
medi-ator and several populations of suspended and attached biofilm microorganisms.
The model was developed on two or three dimensions providing the resultant
current produced by homogeneous or not biofilms. The results were derived by
taking into account several parameters, like the content of different microbial
species, the amount of suspended microbes compared with ones attached, the
potential of the mediator, the initial concentrations of the mediator and the
substrate and many more. The results provided were compared with
experi-mental data from a batch MFC fed with acetate and inoculated with Proteus
and found in a good agreement.
The model presented in [40] was updated in [41] with the incorporation
of International Water Association (IWA’s) anaerobic digestion model (ADM1)
[42]. The coexistence of several types of methanogenic and electroactive bacteria
is simulated, taking into account whether they are suspended or attached to
the anode electrode. A batch MFC was simulated to test the effects of the
electrical circuit on the population of the microorganisms and the results were
compared with laboratory data. The model is also based on a one, two or
three dimensions partial differential equations system to represent the spatial
distribution of solutes in the biofilm.
In [43], a model simulating a MFC with only suspended microorganisms
and externally inserted mediator was studied. In this model the conservation
of mass for the dissolved ingredients has a basic role. The biomass growth is
not studied in that model while a batch mode MFC which was periodically fed
was simulated. The results were compared with laboratory data from MFCs
inhabited with suspendedProteus cells and incorporating thionine as a
media-tor, proving accurate representation of the system. The model introduces the
ideas of endogenous metabolism or intracellular substrate storage to justify a
small amount of current present between the feeding pulses. As the conditions
solution of the algorithm’s equations was presented. Some key parameters of
the equations used were extracted from fitting the outputs to the experimental
data, while some others were estimated.
Another study [44] proposing a mathematical model for MFCs, was based
on two dimensional macroscale mass balance equations and microscale biofilm
evolution. The model contains hydrodynamic calculations and mass and charge
balances through diffusion, convection and electromigration to simulate the
cur-rent output, species concentrations and pH distributions throughout the anode.
Nonetheless, the possibility of depicting on two or three dimensions irregular
biofilm and electrodes configurations and simulate the effects on the MFC
oper-ation and outputs was provided. The model was used to reproduce the system’s
outputs such as its pH distributions, the effect of multiple communities of
elec-troactive, methanogenic and fermentative bacteria existing in the anode biofilm
and the effect of the flow over or through complex electrodes.
The authors of [45] presented a model simulating a MFC with inspiration
of models simulating chemical fuel cells. A mediator-less two-chamber
con-figuration was studied in steady and dynamic states, with the combination of
biochemical reactions, ButlerVolmer expressions, mass and charge balance
equa-tions. Also, given the assumption that the anode is under anaerobic conditions
the ADM1 was used to simulate the biochemical reactions. The authors argue
that the effects imposed by the reactions in the cathode on the performance of
the MFC are noteworthy. There were some laboratory experiments conducted
in the context of this study to determine some of the parameters required by the
model. Despite that, it was not possible to extract some parameters that were
estimated by a mathematical method of best fitting the results of the model
with the experimental data.
A one dimensional model of a steady state MFC incorporating charge, heat
and mass transfer and biofilm formation was suggested [46]. The model
sim-ulates the electrical performance of the MFC and the evolution of the biofilm
formation that are affected by the inputs, like temperature and substrate
minor improvement in the results’ agreement was realised mainly because of the
addition of the effects that heat transfer has on the anode and the cathode.
The authors of [47] presented a model that concentrates on the effects that
the operational parameters of a MFC, such as the external ohmic resistance
and organic loads, have on communities of anodophilic and methanogenic
mi-crobes. The ordinary differential equations that are included by the model
were subjected to fast numerical solution techniques in order for the model to
be more efficient than the one presented in [40] but not oversimplified as the
one presented in [39]. Moreover, the model was calibrated with the analysis of
two single-chamber membrane-less aircathode MFCs and then validated on two
other MFCs.
Another type of MFCs, namely the membrane-less single-chamber MFC,
with molasses as fuel was modelled in [48]. The model consisted of a system
of differential equations depicting the diffusion and concentration profiles of the
molecules, which are solved with a numerical approximation technique, namely
the implicit finite difference method. Despite the fact that the authors find the
results of the model in accordance with the theoretical principles, they suggest
that more detailed evaluation of the model is required in order to serve the
optimisation of the performance of MFCs.
The novel model based on CNN simulating the performance of MFCs
pro-posed here, was motivated by the limitations impro-posed by the previously
re-ported models. Some of these limiting factors are the representation of the
MFC compartments in one dimension disregarding possible inhomogeneities in
the electrodes or the biofilms and the implementation of complicated differential
equations that make models time consuming and compute-intensive. Moreover,
the use of CNN is advantageous compared with past models, as complicated
computations are emerging from synchronised local interactions of basic
sim-plistic entities. The given homogeneity of CNNs and the local interconnections
are essential features for mapping great amounts of cells in digital circuit
3. The proposed model
The model proposed here is simulating the performance of a two-chamber
acetate-fed MFC with a biofilm attached on the anode electrode in batch mode.
The following assumptions are made:
1. The electrode is considered to be a 2D solid, which although is in contrast
with best practices [49], it is a necessary simplification for the model.
Important characteristics such as low biofilm populations — due to the
limited available outer area for colonisation — and biofilm erosion will be
considered in future studies.
2. The microbial growth is proportional to the spatial concentrations of
growth-limiting factors like acetate and oxidised mediator; however the
metabolic products formed are not considered as primary factors effecting
the performance of the MFC and, thus, neglected by the model;
3. An ideal PEM is considered, allowing only protons to pass through but
nothing else (like other cations, carbon dioxide, acetate and oxygen) and
does not limit the performance of the MFC;
4. An added mediator mechanism is used; as a result, electrons are shuttled
from the microbes to the anode electrode by the reduced form of a chemical
which is oxidised at the surface of the electrode;
5. The heat generation by electrochemical reactions occurring on both
elec-trodes, anode compartment and biofilm and the heat flux is not considered;
6. Temperature is considered fully controlled and kept constant;
7. Solute materials are transported in space through molecular diffusive forces
and migration of charged molecules, due to the electrical potential field.
The latter is not studied in the current version of the model;
8. No gravity forces were included for any of the material to keep the model
as straightforward as possible;
9. The anode compartment is defined as a continuously stirred tank reactor;
10. The reactions in the cathode side are prescribed as constant and are not
Note here, that neglecting the migration of charged molecules in the electrical
potential field generated by the voltage outputs of the MFC can not be treated
as an oversimplification of the model that studies single MFCs equipped with
an ideal cation/anion exchange membrane. That assumption stands, given that
the effects of that phenomenon are minor due to the low voltages produced
by the system and the high conductivity of the anolyte solution. Moreover,
previously published models of MFCs [50] suggested that the incorporation or
not of the phenomenon of electrical migration provides results with an average
difference in power densities of 1.92% throughout the range of MFC voltage
outputs. Nonetheless, most of the previous work done on the field of MFC
modelling neglected that phenomenon [40, 45, 46].
The grid of the CNN model is of sizen×n(here is consisted of 68×68 cells for illustration reasons), and is representing a cross section of an area in the anode
compartment near the electrode of a given batch-mode MFC. The size of the
simulated area, represented by one CNN cell is set with the actual geometrical
distances in mind. The size of each cell has been chosen to be sufficient to
illustrate an area where the abstraction of homogeneous reactions occurring can
be justified and fluxes of soluble chemicals can be depicted. Namely, the area of
a CNN cell is defined as a 1µm×1µmarea of the anode compartment, an area comparable with the typical dimensions of some species of bacteria. As a result,
the CNN cell is small enough to accommodate the two dimensional projection
of the existence of a single bacterium in a specified area. The size of a CNN cell
can be trivially increased after the appropriate decrease of the dimension-related
parameters and without changing anything in the algorithmic configurations of
the model. This procedure would effect negatively the accuracy of the model,
as a higher level of abstraction will be assumed, however the execution time will
be decreased as a smaller amount of elements will be calculated.
The von Neumann neighbourhood was used, meaning that each cell has
five neighbours, the four closer adjacent cells to the central one (located in the
north, south, west and east directions), including the central one. Note here that
(as a more extended neighbourhood would be used including nine cells), the von
Neumann neighbourhood was chosen to maintain an efficient point in the
trade-off between complexity and accuracy. While the accuracy of the calculations
is slightly reduced and the complexity of the model is reduced, its speed of
execution is considerably enhanced. Each cell is defined by its state consisted of
several parameters that are simultaneously updated throughout the simulation
time steps, according to the states of its neighbours and by the local rule. The
parameters consisting the state of each cell are the following:
Si,jt = [T t i,j, X
t
i,j,(CAc) t
i,j,(CM red) t
i,j,(CM ox) t i,j,(CH)
t i,j, O
t i,j, I
t
i,j] (1)
whereiandjare the dimension indexes that establish the location of each cell in the grid andtis the current time step. Tt
(i,j)is illustrating the way the relative area, represented by each cell, can be classified depending on its characteristic
structure. This parameter can change through the simulation time steps and
can have the following values:
T(ti,j)=
0,for borders (confining the movement of elements),
1,for anode electrode surface,
2,for biofilm attached to the electrode,
3,for bulk liquid of anolyte.
(2)
ParametersX(ti,j),(CAc)ti,j,(CM red)ti,j,(CM ox)ti,j and (CH)ti,j indicate the con-centrations of ingredients that participate in the significant reactions in a MFC
which are investigated for designing the model. Note here, that the units of all
the parameters in the following equations and their values for an example
con-figuration presented in the following section can be found in Table 1. Namely,
• Xt
• (CAc)ti,j represents the electron donor material for the microbes (the fuel
of the MFC), here assigned as acetate,
• (CM red)ti,j represents the added mediator chemical in reduced form, while
• (CM ox)ti,j represents the added mediator chemical in oxidised form,
• (CH) t
i,jrepresents protons/hydrogen ions that are released from the
reac-tions occurring in the anode electrode surface.
Parameters Ot
i,j and Ii,jt represent the locally imposed over-potential and
produced current density in each cell (i, j). TheOi,jt parameter studied is the activation over-potential, while the effects from the ohmic and concentrations
over-potentials are implemented in the local rule calculations [40].
The definition of the anode compartment as a continuously stirred tank
reactor is based on the fact that phase mixture is quite faster than the
electro-chemical and bioelectro-chemical reaction rates [45]. As a result, all cells representing
an area of anode bulk liquid will obtain the same state at the same time step.
Also, the cells representing borders, theoretically undergo no changes
through-out time, thus, their states are regulated to a constant set of values, equal to
zeros.
The local rule used in the model simulates the kinetics and reactions of all
materials. The calculations depend on the type of the cell represented (T(ti,j)) at the given time step and employ the concentrations of chemicals in the predefined
area (the neighbourhood of each cell) to provide the concentrations throughout
time for each CNN cell. The concentrations within cells simulating the biofilm
is given by the following expression:
(CAc) t+1
i,j =(CAc) t
i,j+DAc×((CAc) t
i−1,j + (CAc) t
i+1,j+ (CAc) t
i,j−1+ (CAc) t i,j+1 −Ni,j×(CAc)ti,j)−(rfAc)ti,j
(3)
represents the rate at which the acetate is consumed by bacteria. This
consump-tion rate depends on the local concentraconsump-tions of acetate, biomass and oxidised
mediator and is defined as a double Monod limitation kinetic equation [51]:
(rfAc) t
i,j=QAc×Xi,jt ×
(CAc)ti,j
KAc+ (CAc)ti,j ×
(CM ox)ti,j
KM ox+ (CM ox)ti,j (4) where KAc is the Monod half-saturation coefficient for acetate, KM ox is the Monod half-saturation coefficient for the oxidised mediator andQAcis the max-imum specific rate constant for microbial consumption of acetate.
Equation 3 is actually the numerical approximation of the implicit finite
difference method (eq. 5) of Fick’s second law in two dimensions [48], with the
addition of the consumption rate of acetate by bacteria. Fick’s second law (eq.
6) is used to simulate the transport of solutions or liquids in other liquids, states
that the change through time of concentration is depending on the differences
of concentration and is derived from mass balance principle of a species in a
fluid continuum [52].
d2f
dx2
x
=f(x+ ∆x)−2f(x) +f(x−∆x)
∆x2 (5)
∂c ∂t =D
∂2c
∂x2 (6)
wherecis the concentration of a species,Dis the diffusion coefficient,tis time andxis the length.
Furthermore, the concentration of acetate in the bulk liquid is equal for all
cells, as mentioned previously, due to the assumption of the anode as a
con-tinuously stirred tank reactor. Also, biofilm development, along with substrate
consumption rate, and solute mass transport, through diffusion, occur at
differ-ent time scales, in the order of hours and seconds, respectively. Consequdiffer-ently,
an immediate effect of the substrate consumption in the biofilm on the bulk
concentration will be demonstrated in the mathematical formulas. Taking all
given by the following equation:
(CAc) t+1
i,j = (CAc) t
i,j+ (rbAc) t i,j+
P
(rfAc)tk,l
Vt a
+
P
(reAc)tm,n
Vt a
(7)
where (rbAc) t
i,jis the net rate of reactions in the bulk,
P(rf
Ac) t
k,lis the overall
reaction rates in the whole biofilm (∀k, l that Tt
(k,l) = 2), P(re
Ac) t
m,n is the
overall reaction rates in the surface of the electrode (∀m, nthatTt
(m,n)= 1) and
Va is the volume of the bulk liquid, here measured by cells that have an area of 1µm2.
The rates of reactions in the bulk liquid (rbActi,j) are calculated the same way as the rates of reactions in the biofilm (rfActk,l), specifically by eq. 4 with the use of local concentrations for the bulk liquid.
Similar rules apply for the rest of chemical species that are important in the
functionality of a MFC, namely the mediator in reduced and oxidised form and
hydrogen ions. The following equations describe the evolution of the
concentra-tions in the biofilm region:
(CM red) t+1
i,j =(CM red) t
i,j+DM ×((CM red) t
i−1,j + (CM red) t
i+1,j+ (CM red) t i,j−1+ (CM red)ti,j+1−Ni,j×(CM red)ti,j) +YM ×(rfAc)ti,j
(8)
(CM ox)ti,j+1=(CM ox)ti,j+DM ×((CM ox)ti−1,j+ (CM ox)ti+1,j+ (CM ox)ti,j−1+
(CM ox) t
i,j+1−Ni,j×(CM ox) t
i,j)−YM ×(rfAc) t i,j
(9)
(CH) t+1
i,j =(CH) t
i,j+DH×((CH) t
i−1,j+ (CH) t
i+1,j + (CH) t
i,j−1+ (CH) t i,j+1−
Ni,j×(CH)ti,j) +YH×(rfAc)ti,j
(10)
The concentration of the aforementioned chemical species in the bulk liquid
are calculated by the following:
(CM red)ti,j+1 = (CM red)i,jt +YM×(rbAc)ti,j+
P[Y
M×(rfAc) t k,l] Vt
a
+
P(re
M red) t m,n Vt
a
(11)
(CM ox)ti,j+1= (CM ox)i,jt −YM ×(rbAc)ti,j+
P
[−YM ×(rfAc) t k,l] Vt
a
+
P(re
M ox) t m,n Vt
a
(12)
(CH)ti,j+1= (CH)i,jt +YH×(rbAc)ti,j+
P[Y
H×(rfAc) t k,l] Vt
a
+
P(re
H) t m,n Vt a (13)
It must be mentioned here that the reaction rates on the electrode surface for
the model are designed having in mind the oxidation mechanism of the mediator
and the fact that the electrode stands theoretically as an impermeable border
for all the other solute materials. As a result the reaction rate for the acetate
substrate is equal to zero ((reAc)ti,j= 0), whilst, for the both mediator forms is depending on the produced current density and calculated as:
(reM red)ti,j=−I
t i,j
2F (14)
(reM ox)ti,j= I
t i,j
2F (15)
The reduction reactions that involve the hydrogen ions, are occurring in the
cathode electrode, which is not studied in detail in the present study. Thus,
in order to simulate the decrease in the concentration of hydrogen ions in the
anode compartment, which is due to the flux of the ions towards the cathode
of hydrogen ions exceeds a predefined value (namelyCHmax) anywhere in the anode, its value will be fixed to the limit.
The over-potential imposed locally on the surface of the electrode is based
on the concentrations of protons, reduced and oxidised mediator and the current
produced.
Oti,j=Ec−RT otIi,jt −(E
0
M + RT
2F ln
(CM ox)ti,j((CH)ti,j)2
(CM red)ti,j ) (16)
whereEc is the constant value assumed for the cathode potential,RT ot is the total resistance (internal and externally connected),E0
M is the standard
reduc-tion potential for the mediator,Ris the gas constant,T is the temperature and
F is the Faraday constant.
For the calculation of the current density produced on the anode electrode’s
surface, the widely used Butler-Volmer equation [40, 53] is implemented in the
model:
Ii,jt =Iref
(CM red)t
i,j
(CM red)ref
(CM ox)t
i,j
(CM ox)ref
−1(CH)t
i,j
(CH)ref
−2
·
exp(2.303·Oti,j/b)−
exp(−2.303·Oti,j/b)
(17)
whereIref is the exchange current density for mediator oxidation in reference conditions andb is the Tafel coefficient for mediator oxidation (or referred to as the anodic/cathodic Tafel slope, representing the over-potential increase
re-quired for a×10 increase in current: b=2.303αFRT, whereαis the anodic transfer coefficient).
It is worth-mentioning that the over-potential and current density are
mean-ingful only on the cells representing the electrode’s surface. Thus, the
afore-mentioned equations provide these parameters for cells that have Tt
As the calculations of the over-potential and the current density are implicit,
a random positive value of the total current is assumed and then a numerical
method is used to approximate the lowest error in the calculation of the total
current, given the concentrations of chemical species on the electrode surface.
On the first step, the randomly chosen current value is used (in eq. 16) to
calculate the over-potential, which is then used to calculate the new current
density (in eq. 17) and, thus, the total current produced. The current density
error, which is targeted to be minimised, is given by:
etI =|Inewt −X(Ii,jt )| (18)
where Inew is the randomly assumed value for the first step or the calculated value by the previous step.
The evolution of the biofilm is proportional to the concentrations of chemical
species as described by a double Monod limitation kinetic equation (as in eq.
4). The calculation of its expansion in the area of the bulk liquid of the anode
is based on a simple algorithm to keep the overall computational model as
straightforward and fast as possible. The concentration of biomass material in
the biofilm CNN cells is calculated by the following equation:
Xi,jt+1=Xi,jt + (rfX) t
i,j (19)
where (rfX)ti,j is the rate of the biomass production in the biofilm and equals:
(rfX) t
i,j =YX×(rfAc) t
i,j (20)
where YX is the biomass yield on acetate substrate. The same equations are used for the approximation of the suspended biomass in the bulk liquid, with
the usage of the appropriate local concentrations.
Xi,jt+1=Xi,jt + (rbX) t
where (rbX)ti,j is the rate of the biomass production in the bulk liquid and equals:
(rbX)ti,j =YX×(rbAc)ti,j (22)
An upper limit on the concentration of biomass in the bulk liquid (Xmax0 ) is imposed to control the biomass growth. Moreover, the following method,
which is written in pseudo-code, is performed to simulate the release of pressure
produced by the creation of new biomass inside the region of the biofilm. This
is to ensure a more realistic expansion of the biofilm attached on the anode
electrode towards the bulk liquid. The algorithm is performed with initial cells
that are part of the biofilm (for cellsi, j that have parameterTt
(i,j)= 2). if Xi,jt+1>=Xmaxthen
if a random neighbour cell(k, l)with Tt
(k,l)= 3can be found then assignT(tk,l+1)= 2 and Xk,lt+1=Xt
k,l+X t
i,j·0.005 ;
RunAlgorithm 1fori=k andj=l; (recursive execution untilXt+1
r,p <=Xmax ) Xi,jt+1=Xt
i,j·0.995;
end
else
Xi,jt+1 is calculated as in eq. 19 ; end
Algorithm 1: Conditions in the evolution of the biomass
Despite the fact that the model is specifically designed to simulate a MFC
in batch mode, a system with continuous flow can be studied by changing the
boundary conditions. That approach is the subject of a future study.
4. Experiments
The configuration of parameters used by the model to produce the results
Parameter Value Parameter Value
Iref 2×10⁻⁴ A/m2 Xi,j0 (in bulk liquid) 0.2gCOD/m3
b 0.12V Xi,j0 (in the biofilm) 0.8gCOD/m3
Ec 0.68V (CAc)
0
i,j 100 gCOD/m
3
RT ot 100 Ω (CM red)0i,j 0.001mM
E0
M 0.477V (CM ox)
0
i,j 1mM
R 8.31J/(mol×K) (CH)0i,j 0.001mM
T 298 K DAc 6.5×10⁻⁶ m2/day
F 96485C/mol DM red 2×10⁻⁶ m2/day
eI 0.00002A DM ox 1.7×10⁻⁶ m2/day
KAc 100gCOD/m3 DH 1.16×10⁻⁶ m2/day
KM ox 0.1mM CHmax 0.045mM
Xmax0 17gCOD/m3 Xmax 18gCOD/m3
YM 0.0473
(molmediator)
(gCODacetate) YH 0.0098
(molH+) (gCODacetate)
[image:18.612.132.505.122.411.2]YX 0.243 ((gCODbiomassgCODacetate)) QAc 10 (gCODbiomass(gCODacetate)×day)
Table 1: Parameters used in the execution of the model.
a time period of one tenth of day. The time period of a time step was chosen
based on the trade-off between accuracy of the results and execution time. As
for smaller time periods the results were not significantly different the execution
speed was not burdened with a smaller period of time steps.
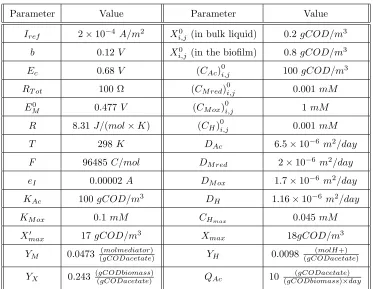
The results derived by the model are illustrated in Figs. 1 and 2.
Fig-ure 1 depicts how the average — of the columns of cells along the length of
the electrode — concentrations of materials are changing in one dimension —
illustrated in thex-axis of the graphs —, namely from the electrode moving out-wards to the bulk liquid, throughout the time steps of the model that represent
the days of the real experiment. Note here that the thickness of the biofilm can
point where the stable values of concentrations start. These stable values depict
the existence of the continuously stirred tank reactor, namely the bulk liquid.
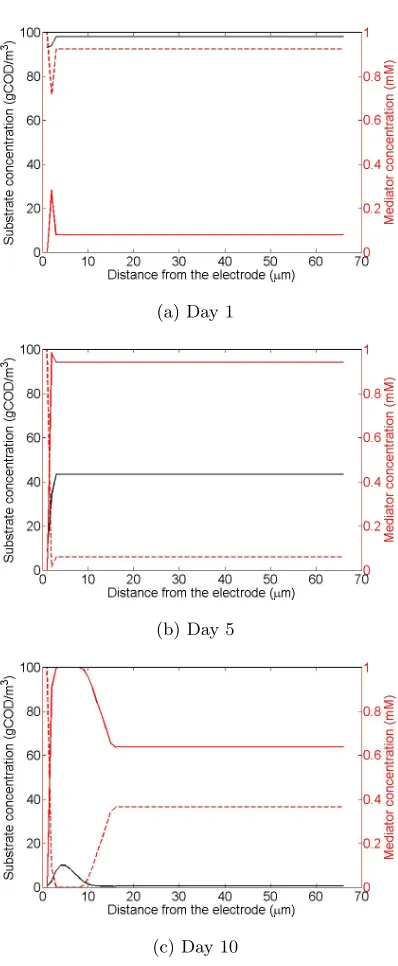
Moreover, Fig. 2 describes the evolution of the concentrations of every material
in the bulk liquid, the current produced and the expansion of the biofilm.
The results depicted in Fig. 2 are in good agreement with the theoretical
principles covering the functionality of MFCs in batch mode with added
media-tors which are also depicted in previously proposed models investigating similar
systems [40]. It must mentioned here that, despite the biomass initial
concen-trations, all the other parameters used in previous models [40] to provide results
are the same inserted in the model presented here and illustrated in Table 1.
Also, the biomass simulation and the limitation of hydrogen ions are simplified
compared to the previous models.
The following statements which are easily observed in the results of the model
presented in Fig. 2 are following the general theoretical performance of batch
mode MFCs with added mediators. The current output reaches its maximum
value within three to four days that retains for a short period (less than a day)
and then its value is asymptotically reduced. The concentration of acetate is
reduced to zero in the first ten days, while the biomass concentration in the
biofilm increases and reaches a plateau when the acetate concentration is low
enough. The mediator is a constant quantity that can be found in either oxidised
or reduced form, thus adding the concentrations in any time step equals to 1mM
which is the initially defined concentration. The oxidised mediator follows the
reduction of the acetate substrate, until the current produced is high enough to
cause the oxidation reaction in the electrode to overcome the reduction reactions
occurring in the biomass. Then, as there is no more acetate to feed the reduction
reactions, the concentration of oxidised mediator is asymptotically reaching its
initial concentration as a product of the oxidation reaction in the electrode.
That is also the reason for the asymptotic reduction of the current, namely the
lower ratio between reduced and oxidised mediator. Similar explanation of the
progress of the oxidised mediator stands for the reduced mediator.
(a) Day 1
(b) Day 5
[image:20.612.208.407.129.612.2](c) Day 10
Figure 1: The concentrations – averaged over the columns of cells along the length of the
electrode – of materials along the distance away from the anode electrode during different
(a)
(b)
[image:21.612.209.407.135.627.2](c)
Figure 2: Model’s results: (a) the current output, (b) the evolution of biomass and (c) the
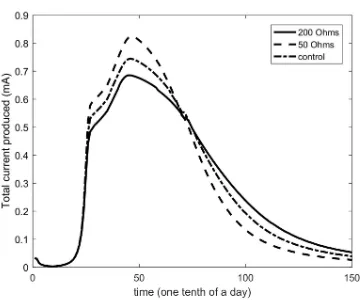
Figure 3: The resultant current produced during 15 days for different values of resistance
RT ot.
through time simulated by the model, the values of total resistance, initial
ac-etate concentration and biomass concentrations were thoroughly studied. Note
that for each case the rest of the parameters are the same as the control case
scenario, depicted in Table 1. The effect that the total resistance (internal and
the external – load) has on the output is depicted in Fig. 3. In accordance
with the theoretical principles, the higher the resistance, the lower the
resul-tant current; however, that leads to the prolonged existence of comparably high
values of current, due to the decelerated consumption of the substrate by the
biofilm. The higher resistance and thus the lower current leads to a decelerated
rate of the electrochemical reactions (Equations (14–15)), which results to lower
concentration of oxidised mediator that is a limiting factor in the consumption
rate of acetate (based on the double Monod equation used, i.e. Equation (3)).
The aforementioned decelerated rate of the electrochemical reactions for higher
resistances can be noticed in Fig. 3 by the more gradual slope of the current.
In 4, different concentrations of the acetate substrate were investigated. In
particular, when a higher concentration of substrate is imposed, the maximum
output current is reached in a shorter time period, the maximum value is higher
and it is retained for a longer time. These phenomena are justified as the higher
Figure 4: The resultant current produced during 15 days for different values of initial acetate
concentrationC0
Ac.
Monod equation Equation (3)) and, thus, faster production of a higher volume
of reduced mediator, to support the current generation.
The results provided using different concentrations of biomass in the bulk
liquid and the initial biofilm are illustrated in Fig. 5. The comparison of the
results can support the fact that a higher biomass concentration can result to
a slightly higher current, because the fast developed biofilm will faster compose
higher amounts of reduced mediator, which will trigger the electrochemical
ox-idation and in correspondence the production of current.
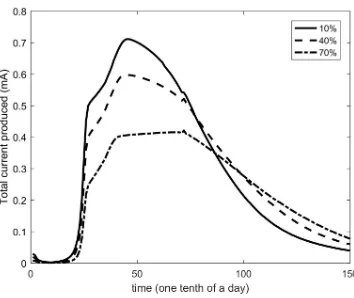
The ability of the model to represent inhomogeneities was studied in the
following test cases. Firstly, the impact of the extent to which a specific area on
the electrode is not capable to sustain the attachment of biomass was studied
and the results are depicted in Fig. 6. It can be observed that as the percentage
of unavailable electrode surface is increasing, the maximum current produced
is decreasing, whereas the time period is extended. This behaviour can be
ex-plained by the fact that a biofilm with lower biomass concentration is derived
from the smaller available area of the electrode. That leads to the slower and
limited biochemical consumption rates and electrochemical procedures,
respec-tively.
Figure 5: The resultant current produced during 15 days for different values of biomass
concentrations in the bulk liquid (X0
[image:24.612.204.407.161.331.2](biof ilm)) and in the initial biofilm(X 0 (bulk)).
Figure 6: The resultant current produced during 15 days for different percentages, i.e. 10%,
[image:24.612.214.391.457.606.2]Figure 7: The resultant current produced during 15 days when the 25% of the electrode surface
suffers from resistance inhomogeneity (where control is the case of homogeneous electrode
(RT ot= 100Ω)).
electrode was studied by assuming that a fraction of 25% of the area of the
electrode has a different resistance than the rest of it. Note that the resistance
used for the calculation of the over-potential imposed locally on the surface of
the electrode (Equation (16)) is defined as the equivalent resistance observed at
each discrete electrode area. Here, in spite of using a homogeneous value for all
the electrode surface, different values were considered for the 25% of the area
of the electrode as illustrated in the legend of Fig. 7 (where control is the case
of homogeneous electrode (RT ot = 100Ω)). The results indicate that there is a significant impact caused by inhomogeneities, which can be simulated by the
model. The outputs can be explained with the same principles that apply for
the ones obtained by homogeneous total resistances as illustrated in Fig. 3.
5. Discussion
The advantages of CNN towards other mathematical methods are their
sim-plicity that does not have an effect on their robustness and capability to simulate
complicated phenomena, their inherent parallel nature that make them ideal for
implementation in contemporary parallel computing devices and their local
execution on specialised hardware. As a result, the novelty of the model
pro-posed here can be found in the method of numerical approximation, namely
CNN, of the equations giving the kinetics of reactions occurring in a MFC and
its performance. As mentioned before, CNN is a simple method as it uses a
group of simple cells located on a grid, characterised by a state (a set of
pa-rameters) and updated based on the same local rule. It has been proved [4]
that complex computations can emerge from local interactions of basic entities.
Moreover, the synchronised functionality of the basic entities enables a fully
par-allel execution of computations throughout the grid, accelerating significantly
the production of results by the model. In addition to the ability of CNNs
to be efficiently executed in parallel computers, their homogeneity, simplicity,
synchronised activity and the local characteristic of the interconnections allows
an effortless implementation in hardware, aiming further acceleration of the
computations [37, 38]. These computing circuits can be cost efficient and
pre-manufactured Field Programmable Gate Arrays (FPGAs) and Graphics
Pro-cessing Units (GPUs) or fully custom, providing higher performance efficiency
Application Specific Integrated Circuits (ASICs).
The present study is based on a time explicit scheme which, despite the
fact that might not be as accurate as implicit scheme in general, and especially
with large simulation time steps, allows a less complicated implementation and
requires a lower computational effort. A major advantage of the CNN-based
model is that the possible inhomogeneities in the progress of the biofilm or in
the structure of the anode electrode can be easily illustrated by the local rule
or the initialisation of the cells’ states.
Some models presented previously, simulate the MFC in just one dimension
[46], oversimplifying the reactions occurring. On the other hand, in [40, 41, 44,
48] two dimensional and three dimensional representations are provided that
can account for complicated electrode sizes and biofilm formation; however,
inhomogeneities would be difficult to implement. The model presented here
can easily be scaled to three dimensions and as CNN are the basis of the model,
can easily be studied and efficiently recreate a wide variety of actual systems.
Despite the fact that an homogeneous area (in the x dimension) was studied
here as a proof of concept, the ability of the model to simulate inhomogeneities
in two dimensional paradigms is trivial.
Moreover, in [40] the competition of two different species, fed on the same
substrate used, was investigated, while in [41] several communities of methanogenic
and electroactive bacteria were simulated. The CNN based model is simulating
the operation of a MFC inoculated with a single species of bacteria. However,
the local dynamics of CNN allow the investigation of more complicated bacterial
communities. That is an aspect of an ongoing study.
Nonetheless, some models are designed to calculate significant parameters
of a MFC after it has reached its steady state [46]. Here, the evolution of the
outputs of the MFC through time given its inputs is investigated because the
process of reaching the steady state is a demanding procedure and should be
optimised.
Conclusions
The notion of modelling key procedures of complicated processes that occur
in real life, enables the scientific community to recreate and study time
consum-ing and expensive laboratory experiments. As a result, scientists can investigate
the conditions and parameters of a phenomenon that are difficult to measure in
real life. The model proposed here can serve as a virtual lab, which scientists
and engineers can utilise to test and justify their theoretical approach to the
functionality of MFCs. Moreover, a more efficient designing of these systems
can be based on the successful modelling of the processes occurring in MFCs.
The CNN-based model simulating the performance of a two-chamber
acetate-fed MFC described here, is designed in two dimensions and studies cross-section
of an area near the anode electrode. The concentrations of chemicals that are
involved in the process of producing current and biomass, throughout time, are
Monod limitation equation, Fick’s second law of diffusion and the Butler-Volmer
equation.
During the process of designing and evaluating the model the following
con-clusion was reached. The biofilm’s distribution, its initial concentration and
the way it evolves and expands through time are greatly affecting the MFC’s
outputs. Biofilms are difficult to predict and it is challenging to formulate
al-gorithms that simulate their behaviour. That is a major aspect that limits the
production of a plethora of MFC models, compared with the ones describing
conventional fuel cells.
The results provided by the model are in good agreement with the theory and
the general concepts described in the literature for the functionality of MFCs
as well as the results of previously published works on MFC modelling. Note
that the results produced by the proposed model simulating the performance
of the MFC in 15 days is executed in less than a minute in a contemporary
computer. Consequently, shifting from two dimensions to three to get more
accurate results, given the possible inhomogeneities in MFC compartments or
electrodes, will not be prohibited in terms of execution times.
Nonetheless, the fact that the model is based on CNN can be proved further
advantageous, as its simplicity, repeatability and local interactions enable its
implementation on hardware. That will in turn hugely accelerate the execution
of the calculations of the described equations.
The incorporation of the reduction reactions that occur in the cathode side
of the MFC and the study of their effects on the performance of the system
are aspects of future work. Moreover, multi-species biofilms will be investigated
including non- and electroactive bacteria to illustrate the possible competition
over the common substrate. Furthermore, the simulation of a MFC under
con-stant flow will be presented with minor alterations in the local rules of the bulk
Acknowledgements
This work was funded by the European Union’s Horizon 2020 Research
and Innovation Programme under Grant Agreement No. 686585. http:
//livingarchitecture-h2020.eu
References
[1] I. A. Ieropoulos, J. Greenman, C. Melhuish, Miniature microbial fuel cells
and stacks for urine utilisation, International Journal of Hydrogen Energy
38 (1) (2013) 492–496.
[2] M. Potter, Electrical effects accompanying the decomposition of organic
compounds, Proceedings of the Royal Society of London, Series B 84 (571)
(1911) 260–276.
[3] M. Taghavi, A. Stinchcombe, J. Greenman, V. Mattoli, L. Beccai, B.
Maz-zolai, C. Melhuish, I. A. Ieropoulos, Self sufficient wireless transmitter
powered by foot-pumped urine operating wearable MFC, Bioinspiration
& Biomimetics 11 (1) (2016) 016001.
[4] L. O. Chua, T. Roska, The CNN paradigm, IEEE Transactions on Circuits
and Systems I: Fundamental Theory and Applications 40 (3) (1993) 147–
156.
[5] L. O. Chua, CNN: A paradigm for complexity, Vol. 31, World Scientific,
1998.
[6] D. Dab, J.-P. Boon, Cellular automata approach to reaction-diffusion
sys-tems, in: Cellular Automata and Modeling of Complex Physical Syssys-tems,
Springer, 1989, pp. 257–273.
[7] H. S. Berryman, D. R. Franceschetti, Simulation of diffusion controlled
reaction kinetics using cellular automata, Physics Letters A 136 (7) (1989)
[8] B. Chopard, M. Droz, Cellular automata model for the diffusion equation,
Journal of Statistical Physics 64 (3-4) (1991) 859–892.
[9] B. Chopard, P. Luthi, M. Droz, Reaction-diffusion cellular automata model
for the formation of Leisegang patterns, Physical review letters 72 (9)
(1994) 1384.
[10] B. Chopard, Cellular automata modeling of hydrodynamics and
reaction-diffusion processes: Basic theory, in: Scale Invariance, Interfaces, and
Non-Equilibrium Dynamics, Springer, 1995, pp. 133–163.
[11] M. Droz, Cellular automata approach to pattern formation in
reaction-diffusion systems, Physica A: Statistical Mechanics and its Applications
240 (1) (1997) 239–245.
[12] O. L. Bandman, Comparative study of cellular-automata diffusion models,
in: International Conference on Parallel Computing Technologies, Springer,
1999, pp. 395–409.
[13] J. R. Weimar, Three-dimensional cellular automata for reaction-diffusion
systems, Fundamenta Informaticae 52 (1-3) (2002) 277–284.
[14] H. Matsubara, T. Asai, T. Hirose, Y. Amemiya, Reaction-diffusion chip
implementing excitable lattices with multiple-valued cellular automata,
IE-ICE Electronics Express 1 (9) (2004) 248–252.
[15] Y. Suzuki, T. Takayama, I. N. Motoike, T. Asai, Striped and spotted
pattern generation on reaction-diffusion cellular automata–theory and LSI
implementation–, in: Proceedings of the 2005 Workshop on
Unconven-tional Computing: From Cellular Automata to Wetware, Luniver Press,
2005, p. 41.
[16] A. Adamatzky, G. J. Mart´ınez, J. C. S. T. Mora, Phenomenology of
reaction–diffusion binary-state cellular automata, International Journal of
[17] A. Adamatzky, A. Wuensche, B. D. L. Costello, Glider-based computing in
reaction-diffusion hexagonal cellular automata, Chaos, Solitons & Fractals
27 (2) (2006) 287–295.
[18] F. M. Marchese, A directional diffusion algorithm on cellular automata for
robot path-planning, Future Generation Computer Systems 18 (7) (2002)
983–994.
[19] A. Adamatzky, B. D. L. Costello, T. Asai, Reaction-diffusion computers,
Elsevier, 2005.
[20] A. Adamatzky, L. Bull, P. Collet, E. Sapin, Evolving localizations in
reaction-diffusion cellular automata, International Journal of Modern
Physics C 19 (04) (2008) 557–567.
[21] A. Adamatzky, Reaction-Diffusion Automata: Phenomenology,
Localisa-tions, Computation, Vol. 1, Springer Science & Business Media, 2012.
[22] M. Hiratsuka, T. Aoki, T. Higuchi, A model of reaction-diffusion cellular
automata for massively parallel molecular computing, in: Multiple-Valued
Logic, 2001. Proceedings. 31st IEEE International Symposium on, IEEE,
2001, pp. 247–252.
[23] C. Picioreanu, Modelling biofilms with cellular automata, Final report to
European Environmental Research Organisation, 1996.
[24] K. Krawczyk, W. Dzwinel, D. A. Yuen, Nonlinear development of bacterial
colony modeled with cellular automata and agent objects, International
Journal of Modern Physics C 14 (10) (2003) 1385–1404.
[25] A. Vitvitsky, Cellular automata simulation of bacterial cell growth and
division, in: Designing Beauty: The Art of Cellular Automata, Springer,
2016, pp. 121–123.
[26] K. Odagiri, K. Takatsuka, Threshold effect with stochastic fluctuation in
compar-ative study of reaction-diffusion equations and cellular automata, Physical
Review E 79 (2) (2009) 026202.
[27] M. Margenstern, Bacteria, Turing machines and hyperbolic cellular
au-tomata, A Computable Universe: Understanding and Exploring Nature as
Computation (2013) 209.
[28] A. H. Fadaei, S. Setayeshi, A new optimization method based on
cellu-lar automata for VVER-1000 nuclear reactor loading pattern, Annals of
Nuclear Energy 36 (5) (2009) 659–667.
[29] M. Boroushaki, M. B. Ghofrani, C. Lucas, Simulation of nuclear reactor
core kinetics using multilayer 3-D cellular neural networks, IEEE
Transac-tions on Nuclear Science 52 (3) (2005) 719–728.
[30] K. Hadad, A. Piroozmand, Application of cellular neural network (CNN)
method to the nuclear reactor dynamics equations, Annals of Nuclear
En-ergy 34 (5) (2007) 406–416.
[31] A. Pirouzmand, A. Nabavi, Simulation of nuclear reactor dynamics
equa-tions using reconfigurable computing, Progress in Nuclear Energy 89 (2016)
197–203.
[32] E. Akishina, V. Ivanov, B. Kostenko, Cellular automata approach to
in-vestigation of high burn-up structures in nuclear reactor fuel, Particles and
Nuclei, Letters 2 (1) (2005) 124.
[33] K. Hadad, A. Pirouzmand, N. Ayoobian, Cellular neural networks (CNN)
simulation for the TN approximation of the time dependent neutron
trans-port equation in slab geometry, Annals of Nuclear Energy 35 (12) (2008)
2313–2320.
[34] H. Benzhai, L. Lei, Q. Ge, P. Yuwan, L. Ping, Y. Qingxiang, W. Hailei,
Simulation of wastewater treatment by aerobic granules in a sequencing
batch reactor based on cellular automata, Bioprocess and biosystems
[35] F. Zhang, J. Qiao, C. Liu, N. Yu, X. Ruan, A cellular automata model
for the sequencing batch reactor of activated sludge processes, in: 2006
6th World Congress on Intelligent Control and Automation, Vol. 1, IEEE,
2006, pp. 1558–1562.
[36] O. Bandman, Using cellular automata for porous media simulation, The
Journal of Supercomputing 57 (2) (2011) 121–131.
[37] N. Dourvas, M.-A. Tsompanas, G. C. Sirakoulis, P. Tsalides, Hardware
acceleration of cellular automata physarum polycephalum model, Parallel
Processing Letters 25 (01) (2015) 1540006.
[38] M.-A. I. Tsompanas, G. C. Sirakoulis, A. I. Adamatzky, Physarum in
sil-icon: the Greek motorways study, Natural Computing 15 (2) (2016) 279–
295.
[39] X.-C. Zhang, A. Halme, Modelling of a microbial fuel cell process,
Biotech-nology Letters 17 (8) (1995) 809–814.
[40] C. Picioreanu, I. M. Head, K. P. Katuri, M. C. van Loosdrecht, K. Scott, A
computational model for biofilm-based microbial fuel cells, Water Research
41 (13) (2007) 2921 – 2940.
[41] C. Picioreanu, K. P. Katuri, I. M. Head, M. C. M. van Loosdrecht, K. Scott,
Mathematical model for microbial fuel cells with anodic biofilms and
anaer-obic digestion, Water Science and Technology 57 (7) (2008) 965–971.
[42] D. Batstone, J. Keller, I. Angelidaki, S. Kalyuzhnyi, S. Pavlostathis,
A. Rozzi, W. Sanders, H. Siegrist, V. Vavilin, Anaerobic Digestion Model
No. 1 (ADM1), IWA Publishing, London, 2002.
[43] C. Picioreanu, K. P. Katuri, M. C. M. van Loosdrecht, I. M. Head, K. Scott,
Modelling microbial fuel cells with suspended cells and added electron
transfer mediator, Journal of Applied Electrochemistry 40 (1) (2009) 151–
[44] C. Picioreanu, M. C. van Loosdrecht, T. P. Curtis, K. Scott, Model based
evaluation of the effect of ph and electrode geometry on microbial fuel cell
performance, Bioelectrochemistry 78 (1) (2010) 8 – 24.
[45] Y. Zeng, Y. F. Choo, B.-H. Kim, P. Wu, Modelling and simulation of
two-chamber microbial fuel cell, Journal of Power Sources 195 (1) (2010) 79 –
89.
[46] V. Oliveira, M. Sim˜oes, L. Melo, A. Pinto, A 1D mathematical model for
a microbial fuel cell, Energy 61 (2013) 463 – 471.
[47] R. Pinto, B. Srinivasan, M.-F. Manuel, B. Tartakovsky, A two-population
bio-electrochemical model of a microbial fuel cell, Bioresource Technology
101 (14) (2010) 5256 – 5265.
[48] B. Sirinutsomboon, Modeling of a membraneless single-chamber microbial
fuel cell with molasses as an energy source, International Journal of Energy
and Environmental Engineering 5 (2) (2014) 1–9.
[49] C. Santoro, K. Artyushkova, I. Gajda, S. Babanova, A. Serov, P. Atanassov,
J. Greenman, A. Colombo, S. Trasatti, I. Ieropoulos, P. Cristiani,
Cath-ode materials for ceramic based microbial fuel cells (MFCs), International
Journal of Hydrogen Energy 40 (42) (2015) 14706–14715.
[50] S. Ou, H. Kashima, D. S. Aaron, J. M. Regan, M. M. Mench, Multi-variable
mathematical models for the air-cathode microbial fuel cell system, Journal
of Power Sources 314 (2016) 49 – 57.
[51] V. Ortiz-Mart´ınez, M. Salar-Garc´ıa, A. de los R´ıos, F. Hern´
andez-Fern´andez, J. Egea, L. Lozano, Developments in microbial fuel cell
model-ing, Chemical Engineering Journal 271 (2015) 50 – 60.
[52] R. Balluffi, S. Allen, C. Carter, Kinetics of Materials, John Wiley & Sons,
[53] J. Newman, K. E. Thomas-Alyea, Electrochemical Systems, John Wiley &