Abstract—In this paper, we develop a performance
evaluation model to assess business performance in the Taiwan electronic industry. In order to select better performance indices, we adopt literature review, expert’s questionnaire, and factor analysis-principal component analysis. Through two-stage expert meeting and questionnaires, we collect, discuss, and evaluate all the indictors. 16 out of 28 indices are selected. The 16 indictors are further divided into two levels and 4 categories depended on Analytic Hierarchy Process method and principal component analysis. Based on the result of factor analysis, there are four factors (i.e., categories) named as (1) Profitability Ability-return on assets, return on stockholders’ equity, return on investment, and net profit margin, (2) Efficiency Ability- average collection period, accounts receivable turnover, inventory turnover, working capital, and (3) Liquidity- current ratio, quick ratio, and cash ratio. Additionally, the non-financial 5 indices are included as the fourth factor. Consequently, there are four factors with 16 indices to process the AHP method to determine the weight of each index for measuring business performance. Finally, the result of business performance evaluation is presented and some suggestions are given to middle or top managers for conducting business.
Index Terms—Factor analysis; Principal component analysis; Analytic hierarchy process.
I. INTRODUCTION
Accurate business performance evaluation is a key to success for enterprises. In the competitive environment of the 21st century, a company requires substantial financial and non-financial structure, rapid response, efficient management, and high quality of products and services. In the past, manual self-annual reports on financial statements such as income statement and balance sheet would be done and used to examine a company’s performance. But, manual and separate data may not be effective in the fast changing information era. Meanwhile, without considering other competitors in the same industry, a company will lead to self-satisfaction. Therefore, this paper employs basic statistics, principal component analysis, and analytic hierarchy process method to build a business performance evaluation model for middle or top managers to conduct their
Manuscript received March 6, 2010. This work is supported by the National Science Council, Taiwan, R.O.C., under Grant 98-2410-H-262-005-MY2. W. Wen is an associate professor in the department of information management at LungHwa university of science ad technology, Taiwan, Republic of China. phone: 886-282093211 ext 6300; fax: 886-282093211 ext 6302; e-mail: [email protected]).
company. Once the model is created, we will build a business performance evaluation decision support system for providing optimal suggestions to the managers for conducting their company for facing the rapid changing global environment.
As we know that business performance can be measured by using financial and non-financial factors. Based on literature review, we have studied many financial and non-financial indices related to business performance. By studying financial performance indices, Sohn et al. [11] proposed a structural equation model (SEM) to examine the relationship between technology evaluation factors and the financial performance. It can be used for not only for the effective management of the technology credit funds for small and medium enterprises (SME) but also for evaluating financial performance of SMEs based on the technology evaluation of companies. Their results showed that the operation ability of manager has the highest direct effect on the finance performance index (FPI) and the level of technology has the highest indirect effect on the FPI. Knowledge and experience of manager as well as marketing of technology have positive effect on the FPI. Ocal et al. [10] used factor analysis to select the financial indicators for evaluating financial trend of Turkish construction industry. They collected 5 years of data starting from 1997 to 2001 for 28 Istanbul Stock Exchange traded construction companies. In the factor analysis, there were 25 ratios adopted. According to the values of the correlation matrix, 9 ratios had a weak correction with the others and could be removed. The results of factor analysis showed that 5 factors would be extracted (i.e., eigenvalues are larger than 1). They are named as liquidity factor, capital structure and profitability factor, activity efficiency factor, profit margin and growth factor, and assets structure factor. Their results showed that the companies focused on competition performance and financial performance. The paper also strengths to increase market share, sales growth rate, maintaining steady, and sufficient upstream materials and supplies, and enhance the ability to obtain critical technology and patents. Gursoy and Swanger [3] adopted structural equation modeling to examine the impacts of the internal strategic factors. Their model consists of seven exogenous constructs (sales, R7D distribution, customer service, marketing, IT, human resources, and accounting) and one endogenous construct (financial performance). Their data came from a self-administered questionnaire by mailing to 2339 industry experts. 328 out of 2339 were responded and analyzed. The result shows that four of the seven hypotheses are supported.
Business Performance Evaluation Model for the
Taiwan Electronic Industry based on Factor
Analysis and AHP Method
The four critical success factors that have a significant impact on company financial performance are sales, R&D and distribution, IT, and human resources. Lin et al. [7] applied a structural equation model to supply chain quality management and organization performance. The questionnaire data from both Taiwan and Hong Kong's supply chain firms were collected. Both data show that there have direct effects on the relationship between: QM practices and supplier participation, supplier participation and organization performance, QM practices and supplier selection, supplier participation and supplier selection. Moreover, the relationship between supplier selection and organizational performance has indirect influences. QM practice and organizational performance have also indirect effects. Maiga [8] examined the relationship between enterprise benchmarking and enterprise performance. He found three elements in the benchmarking, which affected the enterprise performance positively, including prior experience with benchmarking, the commitment of the organization to benchmarking, and internal preliminary competence analysis. Hoque [4] surveyed and discussed the impact on performance of two factors, strategy and environmental uncertainty, from 52 samples of manufacturing. His result shows that management’s strategy choice is positively related to performance remarkably. But there is no evidence to prove the relationship between environmental uncertainty and performance. For financial analysis, a better financial company should have 4 abilities: liquidity/debt paying ability, financial structure (stability), activity/efficiency ability, and profitability [2, 9, 10, 11]. Other many performance related papers have been published [1,5,6].
II. METHODS
According to literature review, we collected and filtered 28 indices in common use for evaluating business performance. Among the 28 indices, 18 indices are financial indices and 10 indices are non-financial indices. The main participants, who filled in the questionnaire, are 34 experts from electronic companies, from academics, and from accounting department. Through two-stage expert meeting and questionnaires, we collect, discuss and evaluate all the 28 indictors. The survey adopts a 5-point Likert scale (1=Not important at all, 5=very important).
[image:2.595.322.553.81.724.2]In order to choose critical indicators, we utilize 3 approaches to reduce the indices from 28 to 18. First, based on total number of “Important” and “Very Important,” shown in questionnaires for financial indices, the index of which total number is less than or equal to 27 is deleted and for non-financial indices, the index of which total number is less than or equal to 28 is deleted (see Table 1). After counting the total number of “Important” and “Very Important,” 10 out of 28 indices are removed. Therefore, times interest earned, debt-to-equity, total asset turnover, fixed asset turnover, gross profit margin, productivity, number of patents, upstream materials and supplies, downstream tactical alliances are erased.
Table 1 Financial and non-financial indices-total number of important and very important
NO
Indictor Important
Very
Important Total
1 current ratio 24 6 30
2 quick ratio 21 9 30
3 cash ratio 20 13 33
4 working capital 18 13 31
5 Permanent capital to fixed assets
22 6 28
6 Debt ratio 16 16 32
7 Times interest earned
9 10 19
8 Debt-to-equity 19 8 27
9 Inventory turnover
14 14 28 10 Total asset
turnover
15 5 20 11 Accounts
receivable turnover
14 16 30
12 Fixed asset turnover
11 5 16 13 Average
collection period
16 13 29 14 Return on
assets
19 10 29 15 Return on
stockholders’ equity
14 16 30
16 Return on investment
20 10 30 17 Net profit
margin
16 15 31 18 Gross profit
margin
13 13 26 19 Product
competitiveness
13 20 33
20 Market share 19 11 30
21 Productivity 20 8 28
22 Product quality level
13 18 31 23 Number of
patents
14 25 25 24 R&D
expenditure ratio
18 26 26 25 Ability to
obtain critical technology
11 33 33
26 Capability to improve manufacturing processes
19 29 29
27 Upstream materials and supplies
19 27 27
28 Downstream tactical alliances
Second, the study also examines communalities of the 18 indices as criteria to select index. We divided the 18 indices into two groups-financial indices and non-financial indices. The financial group has 13 indices and the non-financial group has 5 indices. For the financial group, in line with the principal component -the values of communalities, we deleted the indicators, permanent capital to fixed assets and debt ratio of which extraction values of communalities are lower than 0.2 (see Table 2). Thus, 11 out of 13 indices are remained as shown in Table 3. For the non-financial group, none of index’s communalities is lower than 0.2. Thus, all 5 non-financial indices are kept (see Table 4).
Table 2 Communalities for the 18 indices including financial and non-financial indices
Communalities
1.000 .283 1.000 .506 1.000 .324 1.000 .365 1.000 .167 1.000 .198 1.000 .571 1.000 .635 1.000 .365 1.000 .297 1.000 .545 1.000 .590 1.000 .566 1.000 .336 1.000 .377 1.000 .299 1.000 .302
1.000 .480 current ratio
quick ratio cash ratio working capital permanent capital to fixed debt ratio
inventory turnover accounts receivable turnover average collection period return on assets
return on stockholder's equity return on investment net profit margin product competitiveness market share product quality level ability to obtain critical technology
capability to improve manufacturing processes
Initial Extraction
[image:3.595.324.545.74.188.2]Extraction Method: Principal Component Analysis.
Table 3 Communalities for the 11 financial indices
Communalities
1.000 .861
1.000 .628
1.000 .655
1.000 .634
1.000 .799
1.000 .848
1.000 .778
1.000 .830
1.000 .698
1.000 .641
1.000 .568
current ratio quick ratio cash ratio working capital inventory turnover
accounts receivable turnover average collection period return on assets
return on stockholder's equity return on investment net profit margin
Initial Extraction
Extraction Method: Principal Component Analysis.
Table 4 Communalities for the 5 non-financial indices
Communalities
1.000 .567
1.000 .610
1.000 .786
1.000 .484
1.000 .435
product competitiveness market share
product quality level ability to obtain critical technology
capability to improve manufacturing processes
Initial Extraction
Extraction Method: Principal Component Analysis.
. III. TECHNICAL INDICES AND ANALYSIS RESULTS 3.1 Financial and non-financial indices
Financial analysis can help managers identify major strength and weakness of a business. It is frequently used to evaluate business performance. There are 4 popularly financial abilities: liquidity/debt paying ability, financial structure/stability ability, activity/efficiency ability, and profitability. In the following, we list the equation for each financial index and its frequency appeared in business performance related papers in the past few years.
Liquidity/debt paying ability means that businesses are able to pay short term debt paying. It includes current ratio, quick ratio, and cash ratio. The equations of these ratios are giving as follows:
Index Frequency
current ratio =(
s liabilitie current
assets current
) 4
Quick ratio=(
s liabilitie current
inventory -assets
current )
3
Cash ratio=(
s liabilitie current
securities marketable s
equivalent
cash ) 1
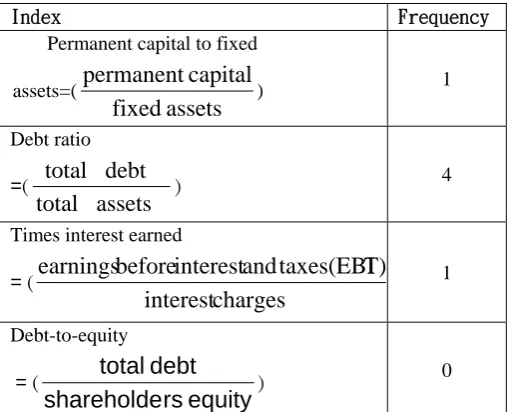
Financial structure/stability represents the ability to pay total current liabilities or long term debt. It indicates the company’s risk exposure in meeting debt services charges. There are four common uses of indices as follows:
Index Frequency
Permanent capital to fixed assets=(
assets
fixed
capital
permanent
) 1
Debt ratio
=(
assets
total
debt
total
) 4
Times interest earned
= (
charges
interest
T)
taxes(EBI
and
interest
before
earnings
1Debt-to-equity = (
equity
rs
shareholde
debt
total
[image:3.595.311.566.551.757.2]Activity /efficiency ability assesses how efficiently a firm is using resources. It commonly consists of inventory turnover, total asset turnover, accounts receivable turnover, fixed asset turnover, fixed asset turnover, average collection period, and working capital.
Index Frequency
Inventory turnover = (
inventory
average
sold
goods
of
cost
)
2
Total asset turnover = (
assets
total
average
sales
net
)
3
Accounts receivable turnover = (
receivable
gross
average
sales
net
) 1
Fixed asset turnover = (
assets
fixed
average
sales
net
)
1
Average collection period = (
sales/365
credit
receivable
accounts
)
1
working capital
= (current assets-current liabilities)
1
Profitability measures a firm's ability to generate profit or operation profit on sales, assets, and owners' investment. It contains five indices, return on assets, return on
stockholders’ equity, return on investment, net profit margin, and gross profit margin as shown below:
Index Frequency
Return on assets
= (
assets
total
profit
)
4
Return on stockholders’ equity =
(
equity
rs'
stockholde
(EAT)
taxes
after
earnings
)
3
Return on investment
=
(
assets
total
taxes(EAT)
after
earnings
)
3
Net profit margin =
(
sales
(EAT)
taxes
after
earnings
)
1
Gross profit margin = (
sales
sales
of
cost
-sales
)
1
For non-financial dimension, there are five critical indices including marketability of technology, competition performance, manufacturing capability, innovation capability, and supply-chain relationships. Product competitiveness is mainly composed of product competitiveness and competition performance is composed of market share. With respect to manufacturing capability, it can be classified into two parts: productivity and product quality level. Innovation capability can be divided into four parts: number of patents, R&D expenditure ratio, ability to obtain critical technology, and capability to improve manufacturing processes. Supply-chain relationships consist of upstream materials and supplies, and downstream tactical alliances.
Dimension Index
Marketability of technology
Product competitiveness
Competition performance
Market share
Manufacturin g capability
Productivity
Product quality level
Innovation capability
Number of patents R&D expenditure ratio
Ability to obtain critical technology Capability to improve
manufacturing processes
Supply-chain relationships
Upstream materials and supplies Downstream tactical alliances
3.2 Analysis results
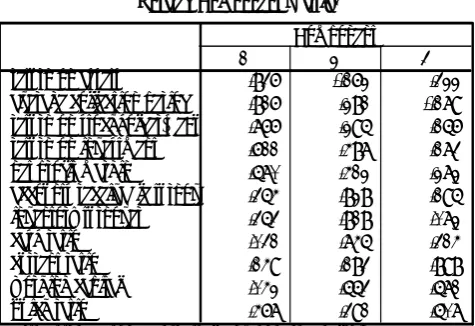
of which value is less than 0.2, there remain 11 financial indices. Then, while we tested 11 financial indices after deleting permanent capital to fixed assets and debt ratio, the KMO value was increased to 0.765>0.5(see Table 6). The value means that conducting factor analysis is good enough. Moreover, the value of Chronbach’s alpha provides a measure of internal consistency. The closer the alpha is to 1, the greater the internal consistency of the items being assessed. The value of Chronbach’s alpha is 0.896 and demonstrates excellent internal consistency. Apparently there is no any alpha value of variable which would increase if the variable is deleted from Table 7. Finally, in Table 8, we select three factors with eigenvalues larger than 0.98 and their accumulate percentage of variance is 72.174. Table 9 shows the component matrix before rotation. Owing to the values of components 2 and 3 with low values, Table 9 needs to be done a rotation. Table 10 illustrates the rotated component matrix. According to Table 2.10, three factors are named as (1)
Profitability Ability-return on
assets,
return on stockholders’ equity, return oninvestment, and net profit margin, (2) Efficiency Ability- average collection period, accounts receivable turnover, inventory turnover, working capital, and (3) Liquidity- current ratio, quick ratio, and cash ratio. Additionally, the non-financial 5 indices are included as the fourth factor. Its KMO value for the 5 non-financial indices is 0.759>0.5, which means that factor analysis is also good enough. Furthermore, the value of the Bartlett’s test of sphericity, 0.0 <0.05, shows that the data are the multivariate normal and acceptable for factor analysis (see Tables 11 and 12). Consequently, there are four factors with 16 indices to process the AHP method to determine the weight of each index.
Table 5 KMO and Bartlett’s Test for the 18 indices
KMO and Bartlett's Test
.617
366.893 153 .000 Kaiser-Meyer-Olkin Measure of Sampling Adequacy.
Approx. Chi-Square df
[image:5.595.320.570.72.244.2]Sig. Bartlett's Test of Sphericit
Table 6KMO and Bartlett’s test for the 11 financial indices after deletedpermanent capital to fixed assets and debt ratio
KMO and Bartlett's Test
.765 200.054 55 .000 Kaiser-Meyer-Olkin Measure of Sampling Adequacy.
Approx. Chi-Square df
Sig. Bartlett's Test of Sphericity
Table 7 Item-Total Statistics
Item-Total Statistics
42.5588 23.527 .490 .894
42.5000 21.591 .684 .883
42.2647 23.291 .540 .891
42.3235 22.832 .532 .892
42.4118 20.553 .712 .881
42.2647 20.988 .783 .877
42.4118 21.765 .566 .891
42.4706 22.863 .498 .894
42.2647 21.534 .688 .883
42.4412 21.830 .718 .881
42.2647 21.958 .669 .884
current ratio quick ratio cash ratio working capital inventory turnover accounts receivable tu average collection per return on assets return on stockholder' return on investment net profit margin
Scale Mean if
Item Deletedf Item Deletedcale Variance Corrected Item-Total Correlation
Cronbach's Alpha if tem Deleted
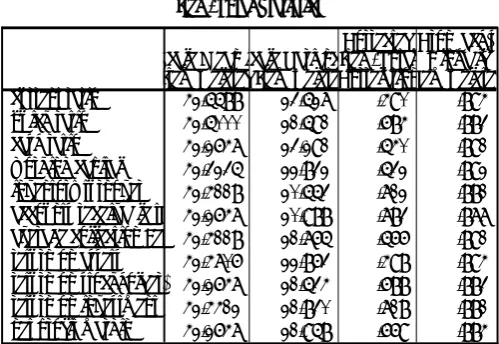
Table 8 Total variance explained for the 11 financial indices
Total Variance Explained
5.466 49.691 49.691 5.466 49.691 49.691 3.144 28.581 28.581 1.487 13.521 63.212 1.487 13.521 63.212 3.001 27.283 55.864 .986 8.962 72.174 .986 8.962 72.174 1.794 16.311 72.174 .735 6.682 78.857
.646 5.869 84.726 .515 4.686 89.411 .370 3.362 92.773 .265 2.411 95.184 .242 2.202 97.386 .182 1.656 99.041 .105 .959 100.000 Compo
1 2 3 4 5 6 7 8 9 10 11
Total of Varianmulative Total of Varianmulative Total of Varianmulative Initial Eigenvalues ion Sums of Squared Loon Sums of Squared Loa
Extraction Method: Principal Component Analysis.
Table 9 Component matrix for the 11 financial indices
Component Matrixa
.844 -.225 -.291
.788 -.170 -.386
.781 .150 -.095
.759 -.051 .222
.749 .371 .012
.744 .115 .025
.638 .555 -.250
.630 -.479 -.170
.616 -.481 .151
.564 .582 .415
.575 -.352 .638
accounts receivable turno inventory turnover return on investment quick ratio
return on stockholder's eq net profit margin average collection period cash ratio
working capital return on assets current ratio
1 2 3
Component
Extraction Method: Principal Component Analysis. 3 components extracted.
[image:5.595.55.285.601.652.2]Table 10 Rotated Component matrix for the 11 financial indices
Rotated Component Matrixa
.836 -.162 .322
.816 .281 -.179
.766 .295 .156
.611 .487 .173
.570 .412 .272
.354 .828 .195
.353 .818 .072
.031 .745 .314
.149 .183 .898
.042 .553 .571
.467 .391 .507
return on assets
average collection period return on stockholder's equ return on investment net profit margin
accounts receivable turnove inventory turnover cash ratio current ratio working capital quick ratio
1 2 3
Component
Extraction Method: Principal Component Analysis. Rotation Method: Varimax with Kaiser Normalization.
Rotation converged in 7 iterations. a.
Table 11 KMO and Bartlett’s Test for the 5 non-financial indices
KMO and Bartlett's Test
.759
58.066 10 .000 Kaiser-Meyer-Olkin Measure of Sampling Adequacy.
Approx. Chi-Square df
[image:6.595.49.289.463.547.2]Sig. Bartlett's Test of Sphericit
Table 12 Total variance explained for the 5 non-financial indices
Total Variance Explained
2.883 57.658 57.658 2.883 57.658 57.658 .868 17.365 75.024
.604 12.071 87.094 .397 7.932 95.026 .249 4.974 100.000 Compon
1 2 3 4 5
Total of Variancumulative %Total of Variancumulative % Initial Eigenvalues raction Sums of Squared Loadi
Extraction Method: Principal Component Analysis.
IV. CONCLUSION AND FUTURE WORKS
This paper constructs a business performance evaluation model by using financial and non-financial index model. We examined more than 40 indices for evaluating business performance through literature review. 28 out of 40 indices are chosen as critical indices. Next, a two-stage expert meeting and questionnaire have been done to count the total number of “Important” and “Very Important” for each financial and non-financial index. After that, we also used the principal component -the values of communalities, to select the indictors. Consequently, 16 out of 28 indices are remained for evaluating business performance. Finally, the principal component is adopted for running factor analysis. Based on the result of factor analysis, there are four factors named as (1) Profitability Ability-return on assets, return on stockholders’ equity, return on investment, and net profit
capital, and (3) Liquidity- current ratio, quick ratio, and cash ratio. Additionally, the non-financial 5 indices are included as the fourth factor. Consequently, there are four factors with 16 indices to process the AHP method to determine the weight of each index.
At present, an AHP method is being applied to calculate the priority, weight, of the 16 selected financial and non-financial factors for measuring business performance. Once the model is built, we will develop an artificial neural network to automatically classify the level of business performance for each company in the same industry. Hence, each business knows what business performance it is and what position the company is. Then a decision support system will be created and the DSS can provide vital suggestions to top-level managers for running the company.
REFERENCES
[1 S. Dwyer, O. C. Richard, & K. Chadwick, “Genderdiversity in management and firm performance: the influence of growth orientation and organizational culture,” Journal of Business Research, 56, 2003, pp.1009-1019.
[2] C.H. Gibson, “Financial reporting and analysis,"
South-western CENGAGE Learning, 2009.
[3] D. Gursoy, & N. Swanger, “Performance-enhancing internal strategic factors and competencies: Impacts on financial success.” Hospitality Management, 26, 2007, pp. 213-227.
[4] Z. Hoque, “A contingency model of the association between strategy, environmental uncertainty and performance measurement: impact on organizational performance,” International Business Review, 13, 2004, pp.485-502.
[5] M. Lam, ”Neural network techniques for financial performance prediction:integrating fundamental and technical analysis,” Decision Support systems, 37, 2004, pp.567-581.
[6] M. J. Lebas, “Performance measurement and performance management,” Internatinal Journal of Production Economics, 41, 1995, pp.23-35.
[7] C. Lin,, W. S. Chow, C. N. Madu,, C. H. Kuei,, & P. P. Yu, “A structural equation model of supply chain quality management and organizational performance,”
Int. J. Production Economics, 96, 2005, pp. 355-365. [8] A. S. Maiga, & F. A. Jacobs, “The Association between
benchmarking and organizational performance: an empirical investigation,” Managerial Finance, 30, 2004, pp.13-33.
[9] J.R. McGuigan, W.J. Kretlow, R.C. Moyer, Contemporary corporate finance,"South-western CENGAGE Learning, 2009.
[10] M. E. Qcal, E. L. Oral,, E. Erdis,, & G. Vural, “Industry financial ratios-application of factor analysis in Turkish construction industry,” Building and Environment, 42,
2007, pp.385-392.