Available online throug
ISSN 2229 – 5046
A FUZZY APPROACH FOR SOLVING PRODUCTION SYSTEM PROBLEM
M. M. SOLOMON
M.Sc. thesis in Operations Research and Management,
Cairo University, ISSR, 12613 Giza, Dr. Ahmed Zoweel Street, Egypt.
Prof. Dr. Hegazy Mohamed Zaher
Professor of Mathematical Statistics, Cairo University, ISSR.
Assoc. Prof. Dr. Naglaa Ragaa Saeid
Assoc. Prof. of Operations Research and Management, Cairo University, ISSR.
(Received On: 04-06-18; Revised & Accepted On: 03-07-18)
ABSTRACT
S
olving multi-objective optimization problem in manufacturing field normally includes variety of challenges. It is important to maximize profit, improve quality of a product mean while reduce losses and cost. This trade-off plays a multiple role in solving many manufacturing optimization problems. The Chocoman Company USA produces varieties of chocolate bars, candy and wafer by means of raw materials. The decision maker has a fuzzy goal such as objective functions and the objective of this company is to maximize the five objective functions with eight variables. The formulation of this problem resulted in five functions to be optimized based twenty nine constraints to be satisfied. This is typical fuzzy multi-objective linear programming problem. This problem occurs in production planning management where by a decision maker plays an important role in making decision in a fuzzy goal environment. As an analyst, we try to find a good enough solution for the decision maker to satisfy his goals. Many methods attempted to solve this problem without considering the decision maker has a fuzzy goal. In this paper, we provide a fuzzy multi-objective linear programming method to solve the chocolate production system problem.Keywords: multi-objective optimization, fuzzy goal, Chocolate Production System, fuzzy multi-objective linear programming fuzzy Decision.
1. INTRODUCTION
Most manufacturing engineering problems involve multi-objective and sometimes the decision maker has a fuzzy goals. For example, maximize profit, maximize revenue, minimize cost, maximize units produced etc. these are difficult but practical problems which normally happen [4]. In this paper, we report on the application of the fuzzy programming methodology to a real life problem of production system chocolate problem. The data for this problem has been adopted from the data-bank of chocolate Inc., USA [8]. In 2012 Alaa Sheta et al. solved this problem by used both the Scalarization and the Pareto methods; they compared their results with the results [6]. The developed results show an improvement in the produced optimal values to solve the multi objective problem for the chocolate production system than the recent reported results. The new problem occurs in manufacturing engineering where a decision maker plays an important role in making decisions within a fuzzy goal such as objective functions. As an analyst, we seek the best methodology for the decision maker with fuzzy goals to adopt in order to identify a final decision for implementation to satisfy a decision maker's goals [7]. There is a generality of content for this problem where the decision maker has a fuzzy goal. Therefore it is appropriate that this problem is solved using a (FMOLP) fuzzy multi-objective linear programming approach [5]. In this paper the main motivation is to solve the well-known chocolate production system problem using fuzzy multi-objective linear programming algorithm. A comparison between the results of fuzzy multi-objective linear programming method and the results of Pareto method [1] will be provided. A real life industrial problem is selected to demonstrate the methodology and a solution is achieved. The paper is outlined as follows. In section 2, we present problem definition. In section 3, we present the methodology of fuzzy multi-objective linear programming. In section 4, we present the case study of chocolate production system problem. In section 5, we present the results and discussion. The paper ends with conclusion.
Corresponding Author: M. M. SOLOMON
2. PROBLEM DEFINITION
Main problem is about solving multi-objective optimization problem and the decision maker has a fuzzy goal such as objective functions. The fuzzy objective functions are characterized by their membership functions and the degree of satisfaction of these membership functions. We want to satisfy (optimize) the objective functions of this problem and we want to reach to the highest degree of satisfaction of the fuzzy goals of the decision maker. This problem contained five objective functions with 8 parameters to be optimized and 29 constraints that should be satisfied at the end of the solution process that finds the optimal set of parameters.
3. METHODOLOGY OF FMOLP PROBLEM
The concept of decision making in fuzzy environment involving several objectives was first proposed by bellman and Zaden (1970). Zimmermann (1978) applied their approach to vector maximum problem by transforming (FMOLP) fuzzy multi-objective linear programming problem to single objective linear programming.
In this paper we proposed fuzzy multi-objective linear programming approach as a tool to solve multi-objective optimization problem with fuzzy goal. In our problem we assumed that the decision maker has a fuzzy goal such as the objective function.
This approach can be used in particular for decision problems which have the structure of linear programming. Decision problems can be formulated as fuzzy decision models [5].
Zimmermann called the fuzzy decision the minimum operator, and for other aggregation patterns than the minimum operator.
H.-j. Zimmermann extended his fuzzy linear programming approach to the following multi-objective linear programming problem with K linear objective function Zi(x) = ci x, i = 1, 2,…, k .
Minimize Z(x) (Z1 (x), Z2 (x)… Zk (x)) T (1)
AX ≤ b X ≥ 0
where ci = (ci1,…,cin) , i = 1,2,…,k , x = (x1, x2, …, xn)T , b = (b1, …, bm)T and A = [aij] is an m*n matrix for each
of the objective function Z(x) = ci x, i = 1,2,…,k , of the problem, assume that the decision maker has a fuzzy goal such as '' the objective function Zi(x) should be substantially less than or equal to some value pi " then the
corresponding linear membership function. µLi (Zi(x)) is defined as:
µLi (Zi(x)) =
⎩ ⎨
⎧0 ; 𝑍𝑖(x)≥ 𝑍𝑖𝑜 Z𝑖(x)−Z𝑖𝑂
𝑍𝑖1−𝑍𝑖𝑂 ; 𝑍𝑖𝑜≥ 𝑍𝑖(x)≥ 𝑍𝑖1
1 ; 𝑍𝑖(x)≤ 𝑍𝑖1
(2)
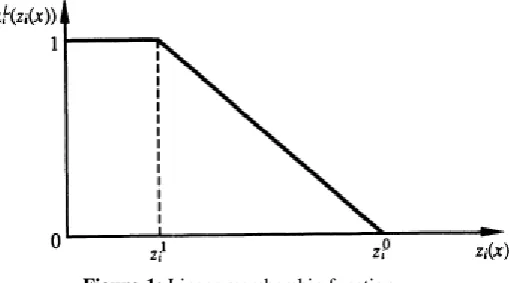
Where 𝑍𝑖𝑜 or 𝑍𝑖1 denotes the value of the objective function 𝑍𝑖(x) such that the degree of membership function is 0 or 1 respectively.
Figure 1 illustrates the graph of the possible shape of the linear membership function.
Figure-1: Linear membership function
The original multi-objective linear programming problem can be interpreted as:
Maximize min𝑖=1,…,𝑘{µ𝑖𝐿(𝑍𝑖(x))} (3) Subject to AX ≤ b
By introducing the auxiliary variable λ, it can be reduced to the following conventional linear programming problem: Maximum λ
Subject to λ≤ µ𝑖𝐿(𝑍𝑖(x)), i = 1, 2,…, k (4) AX ≤ b
X ≥ 0
By assuming the existence of the optimal solution 𝑋𝑖𝑜 of the individual objective function minimization problem under the constraints defined by
min𝑥∈𝑋𝑍𝑖(x) , i = 1, 2,…, k (5)
Zimmermann suggested a way to determine the linear membership function µ𝑖𝐿(𝑍𝑖(x)). To be more specific, using the individual minimum
𝑍𝑖𝑚𝑖𝑛= 𝑍𝑖(𝑋𝑖𝑜) = min𝑥∈𝑋𝑍𝑖(x) , i = 1, 2,…, k (6)
Together with
𝑍𝑖𝑚= max(𝑍𝑖(𝑋𝑖𝑜), … ,𝑍𝑖(𝑋𝑖−1,𝑜),𝑍𝑖(𝑋𝑖+1,𝑜),𝑍𝑖(𝑋𝑘𝑜)) , i = 1, 2,…, k (7)
He determines the linear membership function as in (2) by choosing 𝑍𝑖1= 𝑍𝑖𝑚𝑖𝑛 and 𝑍𝑖𝑜 = 𝑍𝑖𝑚 . For this membership function, it can be easily shown that if the optimal solution of (3) or (4) is unique.
Amid et al. (2005) has provided procedure to state the classical linear programming as a fuzzy multi-objective linear programming (FMOLP) and subsequently formulize the equivalent crisp single objective model for the (FMOLP). Sequence of that procedure, which has been customized according to production system chocolate problem, is described as follows.
Step-1: Construct the fuzzy model of production system chocolate problem according to the criteria and the constraints of the decision maker (Equation 1).
Step-2: Determine the lower bound 𝑍𝑖𝑜and 𝑍𝑖1 upper bound of aspiration level (DM’s goal) for each objective. The limit of aspiration level (𝑍𝑖𝑜,𝑍𝑖1) can be obtained by either solving multi-objective as single objective problem.
Step-3: For the objective functions and fuzzy constraints, find the membership function according to (Equation 2).
Step-4: Formulate the equivalent crisp model of the fuzzy optimization problem according to (Equation 4).
Step-5: Solve the crisp model by using simplex method by any program to find the optimal solution x*.
4. CASE STUDY OF PRODUCTION SYSTEM CHOCOLATE PROBLEM
Chocoman Company USA is the famous production system chocolate problem for a chocolate exporting company. This company produces varieties of chocolate bars, candy and wafer using number of raw material and processes. Elaborately the Chocoman company manufactures produced 8 different kinds of chocolate products since there are 8 raw materials to be mixed in different proportions and 9 processes (i.e. facilities) to be utilized. The objective of this problem is to maximize the five objective functions with eight variables. The decision variables and the mathematical model for the chocolate problem are presented in [1].
To illustrate the fuzzy multi-objective linear programming, consider the following production system chocolate problem with five objective functions.
As we illustrated in step 1, we will construct the fuzzy model of production system chocolate problem according to the criteria and the constraints of the decision maker
Minimization – five objective functions F1: Revenue
-F1= -375x1-150x2-400x3-160x4-420x5-175x6-400x7-150x8
F2: profit
-F2= -180x1-83x2-153x3-72x4-130x5-70x6-208x7-83x8
F3: market share for chocolate bars
-F3= -0.25x1-0.1x2-0.25x3-0.1x4-0.25x5-0.1x6
F4: units produced
-F4= -x1-x2-x3-x4-x5-x6-x7-x8
F5: plant utilization
Subject to
1: X1-0.6x2≤ 0
2: X3-0.6x4≤ 0
3: X5-0.6x6≤ 0
4: -56.25x1-22.5x2-60x3-24x4-63x5-26.25x6+400x7+150x8≤ 0
5: (cocoa usage)
87.5x1+35x2+75x3+30x4+50x5+20x6+70x7+12x8 ≤ 100000
6: (milk usage)
62.5x1+25x2+50x3+20x4+50x5+20x6+30x7+12x8 ≤ 120000
7: (nuts usage)
0x1+0x2+37.5x3+15x4+75x5+30x6+0x7+0x8 ≤ 60000
8: (confectionary sugar usage)
100x1+40x2+87.5x3+35x4+75x5+30x6+210x7+24x8 ≤ 200000
9: (flour usage)
0x1+0x2+0x3+0x4+0x5+0x6+0x7+72x8 ≤ 200000
10: (aluminum foils usage)
500x1+0x2+500x3+0x4+0x5+0x6+0x7+250x8 ≤ 500000
11: (paper usage)
450x1+0x2+450x3+0x4+450x5+0x6+0x7+0x8 ≤ 500000
12: (plastic usage)
60x1+120x2+60x3+120x4+60x5+120x6+1600x7+250x8 ≤ 500000
13: (cooking facility usage)
0.5x1+0.2x2+0.425x3+0.17x4+0.35x5+0.14x6+0.6x7+0.096x8 ≤ 1000
14: (mixing facility usage)
0x1+0x2+0.15x3+0.06x4+0.25x5+0.1x6+0x7+0x8 ≤ 200
15: (forming facility usage)
0.75x1+0.3x2+0.75x3+0.3x4+0.75x5+0.3x6+0.9x7+0.36x8 ≤ 1500
16: (grinding facility usage) 0x1+0x2+0.25x3+0x4+0x5+0x6+0x7+0x8 ≤ 200
17: (wafer making facility usage) 0x1+0x2+0x3+0x4+0x5+0x6+0x7+0.3x8 ≤ 100
18: (cutting facility usage)
0.5x1+0.1x2+0.1x3+0.1x4+0.1x5+0.1x6+0.2x7+0x8 ≤ 400
19: (packaging facility usage)
0.25x1+0x2+0.25x3+0x4+0.25x5+0x6+0x7+0.1x8 ≤ 400
20: (packaging 2 facility usage)
0.05x1+0.3x2+0.05x3+0.3x4+0.05x5+0.3x6+2.5x7+0.15x8 ≤ 1000
21: (labor usage)
0.3x1+0.3x2+0.05x3+0.3x4+0.3x5+0.3x6+2.5x7+0.25x8 ≤ 1000
22: (demand for MC 250) X1 ≤ 500
23: (demand for MC 100) X2 ≤ 800
24: (demand for CC 250) X3 ≤ 400
25: (demand for CC 100) X4 ≤ 600
26: (demand for CN 250) X5 ≤ 300
27: (demand for CN 100) X6 ≤ 500
28: (demand for candy) X7 ≤ 200
29: (demand for wafer) X8 ≤ 400
Note that these five objective functions are the minimization of among the minus revenue (F1), profit (F2), market share
for chocolate bars (F3), units produced (F4) and plant utilization (F5).
Table-1: Minimum and maximum value of objective functions Objective function 𝐹𝑖𝑚𝑖𝑛 𝐹𝑖𝑚𝑎𝑥
F1 -611106 0
F2 -265206 0
F3 -357 0
F4 -2826 0
F5 -3520 0
As we illustrated in step 3, we will assume that the decision maker subjectively determined the corresponding linear membership functions µ𝑖𝐿 (Fi) , i = 1,2,3,4,5 as following:
⎩ ⎪ ⎨ ⎪
⎧ 𝑓𝑢𝑧𝑧𝑦𝑔𝑜𝑎𝑙𝑓𝑜𝑟𝐹1 ; µ𝐿1(−530000) = 0 , µ1𝐿(−590000) = 1 𝑓𝑢𝑧𝑧𝑦𝑔𝑜𝑎𝑙𝑓𝑜𝑟𝐹2 ; µ𝐿2(−220000) = 0 , µ2𝐿(−270000) = 1
𝑓𝑢𝑧𝑧𝑦𝑔𝑜𝑎𝑙𝑓𝑜𝑟𝐹3 ; µ𝐿3(−290) = 0 , µ3𝐿(−340) = 1 𝑓𝑢𝑧𝑧𝑦𝑔𝑜𝑎𝑙𝑓𝑜𝑟𝐹4 ; µ𝐿4(−2200) = 0 , µ4𝐿(−2700) = 1 𝑓𝑢𝑧𝑧𝑦𝑔𝑜𝑎𝑙𝑓𝑜𝑟𝐹5 ; µ𝐿5(−2750) = 0 , µ5𝐿(−3150) = 1
(8)
Where linear functions are assumed from µ𝐿= 0 to µ𝐿= 1 for i = 1, 2,3,4,5.
The fuzzy goals of the decision maker are assumed to be expressed by the following membership functions:
µLi (Fi(x)) =
⎩ ⎨
⎧F0 ; 𝐹𝑖(x)≥ 𝐹𝑖𝑜
𝑖(x)−F𝑖𝑂
𝐹𝑖1−𝐹𝑖𝑂 ; 𝐹𝑖𝑜≥ 𝐹𝑖(x)≥ 𝐹𝑖1
1 ; 𝐹𝑖(x)≤ 𝐹𝑖1
(9)
µL1(F1(x)) = �
0 ; 𝐹1(x)≥ −530000 −375X1−150X2−400X3−160X4−420X5−175X6−400X7−150X8+530000
−60000 ; −530000≥ 𝐹1(x)≥ −590000
1 ; 𝐹1(x)≤ −590000 (10)
µL2(F2(x)) = �
0 ; 𝐹2(x)≥ −220000 −180X1−83X2−153X3−72X4−130X5−70X6−208X7−83X8+220000
−50000 ; −220000≥ 𝐹2(x)≥ −270000
1 ; 𝐹2(x)≤ −270000 (11)
µL3(F3(x)) = �
0 ; 𝐹3(x)≥ −290 −0.25X1−0.1X2−0.25X3−0.1X4−0.25X5−0.1X6+290
−50 ; −290≥ 𝐹3(x)≥ −340
1 ; 𝐹3(x)≤ −340
(12)
µL4(F4(x)) = �
0 ; 𝐹4(x)≥ −2200 −X1−X2−X3−X4−X5−X6−X7−X8+2200
−500 ; −2200≥ 𝐹4(x)≥ −2700
1 ; 𝐹4(x)≤ −2700 (13)
µL5(F5(x)) = �
0 ; 𝐹5(x)≥ −2750 −1.65X1−0.9X2−1.975X3−1.03X4−1.75X5−0.94X6−4.2X7−1.006X8+2750
−400 ; −2750≥ 𝐹5(x)≥ −3150
1 ; 𝐹5(x)≤ −3150 (14)
As we illustrated in step 4, the equivalent crisp model of the fuzzy optimization problem formulated as following:
Maximum λ Subject to
0.006x1-0.0025x2+0.007x3+0.0026x4+0.007x5+0.003x6+0.007x7+0.0025x8-λ ≤8.8
0.0036x1-0.0017x2+0.003x3+0.0014x4+0.0026x5+0.0014x6+0.0042x7+0.0017x8-λ ≤7.7
0.005x1-0.002x2+0.005x3+0.002x4+0.005x5+0.002x6-λ ≤4.4
0.002x1-0.002x2+0.002x3+0.002x4+0.002x5+0.002x6+0.002x7+0.002x8-λ ≤4.4
0.004x1-0.0023x2+0.005x3+0.0026x4+0.0044x5+0.0024x6+0.011x7+0.0025x8-λ ≤6.88
X1-0.6x2≤ 0
X3-0.6x4≤ 0
X5-0.6x6≤ 0
-56.25x1-22.5x2-60x3-24x4-63x5-26.25x6+400x7+150x8≤ 0
62.5x1+25x2+50x3+20x4+50x5+20x6+30x7+12x8 ≤ 120000
0x1+0x2+37.5x3+15x4+75x5+30x6+0x7+0x8 ≤ 60000
100x1+40x2+87.5x3+35x4+75x5+30x6+210x7+24x8 ≤ 200000
0x1+0x2+0x3+0x4+0x5+0x6+0x7+72x8 ≤ 200000
500x1+0x2+500x3+0x4+0x5+0x6+0x7+250x8 ≤ 500000
450x1+0x2+450x3+0x4+450x5+0x6+0x7+0x8 ≤ 500000
60x1+120x2+60x3+120x4+60x5+120x6+1600x7+250x8 ≤ 500000
0.5x1+0.2x2+0.425x3+0.17x4+0.35x5+0.14x6+0.6x7+0.096x8 ≤ 1000
0x1+0x2+0.15x3+0.06x4+0.25x5+0.1x6+0x7+0x8 ≤ 200
0.75x1+0.3x2+0.75x3+0.3x4+0.75x5+0.3x6+0.9x7+0.36x8 ≤ 1500
0x1+0x2+0.25x3+0x4+0x5+0x6+0x7+0x8 ≤ 200
0x1+0x2+0x3+0x4+0x5+0x6+0x7+0.3x8 ≤ 100
0.5x1+0.1x2+0.1x3+0.1x4+0.1x5+0.1x6+0.2x7+0x8 ≤ 400
0.25x1+0x2+0.25x3+0x4+0.25x5+0x6+0x7+0.1x8 ≤ 400
0.05x1+0.3x2+0.05x3+0.3x4+0.05x5+0.3x6+2.5x7+0.15x8 ≤ 1000
0.3x1+0.3x2+0.05x3+0.3x4+0.3x5+0.3x6+2.5x7+0.25x8 ≤ 1000
X1 ≤ 500
X2 ≤ 800
X3 ≤ 400
X4 ≤ 600
X5 ≤ 300
X6 ≤ 500
X7 ≤ 200
X8 ≤ 400
5. RESULTS AND DISCUSSIONS
We solved this problem by the simplex method of linear programming yields. The optimal solution:
Table-2: the optimal solution of the Chocoman Inc. problem Objective function Solution values
F1 (revenue) 608501
F2 (profit) 263538
F3 (market share chocolate bars) 333.85
F4 (units produced) 2822.1
F5 (plant utilization) 3440.7
Decision variables Solution values
X1 15.4
X2 800
X3 260
X4 600
X5 300
X6 500
X7 68.9
X8 277.77
λ 0.8769
This means that the overall satisfaction of the fuzzy goals of the decision maker is 0.8769, the total revenue (-F1) is
608501, and the total profit (-F2) is 263538, and the market share chocolate bars (-F3) is 333.85, and the total units
produced (-F4) is 2822.1, and the plant utilization (-F5) is 3440.7
Alaa Sheta et al. (2012) used Scalarization method to maximize the profit and comparing their results with previous work and used Pareto method to maximize the all objective functions of production system chocolate problem.
Alaa Sheta et al. solved the problem by running the GEATbx at different population sizes 20, 50, and 100. The sizes of the populations were selected arbitrary. In each case, they run GEATbx to find the optimal value of each function used various population sizes.
By the end of the evolutionary process, the developed results with population size 100 looked the best. In our paper we compared our results with the results of the Pareto method with population size 100.
The computed values of the parameters X1 to X8 along with the optimal values of the objective functions of the Pareto
Table-3: comparisons between results of Pareto method with population 100 and results of fuzzy multi-objective linear programming method
objective function Pareto method with population size = 100
Fuzzy multi-objective linear programming method
F1 539890 608.501
F2 242650 263538
F3 310.24 333.85
F4 2456.4 2822.1
F5 2967.8 3440.7
Decision variables and solution values
X1 271.96 15.37
X2 681.61 800
X3 134.89 260
X4 520.2 600
X5 183.76 300
X6 424.11 500
X7 44.42 68.88
X8 195.4 277.7
After comparison between results of Pareto method with population 100 and results of fuzzy multi-objective linear programming method we note that the optimal values of the objective functions using fuzzy multi-objective linear programming method are (F1) Revenue 608501, (F2) Profit 263538, (F3) market share chocolate bars 333.85, (F4) units produced 2822.1, and (F5) plant utilization 3440.7 which are better than the optimal values (F1) Revenue 539890, (F2) Profit 242650, (F3) market share chocolate bars 310.24, (F4) units produced 2456.4, and (F5) plant utilization 2967.8 which were obtained by Pareto method with population size 100.
5. CONCLUSION
In this paper, we provided a solution to the most famous production system chocolate problem using fuzzy multi-objective linear programming approach. The problem was about solving multi-multi-objective optimization problem and the decision maker had a fuzzy goal such as the objective function. The constructed fuzzy multi-objective linear programming as a methodology for this work has solved the problem successfully and the comparison with Pareto method appeared best results. And we found the decision maker process and the implementation will be easier if the decision maker and the implementer can work together with the analyst to achieve the best outcome with respect to degree of satisfaction.
REFERENCES
1. Alaa Sheta, Abdel Karim Baareh, Mohamed Ababna, and Noor Khrisat, "multi-objective evolutionary computation solution for chocolate production system using Pareto method.", in the international journal of computer science issues, vol 9, issue 1, no. 3,( 2012), p. 75-83.
2. Amid, A., Ghodsypour, S. H., and O'Brien, C., "Fuzzy multi-objective linear model for supplier selection in a supply chain". International Journal Production Economics, 104, (2005), 394-407.
3. Bellman, R. E and L. A. Zadeh. "Decision making in a fuzzy environment.” Management Science, 17, (1970), pp. 141-164.
4. C. Coello "an empirical study of evolutionary techniques for multi-objective optimization in engineering design.” Ph.D. dissertation in department of computer science, Tulane University, (1996).
5. H.-J. Zimmermann, "fuzzy programming and linear programming with several objective function.", fuzzy set and systems 1, (1978), p. 45-55.
6. H. Turabieh, A. Sheta, and P. Vasant, "Hybrid optimization genetic algorithm (HOGA) with interactive evolution to solve constraint optimization problems for production system.", in the international journal of computational science, vol. 1, no. 4, (2007), pp. 395-406.
7. Pandian M. vasant, Ramachandran Nagarajan, and Sazali Yaacob, "application of modified s-curve membership function in decision making process using FLP approach.", in the Scientia Mathematicae Japonicae Online, vol. 10,( 2004), pp. 513-527.
8. S. Susanto, P .Vasant, A. Bhattacharya, and F. Pratikto, "Fuzzy LP with a nonlinear MF for product-mix solution: A case-based re-modeling and solution.", in The 11th International Conference on Fuzzy Theory and Technology FTT in conjunction with 9th Joint Conference on Information Sciences (JCIS), Kaohsiung, Taiwan, ROC, (2006), pp. 1305–1308.
Source of support: Nil, Conflict of interest: None Declared.
[Copy right © 2018. This is an Open Access article distributed under the terms of the International Journal of Mathematical Archive (IJMA), which permits unrestricted use, distribution, and reproduction in any