Original Contribution
Maternal Consumption of Seafood in Pregnancy and Child Neuropsychological
Development: A Longitudinal Study Based on a Population With High
Consumption Levels
Jordi Julvez*, Michelle Méndez, Silvia Fernandez-Barres, Dora Romaguera, Jesus Vioque, Sabrina Llop, Jesus Ibarluzea, Monica Guxens, Claudia Avella-Garcia, Adonina Tardón,
Isolina Riaño, Ainara Andiarena, Oliver Robinson, Victoria Arija, Mikel Esnaola, Ferran Ballester, and Jordi Sunyer
*Correspondence to Dr. Jordi Julvez, ISGlobal, Centre for Research in Environmental Epidemiology (CREAL), Barcelona Biomedical Research Park,
C. Doctor Aiguader 8, 08003 Barcelona, Spain (e-mail: [email protected]).
Initially submitted March 13, 2015; accepted for publication July 14, 2015.
Seafood consumption during pregnancy is thought to be beneficial for child neuropsychological development, but to our knowledge no large cohort studies with high fatty fish consumption have analyzed the association by seafood subtype. We evaluated 1,892 and 1,589 mother-child pairs at the ages of 14 months and 5 years, respectively, in a population-based Spanish birth cohort established during 2004–2008. Bayley and McCarthy scales and the Child-hood Asperger Syndrome Test were used to assess neuropsychological development. Results from multivariate linear regression models were adjusted for sociodemographic characteristics and further adjusted for umbilical cord blood mercury or long-chain polyunsaturated fatty acid concentrations. Overall, consumption of seafood above the recommended limit of 340 g/week was associated with 10-g/week increments in neuropsychological scores. By subtype, in addition to lean fish, consumption of large fatty fish showed a positive association; offspring of persons within the highest quantile (>238 g/week) had an adjusted increase of 2.29 points in McCarthy general cognitive score (95% confidence interval: 0.42, 4.16). Similar findings were observed for the Childhood Asperger Syndrome Test. Beta coefficients diminished 15%–30% after adjustment for mercury or long-chain polyunsaturated fatty acid concentrations. Consumption of large fatty fish during pregnancy presents moderate child neuropsycho-logical benefits, including improvements in cognitive functioning and some protection from autism-spectrum traits.
autistic spectrum; fatty acids; mercury; neuropsychological development; population-based birth cohorts; pregnancy; seafood intake
Abbreviations: DDE, 2,2-bis(p-chlorophenyl)-1,1-dichloroethylene; DHA, docosahexanoic acid; FFQ, food frequency questionnaire; LC-PUFAs, long-chain polyunsaturated fatty acids; MSCA, McCarthy Scales of Children’s Abilities.
Maternal consumption of seafood during pregnancy has been associated with improvements in neuropsychological development among children in several studies (1,2). These beneficial associations are thought to be at least partly attrib-utable to higher intakes of key nutrients, including long-chain polyunsaturated fatty acids (LC-PUFAs) such asω-3 docosa-hexanoic acid (DHA), which is essential for optimal prenatal neurodevelopment (3), particularly during early stages of brain formation (3,4). DHA is not widely distributed in the
Western diet, and seafood, particularly fatty species offish, is the major source (1,3).
Nonetheless, elevated intakes of seafood during pregnancy are of concern, because seafood is an important source of neurotoxic contaminants such as methylmercury and organo-chlorine compounds, which have been associated with dec-rements in child neuropsychological scores (1,2). To help balance these risks and benefits, guidelines issued by the United States, the United Kingdom, and the European Union
January 5, 2016
advise pregnant women with regard to their seafood intakes (1,5,6). The US Food and Drug Administration’s 2014 draft recommendations (6) emphasize selecting subtypes of sea-food that are lower in these contaminants, with consistent advice to avoid the consumption of large predatoryfish such as shark, swordfish, king mackerel, and tilefish and to limit consumption of albacore tuna, despite the fact that large fattyfish such as tuna contain some of the highest levels of DHA (7).
These guidelines have been debated, since some studies have found no evidence of adverse associations with maternal seafood consumption exceeding 340 g/week, the current rec-ommended limit in the United States. However, the recently issued scientific opinion report of the European Food Safety Authority contained a less restrictive recommendation, in which
beneficial health associations are limited to 1–4 servings offish per week (150–600 g), despite the uncertainties regarding serving sizes in European epidemiologic studies (5,8,9). However, the studies supporting the guideline statements did not examine associations with different subtypes of sea-food (2). Thus, at present there is insufficient knowledge on the association between seafood consumption in pregnancy and child neuropsychological outcomes.
In the present study, we examined maternal seafood con-sumption during pregnancy and child neuropsychological development in a Spanish multicenter birth cohort, where average consumption exceeds current US recommended levels and allows the study of numerous seafood subtypes. We aimed to assess associations of consumption of large and small fatty fish, leanfish, and shellfish, as well as total seafood, with a Table 1. Sociodemographic and Environmental Characteristics of Mothers and Offspring According to Median
Maternal Seafood Consumption in the First Trimester of Pregnancy, Spanish Childhood and Environment (INMA)
Project, 2004–2008
No. of Subjects
Median Seafood Intake, g/week
Total Large Fatty Fish
Smaller
Fatty Fish Lean Fish Shellfish
Maternal Characteristics
Age, years
<31 946 422a 0a 14a 260a 45a
≥31 1,049 482a 50a 31a 296a 52a
Education
Primary school or less 424 401a 0a 20 228a 44a
Secondary school 829 460a 42a 25 287a 52a
University or more 738 473a 49a 29 304a 49a
Social class
Highly skilled 815 483a 50a 35a 308a 53a
Nonmanual 730 439a 38a 0a 268a 47a
Manual 423 434a 0a 28a 352a 46a
Prepregnancy body mass indexb
Tertile 1 647 439 31a 26 274a 47
Tertile 2 675 465 47a 23 296a 50
Tertile 3 673 459 46a 27 274a 51
Parity
Nulliparous 1,135 457 44 20a 282 51a
Parous 858 453 41 31a 284 47a
Born in Spain
Yes 1,858 463a 45a 28a 288a 50a
No, in Latin America 88 322a 0a 0a 171a 33a
No, in other place 46 421a 0a 0a 263a 30a
Smoked throughout entire pregnancy
No 1,630 462a 45a 29a 288a 49a
Yes 333 423a 13a 18a 248a 46a
Alcohol use throughout entire pregnancy
No 1,040 436a 37a 0a 275a 45a
Yes 929 475a 47a 36a 290a 52a
Table continues
range of neuropsychological outcomes, including cognitive and motor functioning and autism-spectrum traits, at 2 ages (14 months and 5 years). We also investigated the roles of mercury and LC-PUFAs in umbilical cord blood, maternal biomarkers of other environmental pollutants and nutrition, and child seafood consumption in these associations.
METHODS
Subjects
The Spanish Childhood and Environment (Infancia y Medio Ambiente) Project, a multicenter birth cohort study, was es-tablished between 2004 and 2008 in 4 regions of Spain: As-turias, Gipuzkoa (the Basque Country), Sabadell (Catalonia), and Valencia (10). Participant recruitment and follow-up pro-cedures have been reported in detail elsewhere (10). A total of 2,644 eligible women were recruited during prenatal visits in thefirst trimester of pregnancy. Women agreed to participate and met the inclusion (≥16 years of age, singleton pregnancy, intention to deliver at the reference hospital) and exclusion (communication handicap, fetuses with malformations, assis-ted conception) criteria. Women were followed up during preg-nancy, and their children were enrolled at birth and followed
until age 5 years. After exclusion of women who withdrew, were lost to follow-up, or had an elective or spontaneous abor-tion, a total of 2,506 pregnant women were monitored through delivery. Final analyses included 1,892 children at 14 months of age and 1,589 children at 5 years of age. The analysis ex-cluded 93 preterm infants (<37 weeks gestation), because pre-term births are known to differ from pre-term births with respect to neuropsychological development (11), and 18 children with pathologies, including plagiocephaly. A total of 522 children were lost to follow-up at age 14 months, and 341 were lost to follow-up at age 5 years. The remaining exclusions were attrib-utable to missing data on some covariates. All participants pro-vided written informed consent, and the study protocol was approved by hospital and institutional ethics committees in each region. Further information is given in the Web Appendix (available athttp://aje.oxfordjournals.org/).
Exposure and covariate information
Questionnaires, completed twice during pregnancy and at child ages of 14 months and 5 years, were administered by trained interviewers to obtain extensive information on maternal and child characteristics (Web Appendix, Web Ta-bles 1 and 2).
Table 1. Continued
No. of Subjects
Median Seafood Intake, g/week
Total Large Fatty Fish
Smaller
Fatty Fish Lean Fish Shellfish
Child Characteristics
Sex
Male 1,016 452 41 31a 280 48
Female 979 454 44 20a 284 50
Birth weight, g
<3,000 458 439 46 0a 279 48
3,000–3,500 939 459 41 35a 284 51
>3,500 585 451 44 15a 283 47
Gestational age, weeks
≤40 1,123 465a 46a 24 291a 47
>40 872 444a 38a 26 270a 51
Duration of breastfeeding (any), weeks
≤24 1,078 439a 40 0a 278a 48
>24 872 475a 45 36a 286a 50
Umbilical cord blood mercury level, µg/L
<8.5 746 396a 0a 24 248a 44a
≥8.5 795 509a 60a 30 325a 54a
Cord bloodω-6 AA:ω-3 EPA/ω-3 DHA ratioc
≤Median 389 511a 49a 46a 324a 54a
>Median 379 423a 0a 22a 259a 43a
Abbreviations: AA, arachidonic acid; DHA, docosahexanoic acid; EPA, eicosapentaenoic acid; INMA, Infancia y Medio Ambiente.
aP< 0.10 for difference between groups (Wilcoxon rank-sum test), by seafood subtype.
bWeight (kg)/height (m)2.
c Ratio of
ω-6 AA toω-3 EPA andω-3 DHA in umbilical cord blood.
We used a semiquantitative food frequency questionnaire (FFQ) of 101 food items to assess the usual daily intake of foods and nutrients at 10–13 weeks of pregnancy and again at 28–32 weeks. The FFQ was a modified version of a previous FFQ based on the Harvard questionnaire (12), adapted and validated among the pregnant women of the Valencia cohort (13). Further information is provided in the Web Appendix. Women reported their usual intake of foods from the last menstrual period to thefirst prenatal visit, using reference por-tions and 9 frequency categories ranging from never/less than once a month to more than 6 times per day. The questionnaire included 10 seafood items. The response to each seafood item was converted to average weekly intake in grams; then all sea-food items were summed to compute total consumption and consumption of seafood subtypes (in g/week). Seafood was classified a priori as follows: 1) large fattyfish, based on 1 item from the questionnaire (“baked or steamed larger fatty fish such as tuna, swordfish, albacore”); 2) smaller fattyfish, based on 2 items from the questionnaire (“baked or steamed
smaller fattyfish such as mackerel, sardines, anchovies, salmon” and“tinned sardines/mackerel”); 3) leanfish, based on 3 items from the questionnaire (“friedfish”;“baked or steamed lean fish such as hake, sole, or bream”; and“tinned tuna,”which has similar levels of DHA and mercury as leanfish); 4) shell-fish, based on 3 items from the questionnaire (“shrimp, prawns, lobster, or crab”;“clams, mussels, oysters”; and“squid, octo-pus, cuttlefish”); 5) smoked/saltedfish, based on 1 item from the questionnaire (“salted or smoked fish: anchovies, cod, salmon”); and 6) overall seafood intake, calculated as the sum of consumption of all items. Thefifth subtype group (smoked/ saltedfish) was excluded from individual analyses because of its low frequency of intake in this cohort.
Seafood consumption was adjusted for energy intake using the residual method (14) and analyzed primarily in quantile cat-egories of weekly grams. The quantile catcat-egories were created prior to analysis. For some of the seafood subtypes, the number of quantiles created was constrained by low intake frequency. In order to check for potential systematic bias in reporting by
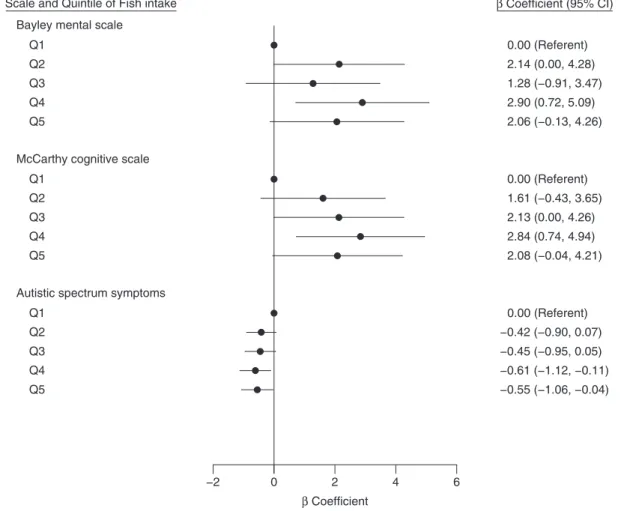
−2 0 2 4 6
β Coefficient
−0.55 (−1.06, −0.04) −0.61 (−1.12, −0.11) −0.45 (−0.95, 0.05) −0.42 (−0.90, 0.07)
0.00 (Referent) 2.08 (−0.04, 4.21) 2.84 (0.74, 4.94) 2.13 (0.00, 4.26) 1.61 (−0.43, 3.65) 0.00 (Referent) 2.06 (−0.13, 4.26) 2.90 (0.72, 5.09) 1.28 (−0.91, 3.47) 2.14 (0.00, 4.28) 0.00 (Referent)
Q5 Q4 Q3 Q2 Q1 Q5 Q4 Q3 Q2 Q1 Q5 Q4 Q3 Q2 Q1
Bayley mental scale
McCarthy cognitive scale
Autistic spectrum symptoms
Scale and Quintile of Fish intake β Coefficient (95% CI)
Figure 1. Associations between total maternal seafood consumption in the first trimester of pregnancy (quintiles) and general scores on the Bayley
Scales of Infant Development, the McCarthy Scales of Children’s Abilities, and the Childhood Asperger Syndrome Test in the Spanish Childhood and
Environment (Infancia y Medio Ambiente) Project, 2004–2008. Regression models adjusted for sex of the child, cohort, quality of the test, child’s birth
weight, gestational age, duration of breastfeeding, child’s age during testing, maternal age, energy intake (kcal/day) during pregnancy, educational level,
social class, prepregnancy body mass index, parity, and country of origin/birth. Median total seafood intake in each quintile (Q): Q1, 195 g/week; Q2, 338 g/week; Q3, 461 g/week; Q4, 600 g/week; Q5, 854 g/week. Q1 (vertical line) was the reference category. Bars, 95% confidence intervals (CIs).
educational level, we checked to see whether the sum of mean intakes by seafood subtype was similar to the mean total intake in each educational level category; we found no mean differences (data not shown). Similar methods were applied to estimate seafood consumption of mothers at 28–32 weeks of pregnancy and seafood consumption of children at age 5 years.
Dietary intakes ofω-3 fatty acids (DHA and eicosapenta-enoic acid) were estimated from the FFQ, and use of supple-ments containingω-3 fatty acids, iodine, and folic acid was recorded (13). Cord-blood mercury and concentrations of
total fatty acids (including DHA), serum maternal organochlo-rine, and plasma 25-hydroxyvitamin D3and urinary iodine during pregnancy were measured as previously described (ex-tended information is provided in the Web Appendix and Web Tables 1 and 2).
Neuropsychological assessments
Child neuropsychological development was assessed at ages 14 months and 5 years using the Bayley Scales of Infant
−2 0 2 4 6
β Coefficient Q5
Q4 Q3 Q2 Q1 Q5 Q4 Q3 Q2 Q1 Q5 Q4 Q3 Q2 Q1 Q5 Q4 Q3 Q2 Q1 Q5 Q4 Q3 Q2 Q1 Q5 Q4 Q3 Q2 Q1
1.93 (−0.24, 4.09) 2.83 (0.69, 4.98) 1.74 (−0.43, 3.91) 1.06 (−1.02, 3.14) 0.00 (Referent) 1.61 (−0.62, 3.85) 2.48 (0.26, 4.69) 2.91 (0.68, 5.17) 1.81 (−0.36, 3.96) 0.00 (Referent) 1.56 (−0.69, 3.81) 3.09 (0.86, 5.31) 3.11 (0.86, 5.37) 1.04 (−1.12, 3.20) 0.00 (Referent) 1.94 (−0.34, 4.22) 3.34 (1.09, 5.60) 1.50 (−0.78, 3.78) 1.91 (−0.27, 4.10) 0.00 (Referent) 1.74 (−0.44, 3.91) 1.62 (−0.53, 3.77) 2.29 (0.11, 4.46) 1.66 (−0.43, 3.75) 0.00 (Referent) 1.57 (−0.67, 3.81) 2.36 (0.14, 4.57) 0.54 (−1.70, 2.78) 1.17 (−0.98, 3.33) 0.00 (Referent) Verbal
Perceptual-performance
Memory
Quantitative
Motor
Executive function MSCA Subarea and
Quintile of Fish Intake β Coefficient (95% CI)
Figure 2. Associations between total maternal seafood consumption in the first trimester of pregnancy (quintiles) and subarea scores on the
McCarthy Scales of Children’s Abilities (MSCA) in the Spanish Childhood and Environment (Infancia y Medio Ambiente) Project, 2004–2008.
Re-gression models adjusted for sex of the child, cohort, quality of the test, child’s birth weight, gestational age, duration of breastfeeding, child’s age
during testing, maternal age, energy intake (kcal/day) during pregnancy, educational level, social class, prepregnancy body mass index, parity, and country of origin/birth. Median total seafood intake in each quintile (Q): Q1, 195 g/week; Q2, 338 g/week; Q3, 461 g/week; Q4, 600 g/week; Q5, 854 g/week. Q1 (vertical line) was the reference category. Bars, 95% confidence intervals (CIs).
Development (15) and the McCarthy Scales of Children’s Abilities (MSCA) (16), respectively. Autism-spectrum traits were assessed at age 5 years using the Childhood Asperger Syndrome Test (17), which was administered after the MSCA test session. Further information is given in the Web Appen-dix and in Web Table 3.
Statistical analysis
Associations between total seafood consumption and in-take of different subtypes of seafood and neuropsychological scores were evaluated using separate multivariate linear regres-sion analyses. Seafood consumption was evaluated as both an ordinal (quantiles) and a continuous (10 g/week) variable (after testing of linearity by means of generalized additive models). Tests for linear trend were performed by including the median value of consumption within each quantile cate-gory in the regression models. Minimally adjusted regression models included adjustment for the age and sex of the child, cohort, total energy intake (kcal/day), and quality of the test
(good, regular, or low) as recorded by the psychologist after examination. Other important variables, evaluated as poten-tial confounders and mediators, are described in Web Tables 1 and 2. Confounders were retained only if they modified the coefficient of the seafood consumption parameter in the basic model by more than 5% (18). Thefinal models further adjusted for child’s gestational age and weight at birth, dura-tion of breastfeeding, maternal age, educadura-tional level, social class, parity, prepregnancy body mass index (weight (kg)/ height (m)2), and country of origin/birth.
Sensitivity analyses adjusted for concentrations of cord-blood mercury and LC-PUFAs and other biomarkers and food supplements (listed in Web Tables 1 and 2), through inclu-sion in regresinclu-sion models as continuous variables. Generalized additive models were used to assess the linearity assumption. As a result, the mercury variable was log10-transformed to achieve linearity. In secondary analyses,final-model calcula-tions were repeated with maternal seafood consumption dur-ing the third trimester of pregnancy (Spearman’sr= 0.50, first-trimester consumption) and child seafood consumption Table 2. Associations Between Maternal Seafood Consumption in the First Trimester of Pregnancy and Child’s
Score on the Bayley Mental Scale at Age 14 Months, Spanish Childhood and Environment (INMA) Project, 2004–2008
Seafood Intakea No. of Subjects
Difference in Child’s Neurobehavioral Scoreb
Minimally Adjustedc Fully Adjustedd
β 95% CI β 95% CI
All Seafood
Continuous variable, 10 g/weeke 1,892 0.02f
−0.00, 0.06 0.02f
−0.00, 0.05
Quintiles
1g 383 0.00 Referent 0.00 Referent
2 392 2.13f −0.03, 4.29 2.14h 0.00, 4.28
3 364 1.53 −0.67, 3.73 1.28 −0.91, 3.47
4 386 3.03h 0.84, 5.22 2.90h 0.72, 5.09
5 367 2.02f
−0.19, 4.22 2.06f
−0.13, 4.26
Pfor trend 0.08 0.08
Large Fatty Fish
Continuous variable, 10 g/week 1,892 0.00 −0.07, 0.08 0.00 −0.07, 0.08
Quartiles
1 853 0.00 Referent 0.00 Referent
2 341 0.28 −1.66, 2.22 0.08 −1.84, 2.01
3 345 −0.16 −2.12, 1.79 −0.12 −2.06, 1.82
4 353 0.71 −1.24, 2.67 0.51 −1.43, 2.46
Pfor trend 0.510 0.623
Small Fatty Fish
Continuous variable, 10 g/week 1,892 0.06 −0.02, 0.14 0.06 −0.02, 0.15
Quartiles
1 877 0.00 Referent 0.00 Referent
2 333 2.16h 0.14, 4.19 1.79f
−0.22, 3.80
3 338 −0.47 −2.40, 1.46 −0.37 −2.29, 1.55
4 344 2.63h 0.71, 4.55 2.45h 0.54, 4.36
Pfor trend 0.02 0.03
Table continues
(r= 0.22,first-trimester-consumption) included as indepen-dent variables; exclusion of tinned tuna from the leanfish subtype group; the reference group for total seafood con-sumption changed to≤340 g/week; and stratification of the analyses by geographical location (Cantabric Sea (Asturias + Gipuzkoa) vs. Mediterranean Sea (Sabadell + Valencia)). All analyses were conducted with the STATA 12 (StataCorp LP, College Station, Texas) statistical software package.
RESULTS
Average reported total seafood consumption was 498 g/week (median, 454 g/week), which is considered by the European Food Safety Authority to be about 3 servings per week. Very few participants (n= 15; 0.8%) were nonconsumers. As shown in Table1, overall seafood consumption during early pregnancy was generally related to maternal and child characteristics.
Intakes were higher among mothers who were older, had been born in Spain, had higher socioeconomic and educa-tional status, did not smoke during pregnancy, consumed alcohol during pregnancy, breastfed for longer periods, and had higher cord-blood mercury and LC-PUFA levels. For specific subtypes of seafood, consumers showed similar characteristics. The Spearman coefficients for correlations between intakes of different seafood subtypes were positive, albeit weak to moderate. Among them, the strongest correla-tion was between large fattyfish and leanfish (r= 0.29). Con-sumption of large fattyfish showed the strongest Spearman coefficients for correlation with cord-blood mercury levels (r= 0.34) and DHA levels (r= 0.20).
Associations of total seafood consumption with the main neuropsychological outcomes are shown in Figure 1. The strongest associations were observed in the outcome scores (MSCA and Childhood Asperger Syndrome Test) measured Table 2. Continued
Seafood Intakea No. of Subjects
Difference in Child’s Neurobehavioral Scoreb
Minimally Adjustedc Fully Adjustedd
β 95% CI β 95% CI
Lean Fish
Continuous variable, 10 g/week 1,892 0.03f
−0.00, 0.07 0.03f
−0.00, 0.07
Quintiles
1 387 0.00 Referent 0.00 Referent
2 386 0.93 −1.23, 3.10 0.44 −1.71, 2.58
3 380 2.35h 0.14, 4.56 2.07f
−0.12, 4.26
4 372 1.55 −0.66, 3.75 1.41 −0.78, 3.59
5 367 2.00f
−0.24, 4.24 1.77 −0.46, 3.99
Pfor trend 0.09 0.10
Shellfish
Continuous variable, 10 g/week 1,892 0.04 −0.07, 0.16 0.05 −0.06, 0.16
Quintiles
1 373 0.00 Referent 0.00 Referent
2 370 1.10 −1.13, 3.34 0.80 −1.41, 3.01
3 384 2.26h 0.07, 4.44 1.86f −0.30, 4.03
4 394 1.65 −0.53, 3.83 1.45 −0.70, 3.61
5 371 1.71 −0.55, 3.97 1.52 −0.72, 3.75
Pfor trend 0.18 0.21
Abbreviations: CI, confidence interval; INMA, Infancia y Medio Ambiente. a
Median intakes in specific quantiles (Q), in g/week: total seafood—Q1, 195; Q2, 338; Q3, 461; Q4, 600; Q5, 854;
large fatty fish—Q1, none; Q2, 48; Q3, 92; Q4, 238; small fatty fish—Q1, none; Q2, 37; Q3, 69; Q4, 147; lean fish—Q1,
90; Q2, 192; Q3, 286; Q4, 382; Q5, 557; shellfish—Q1, none; Q2, 27; Q3, 49; Q4, 76; Q5, 139.
b
Bayley Scales of Infant Development (15).
c
Results were adjusted for sex of the child, child’s age at testing, cohort, quality of the test, and maternal energy
intake (kcal/day) during pregnancy. d
Results were additionally adjusted for child’s birth weight, gestational age, duration of breastfeeding, maternal
age, educational level, social class, prepregnancy body mass index, parity, and country of origin/birth. e
Per 10-g/week increase. f
P< 0.10.
g
Results were similar when the reference group included all mothers with seafood consumption less than or equal to 340 g/week (Web Table 5).
h
P< 0.05.
at age 5 years. In Figure2, McCarthy subarea scales are pre-sented; positive associations were observed among all scales, with the largest coefficients generally being found in seafood quantile 4 (median, 600 g/week or about 4 servings/week).
Minimally and fully adjusted associations between mater-nal seafood subtype consumption and Bayley mental scale at 14 months of age are shown in Table2. Positive associations were observed for leanfish and small fattyfish, the latter with a trend (P for trend = 0.03). Associations with the Bayley psychomotor scale were somewhat weaker (Web Table 4). A positive trend in MSCA general cognitive score was found with large fattyfish intake (Pfor trend = 0.020), and a weak trend was found with leanfish (Pfor trend = 0.110) (Table3). Generally, when using categorical variables for seafood con-sumption in the regression models, quantiles 3 and 4 tended to have the largest coefficients and to show a slight decrease in the last quantile (Tables2and3).
As shown in Table4, maternal seafood consumption, in total and by subtype, was generally associated with a reduction
in the number of traits on the Childhood Asperger Syndrome Test. Leanfish intake showed an association with the outcome from quantile 2. A trend was observed for large fattyfish intake (Pfor trend = 0.013). In all models presented in Tables2–4, shellfish intake had the weakest associations.
Similar results were observed after excluding tinned tuna from the lean fish subtype and when treating tinned tuna as an independent variable (data not shown) and when the reference group for total seafood consumption included all mothers with intakes less than or equal to 340 g/week (Web Table 5). The association of large fattyfish consumption with MSCA general score was similar after adjustment for lean fish intake (quartile 4 vs. quartile 1:β= 2.00, 95% confidence interval: 0.07, 5.60;Pfor trend = 0.047). Associations were somewhat weaker when seafood consumption was assessed in the third trimester of pregnancy (Web Table 6). Association pat-terns were similar when the data were stratified by geograph-ical location (Cantabric Sea vs. Mediterranean Sea) (Web Table 7). Inclusion of the 93 preterm children or exclusion Table 3. Associations Between Maternal Seafood Consumption in the First Trimester of Pregnancy and Child’s
Score on the McCarthy General Cognitive Scale at Age 5 Years, Spanish Childhood and Environment (INMA) Project,
2004–2008
Seafood Intakea No. of Subjects
Difference in Child’s Neurobehavioral Scoreb
Minimally Adjustedc Fully Adjustedd
β 95% CI β 95% CI
All Seafood
Continuous variable, 10 g/weeke 1,589 0.03f 0.00, 0.05 0.02g 0.00, 0.05
Quintiles
1h 320 0.00 Referent 0.00 Referent
2 340 1.91g −0.23, 4.04 1.61 −0.43, 3.65
3 299 3.46f 1.24, 5.67 2.13f 0.00, 4.26
4 323 3.60f 1.41, 5.79 2.84f 0.74, 4.94
5 308 2.93f 0.72, 5.14 2.08g
−0.04, 4.21
Pfor trend 0.007 0.049
Large Fatty Fish
Continuous variable, 10 g/week 1,589 0.10f 0.02, 0.17 0.06g −0.00, 0.13
Quartiles
1 704 0.00 Referent 0.00 Referent
2 285 2.99f 1.05, 4.93 2.26f 0.40, 4.11
3 296 2.36f 0.43, 4.30 1.93f 0.09, 3.79
4 304 3.46f 1.51, 5.40 2.29f 0.42, 4.16
Pfor trend 0.001 0.02
Small Fatty Fish
Continuous variable, 10 g/week 1,589 −0.03 −0.11, 0.05 −0.03 −0.10, 0.05
Quartiles
1 736 0.00 Referent 0.00 Referent
2 280 1.41 −0.61, 3.44 0.60 −1.33, 2.53
3 288 0.94 −0.98, 2.87 1.25 −0.59, 3.10
4 285 1.27 −0.67, 3.21 0.91 −0.93, 2.76
Pfor trend 0.18 0.25
Table continues
of consumers of large fattyfish (n= 886) did not change the results (data not shown).
The associations with the MSCA scales (Table3) were atten-uated by 15%–30% after further adjustment for cord-blood mercury and LC-PUFA levels in separate models (Web Table 8). Separate models adjusting for organochlorines (polychlorinated biphenyls and 2,2-bis(p-chlorophenyl)-1,1-dichloroethylene (DDE)), iodine, and 25-hydroxyvitamin D3levels, estimated PUFA intakes, and use of supplements containing LC-PUFAs, folic acid, or iodine during pregnancy did not affect the results (data not shown).
Current child seafood consumption and MSCA general cogni-tive score showed similar but weaker patterns of association with maternal seafood consumption than those shown in Table3. After adjustment for maternal seafood consumption, the coeffi -cients from the models were reduced by 21% (Web Table 9). The associations with maternal seafood consumption were similar to those from previous models (Table3) after adjust-ment for the child’s seafood consumption (data not shown).
DISCUSSION
This study, conducted in a population characterized by high seafood consumption, found moderate positive associa-tions between seafood consumption during pregnancy and child neuropsychological development, particularly at 5 years of age. Intake of small fattyfish explained part of the positive associations at 14 months of age, and lean and large fattyfish appeared to be predictors of child neuropsychological func-tion at age 5 years. As a newfinding, a consistent reduction in autism-spectrum traits was also observed with total, lean, and large fattyfish consumption. These associations generally re-mained positive above the level recommended by the current US guidelines (totalfish consumption of 340 g/week during pregnancy) (5). Only part of these associations was reduced by adjustments for cord-blood mercury and LC-PUFA levels. Child seafood consumption showed similar results, with somewhat reduced associations after controlling for maternal consumption.
Table 3. Continued
Seafood Intakea No. of Subjects
Difference in Child’s Neurobehavioral Scoreb
Minimally Adjustedc Fully Adjustedd
β 95% CI β 95% CI
Lean Fish
Continuous variable, 10 g/week 1,589 0.04f 0.00, 0.08 0.03
−0.01, 0.06
Quintiles
1 328 0.00 Referent 0.00 Referent
2 325 2.65f 0.49, 4.80 1.76g −0.29, 3.81
3 322 2.79f 0.60, 4.99 2.01g
−0.08, 4.11
4 307 3.42f 1.20, 5.62 2.47f 0.36, 458
5 307 3.01f 0.78, 5.25 1.89g
−0.25, 4.03
Pfor trend 0.017 0.11
Shellfish
Continuous variable, 10 g/week 1,589 −0.03 −0.15, 0.09 −0.02 −0.13, 0.09
Quintiles
1 307 0.00 Referent 0.00 Referent
2 307 0.09 −2.16, 2.35 −0.12 −2.26, 2.02
3 331 1.16 −1.02, 3.35 0.81 −1.27, 2.90
4 332 1.10 −1.09, 3.28 0.79 −2.29, 2.88
5 312 −0.83 −3.10, 1.44 −0.94 −3.10, 1.22
Pfor trend 0.51 0.44
Abbreviations: CI, confidence interval; INMA, Infancia y Medio Ambiente. a
Median seafood intake in each quantile (g/week) is shown in the Table2footnotes.
b
McCarthy Scales of Children’s Abilities (16).
c
Regression models adjusted for sex of the child, age during testing, cohort, quality of the test, and maternal energy intake (kcal/day) during pregnancy.
d
Regression models additionally adjusted for child’s birth weight, gestational age, duration of breastfeeding,
maternal age, educational level, social class, prepregnancy body mass index, parity, and country of origin/birth. e
Per 10-g/week increase. f
P< 0.05.
g
P< 0.10.
h
Results were similar when the reference group included all mothers with seafood consumption less than or equal to 340 g/week (Web Table 5). Further inclusion of all seafood subtypes in the final model showed similar association patterns (data not shown).
Average seafood consumption in this population (498 g/week; about 3 servings per week or 71 g/day) was similar to levels reported in other Spanish studies (e.g., 72 g/day in the Basque Country) (19). These high consumption levels facilitated the analyses of associations for intakes substantially exceeding US recommended levels, as well as analyses of specific seafood subtypes, with the outcomes of interest. Thus, unlike previous studies, we were able to examine how maternal consumption of seafood subtypes specified in the US recommendations— most notably larger fatty fish species versus smaller fatty fish species—related to child neuropsychological develop-ment. The positive association observed for MSCA cognitive scores among women consuming moderate amounts of large fattyfish would suggest that some of the current guidelines may be slightly stringent (6). In fact, the presentfindings tend to support recent recommendations issued by the Euro-pean Food Safety Authority, which are less restrictive in lim-iting seafood consumption and which conclude that there are no adverse health associations apparent when exceeding the amount recommended, which is 1–4 servings offish per week
(150–600 g) (9). Furthermore, given that the associations observed using seafood consumption in pregnancy were stronger than those using seafood intake in childhood as the exposure, uterine life seems to be an important window for neurodevelopment—particularly during the early preg-nancy period, when there is intense activity in neuron for-mation, differentiation, and migration (4).
We identified some studies evaluating the association be-tween prenatal seafood intake and neuropsychological devel-opment (2). Most studies found positive associations with a wide range of outcomes, such as neurological development, motor development, verbal intelligence quotient, perception, social behavior, and (less) inattention and hyperactivity (2,8, 20,21). In just a few of them, there was attenuation of a pos-itive association in the highest seafood intake category (2,21). Ourfindings support the idea of a generally beneficial associ-ation with brain development and potentially a light attenua-tion at the highest levels of consumpattenua-tion. The surprisingly protective association with autism-spectrum traits has not been previously reported, although prosocial behavioral Table 4. Associations Between Maternal Seafood Consumption in the First Trimester of Pregnancy and Child’s
Score on the Childhood Asperger Syndrome Test at Age 5 Years, Spanish Childhood and Environment (INMA)
Project, 2004–2008
Seafood Intakea No. of Subjects
Difference in Child’s Neurobehavioral Scoreb
Minimally Adjustedc Fully Adjustedd
β 95% CI β 95% CI
All Seafood
Continuous variable, 10 g/weeke 1,393 −0.01f −0.01,−0.00 −0.01f −0.01,−0.00
Quintiles
1g 289 0.00 Referent 0.00 Referent
2 294 −0.47h −0.96, 0.03 −0.42h −0.90, 0.07
3 271 −0.69f −1.20,−0.18 −0.45h −0.95, 0.05
4 280 −0.75f −1.26,−0.24 −0.61f −1.12,−0.11
5 260 −0.72f −1.23,−0.20 −0.55f −1.06,−0.04
Pfor trend 0.006 0.037
Large Fatty Fish
Continuous variable, 10 g/week 1,393 −0.02f −0.04,−0.01 −0.02f −0.04,−0.00
Quartiles
1 613 0.00 Referent 0.00 Referent
2 237 −0.42h −0.88, 0.04 −0.32 −0.77, 0.13
3 269 −0.34 −0.79, 0.11 −0.28 −0.72, 0.16
4 274 −0.74f −1.19,−0.29 −0.57f −1.01,−0.13
Pfor trend 0.002 0.013
Small Fatty Fish
Continuous variable, 10 g/week 1,393 −0.00 −0.02, 0.02 −0.00 −0.02, 0.01
Quartiles
1 668 0.00 Referent 0.00 Referent
2 235 −0.36 −0.83, 0.12 −0.19 −0.66, 0.27
3 240 −0.15 −0.61, 0.30 −0.14 −0.59, 0.31
4 250 −0.45f −0.90, 0.00 −0.37 −0.81, 0.07
Pfor trend 0.056 0.11
Table continues
improvements were observed in a previous study (8) and chil-dren with autistic spectrum traits tend to show lower prosocial behaviors (22). One potential pathway could be through LC-PUFAs, particularly DHA intake from seafood (23). Sev-eral controlled trials and observational studies of LC-PUFAs have reported improvements in cognition, attention-deficit/ hyperactivity disorder, and antisocial symptoms (24). Our findings showing moderate attenuation after adjustment for LC-PUFA (including DHA) levels in umbilical cord blood are supportive of that hypothesis, given that other potential intermediate factors, such as vitamin D and iodine levels in pregnancy, did not explain any of the observed associations. While a few previous studies on seafood consumption dur-ing pregnancy and child neuropsychological development have examined seafood subtypes (2,5), none (to our knowl-edge) have separately examined associations with large versus small species of fattyfish. Somewhat inconsistently with our findings, Gale et al. (21) reported that while consumption of fattyfish of any kind less than once per week was associated
with small increases in intelligence quotient at age 9 years, no associations were observed at higher levels of intake.
Current guidelines for seafood consumption during preg-nancy have been developed largely on the basis of evidence linking mercury and other contaminants frequently found in marine foods with poorer neuropsychological development (1). Large fattyfish are of particular concern, as these long-lived, predatory species may accumulate high levels of both mercury and lipophilic contaminants such as organochlorines (25,26). In the few previous studies where such measurements were available, positive associations between seafood con-sumption and child neuropsychological development were strengthened or not influenced by adjustments for cord-blood mercury, polychlorinated biphenyls, and/or DDE (2,25). In this study, there was attenuation of the association estimate after adjustment for cord-blood mercury levels. In this regard, the precision of measurement of the independent variables (both the toxicant exposure and the beneficial dietary factors and other confounders) in our study was important. If a toxicant Table 4. Continued
Seafood Intakea No. of Subjects
Difference in Child’s Neurobehavioral Scoreb
Minimally Adjustedc Fully Adjustedd
β 95% CI β 95% CI
Lean Fish
Continuous variable, 10 g/week 1,393 −0.01f
−0.02,−0.00 −0.01h
−0.02, 0.00
Quintiles
1 298 0.00 Referent 0.00 Referent
2 291 −1.03f −1.52,−0.54 −0.89f −1.37,−0.41
3 282 −0.91f
−1.41,−0.40 −0.77f
−1.26,−0.28
4 261 −0.63f −1.14,−0.12 −0.48h −0.98, 0.02
5 261 −0.92f
−1.45,−0.41 −0.70f
−1.22,−0.19
Pfor trend 0.017 0.10
Shellfish
Continuous variable, 10 g/week 1,393 0.02 −0.01, 0.04 0.01 −0.01, 0.04
Quintiles
1 278 0.00 Referent 0.00 Referent
2 268 −0.12 −0.64, 0.40 −0.15 −0.66, 0.36
3 288 −0.61f −1.17,−0.11 −0.58f −1.08,−0.09
4 289 −0.12 −0.63, 0.38 −0.12 −0.61, 0.38
5 270 −0.07 −0.60, 0.45 −0.05 −0.57, 0.46
Pfor trend 0.97 0.92
Abbreviations: CI, confidence interval; INMA, Infancia y Medio Ambiente. a
Median seafood intake in each quantile (g/week) is shown in the Table2footnotes.
b
Childhood Asperger Syndrome Test (17).
c
Regression models adjusted for sex of the child, age during testing, cohort, quality of the test, and maternal energy intake (kcal/day) during pregnancy.
d
Regression models additionally adjusted for child’s birth weight, gestational age, duration of breastfeeding,
maternal age, educational level, social class, prepregnancy body mass index, parity, and country of origin/birth. e
Per 10-g/week increase. f
P< 0.05.
g
Results were similar when the reference group included all mothers with seafood consumption less than or equal to 340 g/week (Web Table 5).
h
P< 0.10.
is measured with greater precision than the dietary factor through an FFQ, the association for the latter will generally be biased toward the null (27). In the present study, cord-blood mercury was probably an indicator of seafood consumption.
The complexity of separating the positive and adverse as-sociations of seafood consumption and methylmercury (or mercury), respectively, with child neuropsychological devel-opment has been discussed elsewhere (28). Several factors may be masking any adverse association with methylmercury intake. For example, pregnant women with higher socioeco-nomic status tend to consume more seafood and be exposed to higher levels of methylmercury, but their children tend to perform better on cognitive tests (27). Additionally, variabil-ity in levels of both methylmercury and DHA are dependent on seafood subtype, with larger predators containing higher levels of methylmercury, but some, such as tuna, also con-taining higher concentrations of DHA (7). These factors and potential genetic vulnerabilities to methylmercury toxic-ity (27) make objective evaluation of the toxic risk of this ex-posure difficult, particularly since such exposure is closely linked to total seafood intake, which confers benefits for neu-ropsychological development.
A 2-point increase in a child’s cognitive score is not re-markable for an individual but is important for the popula-tion. If a specific population, particularly a community with poor seafood consumption, benefited from greater consump-tion of seafood, the Gaussian distribuconsump-tion of scores would likely shift to the right. As an end result, the chance offinding “borderline”children would be diminished. If these benefi -cial associations are permanent, they could be related to pos-itive social and economic changes (18,29). Although we experienced a moderate loss to follow-up of 40%, this allows some generalizability of ourfindings.
Although this study contained more information on sea-food subtypes than earlier studies, we observed moderate cor-relations between them, limiting the interpretation of fully independent associations by subtype. Moreover, while FFQs are valid tools for assessing dietary intakes, the use of self-reported data is a major limitation in thisfield of research, due to an increased level of statistical“noise”related to the subjectivity in recall of food habits and the potential infl u-ence of sociocultural background. Additionally, healthy nu-tritional habits that include more seafood consumption are also related to higher maternal intelligence quotient and edu-cational level and to less smoking during pregnancy (2); hence, we cannot rule out the possibility of some residual confounding. However, we carefully considered a wide range of potential confounders, including the ones mentioned above (Web Tables 1 and 2), and conducted sensitivity analyses to address this potential limitation. Negative confounding by mercury exposure was not found here, probably due to the lack of an observed negative association for mercury, as reported previously in this cohort (30). The difficulty of dis-entangling both associations demonstrates the statistical lim-itations of epidemiologic studies. Finally, we found moderate association trends in some of the seafood subtypes, but there was also a weak tendency toward saturation in the highest quantiles of exposure. Probably the pattern of association is not completely linear, with stronger positive associations in the moderately high seafood consumption categories.
Overall, the present results suggest no adverse associations of high seafood consumption in pregnancy with offspring neu-rodevelopment. Moderate consumption of small and large fattyfish and leanfish during pregnancy is associated with moderate improvements in child neuropsychological develop-ment, including cognitive functions and autism-spectrum traits. A slight dilution of the association at the highest intake levels may be indicative of a weak counterbalancing association due to the potential harm of related contaminants. The moderate mediation role of LC-PUFAs observed here suggests that they may have a mechanistic function. The role of mercury was difficult to discern, since it appeared to be a stronger bio-marker of seafood consumption rather than having any ex-pected neurotoxic association. Finally, the presentfindings should be taken with caution, and future research should focus on older children in order to further explore whether the association patterns observed here continue into later life, with particular attention being given to large fattyfish species.
ACKNOWLEDGMENTS
Author affiliations: ISGlobal, Centre for Research in Envi-ronmental Epidemiology (CREAL), Barcelona, Catalonia, Spain (Jordi Julvez, Silvia Fernandez-Barres, Monica Guxens, Claudia Avella-Garcia, Oliver Robinson, Mikel Esnaola, Jordi Sunyer); Institut Municipal d’Investigació Mèdica (IMIM)-Hospital del Mar, Barcelona, Catalonia, Spain (Jordi Julvez, Silvia Fernandez-Barres, Monica Guxens, Claudia Avella-Garcia, Oliver Robinson, Jordi Sunyer); Universitat Pompeu Fabra, Barcelona, Catalonia, Spain (Jordi Julvez, Monica Guxens, Claudia Avella-Garcia, Oliver Robinson, Jordi Sunyer); CIBER Epidemiologia y Salud Pública (CIBERESP), Barcelona, Catalonia, Spain (Jordi Julvez, Sabrina Llop, Jesus Ibarluzea, Claudia Avella-Garcia, Adonina Tardón, Oliver Robinson, Ferran Ballester, Jordi Sunyer); Department of Nutri-tion, Gillings School of Global Public Health, University of North Carolina at Chapel Hill, Chapel Hill, North Carolina (Michelle Méndez); Unitat de Nutrició i Salut Pública, Research Group in Nutrition and Mental Health (NUTRISAM), Universi-tat Rovira i Virgili, Reus, Catalonia, Spain (Silvia Fernandez-Barres, Victoria Arija); Department of Epidemiology and Biostatistics, School of Public Health, Imperial College London, London, United Kingdom (Dora Romaguera); Instituto de Investigacion Sanitaria de Palma, Hospital Universitario Son Espases, Palma de Mallorca, Mallorca, Spain (Dora Romaguera); CIBER Fisiopatología de la Obesidad y Nutrición (CIBEROBN), Santiago de Compostela, Galicia, Spain (Dora Romaguera); Departamento de Salud Publica, Campus San Juan, Universidad Miguel Hernandez, Alicante, Comunitat Valenciana, Spain (Jesus Vioque); FISABIO-UJI-University of Valencia Joint Research Unit, Valencia, Comunitat Valenci-ana, Spain (Sabrina Llop, Ferran Ballester); BIODONOSTIA, Instituto de Investigación Biosanitaria, San Sebastián, Basque Country, Spain (Jesus Ibarluzea); Subdirección Salud Publica Gipuzkoa, San Sebastián, Basque Country, Spain (Jesus Ibarluzea); Department of Preventive Medicine and Public Health,UniversityofOviedo,Oviedo,Asturias,Spain(Adonina Tardón); Hospital San Agustín, Avilés, Asturias, Spain (Isolina
Riaño); Facultad de Psicología, Universidad del País Vasco, San Sebastián, Basque Country, Spain (Ainara Andiarena); and Institut d’Investigació Sanitària Pere Virgili, Reus, Catalo-nia, Spain (Victoria Arija).
This study was funded by grants from the Spanish Institute of Health Carlos III (Ministry of Economy and Competitiveness) (Infancia y Medio Ambiente (INMA) Network grants G03/176 and CB06/02/0041 and Fondo de Investigación Sanitaria (FIS) grants FIS-PI041436, FIS-PI081151, FIS-PI042018, FIS-PI09/ 02311, FIS-PI06/0867, FIS-PS09/00090, FIS-PI03/1615, FIS-PI04/1509, FIS-PI04/1112, FIS-PI04/1931, FIS-PI05/ 1079, PI05/1052, PI06/1213, PI07/0314, FIS-PI09/02647, FIS-13/02429, FIS-PI13/1944, FIS-PI13/2032, and CP14/00108); the Fondo de Investigación Sanitaria-Fondo Europeo de Desarrollo Regional; the Generalitat de Catalunya-Consejo Interdepartamental de Investigación e Innovación Tec-nológica (grant 1999SGR 00241); Juan de la Cierva (grant 2011-09771-MICINN); the Conselleria de Sanitat Generalitat Valenciana 1 (grants 048/2010 and 060/2010); the Universidad de Oviedo, Obra Social Cajastur, Department of Health of the Basque Government (grants 2005111093 and 2009111069); the Provincial Government of Gipuzkoa (grants DFG06/004 and DFG08/001); and the Fundación Roger Torné. Miguel Ser-vet fellowships (MS13/00054 and MS14/00108) were awarded to M.G. and J.J. by the Spanish Institute of Health Carlos III.
We thank the study interviewers for their assistance in con-tacting the families and administering the questionnaires.
The funding sources played no role in the design and conduct of the study, including the collection, management, analysis, and interpretation of the data and the preparation, review, and approval of the manuscript.
Conflict of interest: none declared.
REFERENCES
1. Oken E, Bellinger DC. Fish consumption, methylmercury and child neurodevelopment.Curr Opin Pediatr. 2008;20(2): 178–183.
2. Avella-Garcia CB, Julvez J. Seafood intake and
neurodevelopment: a systematic review.Curr Environ Health Rep. 2014;1(1):46–77.
3. Innis SM. Dietary omega 3 fatty acids and the developing brain. Brain Res. 2008;1237:35–43.
4. Gluckman PD, Hanson MA, Cooper C, et al. Effect of in utero and early life conditions on adult health and disease.N Engl J Med. 2008;359(1):61–73.
5. Institute of Medicine.Seafood Choices: Balancing Benefits and Risks. Washington, DC: National Academies Press; 2006.http:// www.iom.edu/Reports/2006/Seafood-Choices-Balancing-Benefi ts-and-Risks.aspx. Accessed July 9, 2015.
6. Food and Drug Administration, US Department of Health and Human Services. Fish: what pregnant women and parents should know. Washington, DC: US Department of Health and Human Services; 2014.http://www.fda.gov/Food/
FoodborneIllnessContaminants/Metals/ucm393070.htm. Accessed July 9, 2015.
7. Mahaffey KR. Fish and shellfish as dietary sources of methylmercury and the omega-3 fatty acids, eicosahexaenoic acid and docosahexaenoic acid: risks and benefits.Environ Res. 2004;95(3):414–428.
8. Hibbeln JR, Davis JM, Steer C, et al. Maternal seafood consumption in pregnancy and neurodevelopmental outcomes in childhood (ALSPAC study): an observational cohort study. Lancet. 2007;369(9561):578–585.
9. European Food Safety Authority Scientific Committee. Statement on the benefits offish/seafood consumption compared to the risks of methylmercury infish/seafood. EFSA J. 2015;13:3982.
10. Guxens M, Ballester F, Espada M, et al. Cohort profile: the INMA—INfancia y Medio Ambiente—(Environment and Childhood) Project.Int J Epidemiol. 2012;41(4):930–940. 11. Lucas A, Morley R, Cole TJ, et al. Early diet in preterm babies
and developmental status in infancy.Arch Dis Child. 1989; 64(11):1570–1578.
12. Willett WC, Sampson L, Stampfer MJ, et al. Reproducibility and validity of a semiquantitative food frequency questionnaire. Am J Epidemiol. 1985;122(1):51–65.
13. Vioque J, Navarrete-Muñoz E-M, Gimenez-Monzó D, et al. Reproducibility and validity of a food frequency questionnaire among pregnant women in a Mediterranean area.Nutr J. 2013; 12:26.
14. Willett WC, Howe GR, Kushi LH. Adjustment for total energy intake in epidemiologic studies.Am J Clin Nutr. 1997; 65(4 suppl):1220S–1228S.
15. Bayley N.Escalas Bayley de Desarrollo Infantil. Madrid, Spain: TEA Ediciones; 1977.
16. McCarthy D.Manual for the McCarthy Scales of Children’s Abilities. New York, NY: Psychological Corporation; 1972. (Spanish adaptation: TEA Ediciones, Madrid, Spain, 1996). 17. Scott FJ, Baron-Cohen S, Bolton P, et al. The CAST (Childhood
Asperger Syndrome Test): preliminary development of a UK screen for mainstream primary-school-age children.Autism. 2002;6(1):9–31.
18. Julvez J, Alvarez-Pedrerol M, Rebagliato M, et al. Thyroxine levels during pregnancy in healthy women and early child neurodevelopment.Epidemiology. 2013;24(1):150–157. 19. Welch AA, Lund E, Amiano P, et al. Variability infish
consumption in 10 European countries.IARC Sci Publ. 2002; 156:221–222.
20. Davidson PW, Cory-Slechta DA, Thurston SW, et al. Fish consumption and prenatal methylmercury exposure: cognitive and behavioral outcomes in the main cohort at 17 years from the Seychelles Child Development Study.Neurotoxicology. 2011; 32(6):711–717.
21. Gale CR, Robinson SM, Godfrey KM, et al. Oilyfish intake during pregnancy—association with lower hyperactivity but not with higher full-scale IQ in offspring.J Child Psychol Psychiatry. 2008;49(10):1061–1068.
22. Otero TL, Schatz RB, Merrill AC, et al. Social skills training for youth with autism spectrum disorders: a follow-up.Child Adolesc Psychiatr Clin N Am. 2015;24(1):99–115. 23. Strain JJ, Yeates AJ, van Wijngaarden E, et al. Prenatal
exposure to methyl mercury fromfish consumption and polyunsaturated fatty acids: associations with child development at 20 mo of age in an observational study in the Republic of Seychelles.Am J Clin Nutr. 2015;101(3): 530–537.
24. Janssen CI, Kiliaan AJ. Long-chain polyunsaturated fatty acids (LCPUFA) from genesis to senescence: the influence of LCPUFA on neural development, aging, and
neurodegeneration.Prog Lipid Res. 2014;53:1–17. 25. Oken E, Radesky JS, Wright RO, et al. Maternalfish intake
during pregnancy, blood mercury levels, and child cognition at age 3 years in a US cohort.Am J Epidemiol. 2008;167(10): 1171–1181.
26. Ibarluzea J, Alvarez-Pedrerol M, Guxens M, et al. Sociodemographic, reproductive and dietary predictors of organochlorine compounds levels in pregnant women in Spain. Chemosphere. 2011;82(1):114–120.
27. Julvez J, Smith GD, Golding J, et al. Prenatal methylmercury exposure and genetic predisposition to cognitive deficit at age 8 years.Epidemiology. 2013;24(5):643–650.
28. Grandjean P, Herz KT. Methylmercury and brain development: imprecision and underestimation of
developmental neurotoxicity in humans.Mt Sinai J Med. 2011;78(1):107–118.
29. Bellinger DC. Comparing the population neurodevelopmental burdens associated with children’s exposures to environmental chemicals and other risk factors.Neurotoxicology. 2012;33(4): 641–643.
30. Llop S, Guxens M, Murcia M, et al. Prenatal exposure to mercury and infant neurodevelopment in a multicenter cohort in Spain: study of potential modifiers.Am J Epidemiol. 2012;175(5):451–465.