Incorporating Routing Analysis into IP Network Management
AUTHOR:Lance Tatman Agilent Laboratories 3500 Deer Creek Road P.O. Box 10350, MS 24M-A
Palo Alto, CA 94304 [email protected]
May 2003
Introduction
How often are network operators looking at green icons when the telephone rings? How many times don’t customers call to complain? What are we missing in our attempts to detect problems in IP networks? Just detect, not isolate, not repair, just “know” about problems in the network at a given time. Routing protocols routinely route around failed interfaces and links. Redundant services routinely take over after failure of primary systems. Network management software continually monitors our networks and alerts us not only to failures, but also of poorly performing services or links. With all of this in place…how often are network operators looking at green icons when the telephone rings? What might be done to improve network management systems so that operators can find the root cause of more problems, so that top engineers aren’t continually devoting their time to troubleshooting the “hard” problems instead of planning for the next network expansion or network service?
This paper proposes that routing data contains information that can be used to identify currently undetected problems, not just run-of-the-mill problems, but the “hard” problems, problems that are possibly temporary. With the data required to solve the problems being invisible or difficult to obtain, routing data correlated with network element data and service management data can provide a more comprehensive view of network health and the magnitude of problems on the network, on services and on customers.
Some potential uses of combined routing data analysis and network management data include identification of router mis-configuration and inconsistent routing policies, two of the most frequent causes of routing failures[LA98]. Other problems that may be
addressed are loss of reachability from an outside network, oscillations in paths and/or performance, and routing loops. In addition, this information would also allow a provider to quickly classify routing problems as internal or external and provide an indication of the culprit autonomous system (AS).
After providing background on current methods of network management, this paper will examine what routing data should be analyzed to identify one or more of the items mentioned above. The paper assumes the perspective of a tier one or tier two ISP.
Current Methods of Network Management Network Element Management
In 1983, in a single evening, Mike Muuss wrote the now famous ping utility while at the U.S. Army Ballistics Research Laboratory. Ping became widely used for several
purposes in network management. It was used to measure latency, determine the up or down state of an interface, and for network interface discovery. Indeed, the grandfather of modern IP network element management is simply timed pings used to monitor interface availability. This type of monitoring and discovery is still widely used today.
The next step in the evolution of IP network management was the introduction of the simple gateway management protocol (SGMP) by Jeff Case, Mark Fedor, Martin
Schoffstall, and James Davin in August of 1987. SGMP was designed to manage routers, but eventually was used as the basis for the development of simple network management protocol (SNMP), which was developed in 1988. This was a major improvement in the ability to manage network devices. SNMP provided a common protocol, which allowed operators to query devices for specific information. This might include interface state, memory usage, central processing unit (CPU) usage, bits in and out of an interface, and
more. This protocol also enabled devices to send messages (traps) on certain conditions. SNMP has undergone improvements since 1988 and is still widely used as a network management tool.
The above tools are used for network device and element management. Interface-by-interface, slot-by-slot, chassis-by-chassis, the purpose of monitoring network elements is to verify that all of the hardware is working as it should. With state-of-the-art network element monitoring today, the network management software has usually been set up to be aware of the interdependencies of the network equipment, so that if a router with 30 interfaces loses power, only a single alarm is generated rather than 30. Key performance indicators are charted and displayed for the network operations staff. These may include data such as number of dropped packets on an interface or octets/sec through an interface, router CPU load, and interface uptime. Using these techniques, today’s network element management provides network operators with a good indication of the health of the network hardware.
Service Management
As the Internet matured and grew, more complex networks developed and it became apparent that monitoring individual links wasn’t sufficient. Many networks had redundant paths or links, and routing protocols successfully routed around individual network element failures. An interface going down didn’t necessarily mean the loss of services or revenue. Companies were now offering more than just network connectivity; they were offering mail services, Web-hosting services, electronic sales, and more. Networks were robustly designed to handle the failure of a single path. The revenue now came from services as well as connectivity, hence, the development of service
management.
Service management is concerned with managing the services being used across the network. Today, both active and passive monitoring is used. One approach used in active monitoring uses a central server to send out messages to service ports and monitors responses. If an inappropriate response is received, or a threshold crossed, an event in the
network service monitoring system is generated. At best, this technique monitors whether or not a service is up as viewed from a single point and does little to help one to understand the performance of the service. A better method, adopted by several
operations support system (OSS) providers and even some GNU public license network management developers, is to use active measurement agents, typically software
packages installed on remote systems deployed across the network. These agents regularly send the appropriate type of packets across the network to the appropriate server to measure network service performance and availability. The tests break down a service into basic elements. For instance, a test monitoring Web service may monitor domain name system (DNS) lookup time, transport control protocol (TCP) connect time, server response time, etc. Breaking the service down helps the operator to pinpoint problems more quickly.
Using software agents provides the operator with information on the service performance from the vantage point of each individual agent. Agents are placed at strategic points in the network, and may even be placed outside of the service provider’s own network, inside a customer’s network for example, to provide a view from the customer vantage point. Additionally, passive tests may also be taken from agents, collecting information such as service transaction rates, disc space used, and so on. Passive tests are integral to network service monitoring.
The most-advanced network management software today can correlate network element events with service failure. It will notify the Network Operations Center (NOC) of which network element failed and provide a list of services and customers that have been
affected. This is state-of-the-art in terms of network management today. While there are products that have routing analysis and some routing management capabilities, none have taken the next step to integrate and correlate this information with element and service management data.
Monitoring one’s network from the inside provides us with a very important, but small part of the required picture. Increasingly, trouble-calls may come from customers outside of one’s own network, from people trying to access services from outside of the network hosting the services, or from adjacent service providers trying to track down problems for their customers. The Internet is a loose federation of cooperatively competitive large networks, where all of the information needed for analysis is not always available to the engineer. The engineer may face a very complex chain of symptoms and causes that are not easily separable from one another. Data may flow through several intermediate networks before reaching the provider’s network, and each of those intermediate networks will affect the end user’s experience. Given each network is independently operated, and one has access only to their own network equipment for measurement data, how does one track down problems that are occurring outside of their own network?
One approach has been to deploy hundreds or even thousands of servers at points across the Internet. A network operator could then request that their network be probed from these external servers so that availability may be tracked on a wider scale and not just from within. While this approach does provide useful information, it has the drawback of being inefficient, expensive to implement and maintain, and still provides a very limited picture of global access to one’s network and services.
A Different Approach
Network element and service monitoring have worked well enough to this point, but they miss a large class of problems. Monitoring network elements and services alone won’t reliably identify problems due to routing anomalies. Current methods may indeed catch some interior and exterior routing problems depending on the density of deployed agents and the placement of servers being monitored. After all, it comes down to connectivity. One can either reach point A and the services offered or one cannot. If it’s a routing problem or a bad card or a server down, the result may be the same; however, narrowing the problem down to the root cause allows it to be repaired more quickly.
Experience using current OSSs has shown that it is often the case that the customer is the instrument used to find network problems not found by the OSS system. By answering the question of how these problems, found only by customers, are solved, we may be able to develop methods to find these problems before the customer.
What approach is used today to solve these problems? For instance, what is done when engineers are on the phone with a customer whose web site cannot be reached. First, the engineers must be confident that their own network is not at fault. Currently, they rely on their network element management and service management systems for a first sign. This is where the green light syndrome comes in. If the engineers see all green from their OSS, the problem may very well be with routing. The engineers must determine if their own network is behaving properly with respect to routing. Here, they generally turn to custom scripts that were written in-house. Using a combination of real-time
configuration checking, manually logging into routers, and examining results from the in-house scripts, the engineers will verify the proper routing behavior of their own network.
After they verify proper operation of their own networks, in order to locate the root cause of a problem, they must often look at their network from an outside perspective. When troubleshooting suspected routing problems, a technique used by many network
engineers, focuses on network availability verification and uses publicly accessible “looking glasses”1. A looking glass is a publicly available system set up by the operator
of a network, which allows others to look at routing data from the perspective of that network. One can visit the looking glass Web site for a particular network whose perspective they are interested in, such as the one used by the customer making the complaint and see if their network is visible from the perspective of that network. If it is, the operator can see what other networks are between the two end networks and begin to view the network from these intermediate perspectives. In this way, the operator narrows down the networks that may be at fault. Generally, looking glasses also provide a remote traceroute tool, which allows the operator to view network path information at a more detailed level than the autonomous system level provided by the routing tables.
Another set of tools engineers use to gain perspective from outside networks are routing table collection points. These are routers set up specifically to collect routing information advertised by service providers. These routers make collective routing information publicly available via the Web. Systems, such as Oregon Route Views2 and the Reseaux IP Europeans (RIPE), Routing Information Service3, ask providers to peer with the route collection system as a public service. There are now several of these systems in place and many network operators begin by looking to these systems to identify problems with external routing perspectives.
Using the combined knowledge obtained from examining their own network routing tables, knowledge of their own routing policy, and the information obtained from various remote looking glasses or routing table collection points, network operators are able to track down the root cause of problems occurring outside of their own network to the level of the responsible autonomous system. Fixing the problem then becomes an issue of finding the right person at that company, someone with the ability to understand and fix the problem. Once this person is located, they then must be convinced that this is a problem that needs to be fixed. This is difficult enough when one has a direct
relationship with the operator at fault, but becomes much more difficult when dealing with an intermediate network operator with whom neither the provider nor customer has a relationship.
One can see how this process can become quite time consuming and how it requires extensive knowledge not only of one’s own network and routing policies, but also knowledge of relationships with other providers and their networks and policies. Given any changes in the routing configuration can potentially have catastrophic affects on the operators network and customer networks, only the most senior engineers are allowed to tread in this swamp4.
2 http://antc.uoregon.edu/route-views/ Oregon Route Views Web Site 3 http://www.ripe.net/ris/ RIPE RIS Web Site
Three Views of Routing Data -Inside Out-
However it is obtained, it is important that network engineers collect and analyze data that is accessible only from their own network. Operators have the ability to collect more information about their own network than any other. There are some simple
measurements that may be taken from the provider’s own network for troubleshooting routing problems. Some of these are listed here.
1. Average Number of Prefixes Advertised/Peer
Networks with whom an ISP peers will have varying numbers of prefixes that they advertise. Indeed, some may advertise a single network (the ISP’s customer) and others may advertise over 100,000 routes (the ISP’s transit provider). However, the number of routes each peer advertises typically remains within a relatively constant range.
Currently, some ISPs set a maximum number of routes they will accept from a peer in order to minimize their exposure to leaking routes, however, this is used with very course granularity and was not intended as a monitoring tool. Monitoring the number of prefixes advertised by each peer is a simple way to check for potential problems. Once the
prefixes have been monitored for a sufficient time to determine baseline values, thresholds may be set accordingly. In practice, if a peer that was normally advertising 400-600 routes suddenly starts advertising only 100 routes or 50,000 routes, it can be taken as a sign that all is not well.
2. Peering Session State
Another simple measure is to monitor the state of peering sessions. Peering sessions are TCP connections on port 179. There are several ways of conducting monitoring: via a separate agent with a duplicate peering session with each peer, via command line and via SNMP. If a peering session’s state is listed as ‘active’ then no routes are available from that peer and it may warrant further investigation. Uptime for the peering session can provide similar information. If the peering session is down, the peer is no longer providing or receiving routes. Effectively, that connection is down.
3. Number of Updates Received/Peer/Time
A quickly increasing number of border gateway protocol (BGP) update messages received from a peer can be an indication of problems with stability of the peer or the peer’s downstream peers. This is something that is typically examined during live troubleshooting sessions. An engineer will look at these numbers and note instability from a specific peer to determine if a particular peer is contributing significantly to instability and to historically identify unstable peers.
4. Router Resources
Routing input and output queues may be monitored along with router CPU load and memory usage to track router resource utilization. This is just common sense. Router resources are limited and, when stretched too far, the router fails.
5. Access Control List (ACL) Hit Monitor
Access control lists are used to filter routes into the network. They may be monitored for hits, a hit meaning the peer has advertised routes that must be filtered. If the number of hits exceeds a threshold, warnings may be issued. This may be used simply to save resources on your router or it may be used to detect attacks. If a certain ACL is
continually hit, resources are being wasted. It will be worth the operator’s time to track down the cause and inform the offending peer of the problem. There is an entire list of prefixes called bogons that most all ISPs filter. If a peer is continually advertising one of these prefixes, they should be informed, as it indicates a mis-configured router and is a waste of resources.
6. Routing Registry vs. Observed Policy Monitor
A Routing Registry may be scanned periodically both for one’s own routing policy as well as for that of peers. The registered policy may be compared against observed policy to identify cases where configuration is not matched to policy. Since most ISPs take the attitude that peering policy is confidential information they refuse to register their policy in public registries (but may maintain it in a private registry), thereby limiting the scope
of this method of monitoring. However, there are providers that require customers to maintain accurate registry entries and this policy would make this method useful for monitoring compliance.
7. Router Configuration Change Monitor
The most common causes of router mis-configuration are typing errors, a
misunderstanding of the commands or a misunderstanding of the company’s routing policy. Configuration changes occur frequently to turn up or remove customer services. Router configuration may be logged and the running configuration checked periodically and compared against the saved configuration so that a configuration change will trigger an alarm. NetDB [FR00] developed by AT&T labs does just this. A quote from the AT&T labs web page:
“Use of the NetDB toolkit led to a huge, sustained drop in CBB (Common Back Bone) network configuration errors. The CBB operational systems NMTS and CTT are now routinely monitored for configuration errors using NetDB. The use of RouteDB, a new tool for querying network BGP (Border Gateway Protocol) data, resulted in tightening and improving CBB routing policies. BGP protocol research produced the first set of guidelines for stable, efficient BGP routing” [Ah01]
NetDB does more than simply check consistency of the router configuration against a saved copy. It extracts information from the router configuration files and compares it against its internal data model, performing consistency checks and policy checks against its internal database.
8. Traffic Profiling
While more of a planning tool than a network-monitoring tool, an ISP’s customer or peer traffic may be profiled in order to determine better peering arrangements. Profiling in this context is to chart top volume prefix AS paths, both selected paths and offered paths. This can be done with NetFlow-type statistics turned on and scripts to process the data. By examining not just the selected AS path, but all of the AS paths offered for the top volume prefixes, one may see that the ISP may be better served by a different transit provider or that the ISP should approach a certain service provider to negotiate a peering
agreement. The ISP pays for transit, but generally doesn’t pay for peering. If a profile of traffic shows a majority going to an AS that must be reached via the transit provider, the provider may want to try to establish peering with the destination AS to avoid transit costs.
Some less simple, but perhaps more relevant routing information which can be obtained from inside one’s own network includes an analysis of each BGP update message from each peer. This is the subject of ongoing research, but it can be imagined that one may be able to isolate undesirable interactions amongst peers, such as conflicting route flap damping policies or route oscillations. Particular vendor BGP implementation issues [La99] can also become apparent and problems introduced by routing operating system updates can be isolated more quickly. Another primary use of individual update analysis might be to isolate and identify denial of service attacks directed at BGP.
Stepping away from BGP for a moment, but remaining inside one’s own network, it has already been shown that by using the flooding characteristics of interior gateway
protocols (IGPs), such as intermediate system-to-intermediate system (IS-IS) or open shortest path first (OSPF), network operators can generate maps of topology that are instantly updated5. A more detailed analysis of the IGP routing data could also provide a more efficient means of monitoring one’s network than traditional methods.
Using the measurements listed above, combined with information provided by the network element and service management systems, operators can quickly verify proper operation of their own network … always the first step in troubleshooting.
The Three Views of Routing Data -Outside In-
If the customer is the most used tool for finding routing problems, the index finger is the most used tool for fixing them – verify a problem isn’t with one’s own network and then
vaguely blame it on another carrier down the line. This is how things are currently
handled and these are two primary problems we need to solve: finding the problem before the customer and being able to quickly identify the culprit and prove culpability. In order to address these problems, we need to view the world from various outside perspectives and we need to do this at several layers of granularity. First, we should look at the Internet as a whole and view BGP behavior in aggregate. This means viewing the routing behavior of a large numbers of ISPs at multiple locations. The SQL Slammer worm affected networks globally6. Most public networks were affected nearly simultaneously. When there is a clear understanding that a problem is not local, but global,
troubleshooting becomes a much different process. The fog of war is cleared to a great degree and one can quickly eliminate many potential causes and begin to look elsewhere or to look to other operators for immediate assessment of successful filter
implementations instead of wasting hours trying to figure out why your network is broken7. In fact, in the future, the global perspective may even be of potential use to find the originator of global routing problems.
Next, one needs to view their own network from the perspective of each of their peers and transit providers. This will quickly isolate problems with mis-configuration or localized failures. By paying attention only to one’s peers at this level, the scope is limited to those that have the most direct influence on your network and over whom you have the most influence. These are the networks that immediately propagate one’s network advertisements out to the world and those that provide one’s network with their own view of the world. One always views the world through their peer’s glasses, so it is a good idea to keep an eye on them.
Another level of detail required is to view the network from the customer’s view. It is through their provider’s network that customers view the world. By tracking the routes they are announcing and that they are being given, isolating problems can become much easier. For instance, if a customer calls their provider to complain about poor network
6 http://www.caida.org/analysis/security/sapphire/ for a nice account of SQL Slammer
7 Operators currently use mailing lists like NANOG and an network operations IP phone network set up by Packet Clearing House for quick information on global routing problems
performance or lack of connectivity and the provider has insight into the behavior of that customer’s routing announcements, and can spot changes in the customer’s routing behavior, the provider will be able to help the customer solve the problem rather than getting into a blame game with one’s own customers. Or, if indeed it is the provider’s fault, it is possible they can find the problem before the customer. This would be
particularly useful if a configuration change on the part of a provider impacts a customer. By maintaining a view of the world from the customer’s prospective, the provider can bring to bear expertise, which may be unavailable to the customer, to quickly identify problems with customer router configuration, such as conflicting routing policy or
leaking routes. Enabling the provider to quickly identify a problem as internal, customer, or external is a key benefit of including routing data in the network management scheme.
The Three Views of Routing Data -Microview-
The finest granularity and final perspective is the relative performance of individual routers with unique configurations under various control traffic and data traffic loads. An operator should be aware of the limits of their equipment and should be able to track key indicators of performance for each router in their network. For instance, an operator may find it useful to know that adding another peer will increase the load on their router by X percent and their router’s performance falls off significantly if load exceeds Y percent. It may be useful to know that the increased instability caused by peer A is causing an increase in jitter for customer B. Giving network operators quantified measurements regarding the affects of new configurations or operating system versions on performance of a router would be especially useful. While these measurements fall outside the scope of routing management, given routing is the primary function, it seems appropriate. Do fluctuations in network performance at the far end of a connection show up in TCP behavior to one’s customer? Can that behavior be monitored and used to predict network instability? These are topics of current and ongoing research, but are critical to enabling providers to guarantee reliable quality of service.
Preliminary Work
Agilent Labs has done preliminary work in several areas of routing management. Each area outlined above is being examined. First, Agilent Labs’ analyzed Internet-wide measurements made available by RIPE’s RIS project. We analyzed six months of routing updates and verified previous assumptions and observations. For instance, the fact that approximately 20 percent of BGP announcements are duplicates was observed by Craig Labovitz in 1998[La99]. Several years later, we observed the same behavior. We were able to get an idea of what “stable” means in terms of large service providers’ routing updates. More importantly, we are beginning to understand what unstable means. We now process every BGP update message sent by each participating peer at several RIPE RIS exchange points. We put the data into graphs and make them available for public use. Figures 1 and 2 show an example of this data during the SQL Slammer worm attack. Notice the Y axis on the first graph (a normal period), is an order of magnitude smaller than for the Y axis scale during the attack, shown in the second graph. These graphs, if available to operators, would have been a clear indication to engineers, that this was not a local problem.
Figure 1 Figure 2
Agilent Labs has also implemented many of the measurements mentioned in the Inside-Out section of this paper into Agilent’s QoS Manager (Firehunter) product.
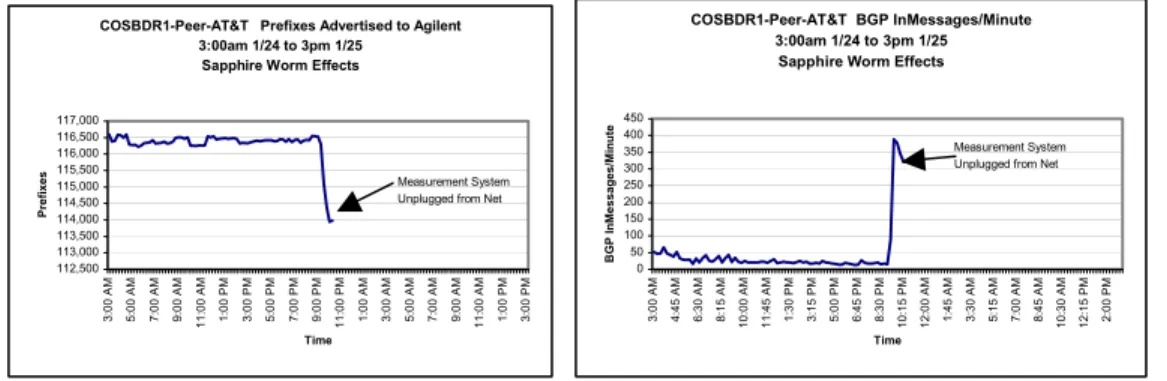
Measurements of Agilent’s own border routers during the SQL Slammer worm contribute to the argument for taking multiple views of the network. Figure 3 and 4 show the affects of this worm on Agilent’s border routers.
COSBDR1-Peer-AT&T Prefixes Advertised to Agilent 3:00am 1/24 to 3pm 1/25 Sapphire Worm Effects
112,500 113,000 113,500 114,000 114,500 115,000 115,500 116,000 116,500 117,000 3: 00 AM 5: 00 AM 7: 00 AM 9: 00 AM 11: 0 0 AM 1: 00 PM 3: 00 PM 5: 00 PM 7: 00 PM 9: 00 PM 11: 0 0 PM 1: 00 AM 3: 00 AM 5: 00 AM 7: 00 AM 9: 00 AM 11: 0 0 AM 1: 00 PM 3: 00 PM Time Prefi
xes Measurement System
Unplugged from Net
COSBDR1-Peer-AT&T BGP InMessages/Minute 3:00am 1/24 to 3pm 1/25
Sapphire Worm Effects
0 50 100 150 200 250 300 350 400 450 3: 00 AM 4: 45 AM 6: 30 AM 8: 15 AM 10: 00 AM 11: 45 AM 1: 30 PM 3: 15 PM 5: 00 PM 6: 45 PM 8: 30 PM 10: 15 PM 12: 00 AM 1: 45 AM 3: 30 AM 5: 15 AM 7: 00 AM 8: 45 AM 10: 30 AM 12: 15 PM 2: 00 PM Time BG P I n Messag es/ Mi n u te Measurement System Unplugged from Net
Figure 3 Figure 4
An engineer looking first at their own edge routers and seeing the graphs in figures 3 and 4 and then looking at the global perspective, and seeing the spikes shown in figure 2 would immediately know that there was a global problem with routing and that the affects being seen on their network were being seen across the globe. They could then troubleshoot from a much different, and more informed perspective. Moreover, using this information in combination with network element and service management
information would have likely shown increased data traffic on particular links, primarily those with infected systems. The provider would be able to see that the routing problems inside their own network were being caused by possibly overloaded links and not an attack on a router. They could then focus on correlating changes being viewed in
network service and network element behavior with the times of the routing anomalies to help identify the type of traffic that was overloading the links and could then put in place filters or shut down the systems generating the traffic. This approach would have been much more efficient than the troubleshooting techniques used when little or no
Looking at one’s own network from specific user-selected perspectives, automatically, is also being explored. The approach here, as a prototype, is to enable the user to select specific prefixes to be monitored along with perspectives desired, for instance, only from Europe, or Asia, or from AS 1, 2 and 3. The prefixes will be monitored automatically from various public looking glasses with the results compiled in a database. Using this tool, a provider could verify the proper advertisement of a new customer or quickly and automatically check the availability of a prefix during troubleshooting.
Agilent Labs has also created a testbed to begin to analyze the affects of routing control traffic on router performance and to begin to look at prediction of instability in routes based on TCP behavior. This is ongoing work and is being conducted in cooperation with the Technical University of Munich, the University of Massachusetts, and the Cooperative Association of Internet Data Analysis (CAIDA).
Conclusion
Service management and network element management can provide much of the required information to successfully operate a network, however, they are only two legs of the OSS stool. Missing is routing analysis. Much can be learned by analysis of routing behavior. Using multiple perspectives and combining the information learned from routing analysis with that from network element and service management, it will be much less likely that network operators are looking at green icons when the phone rings.
References
[LA98] C. Labovitz, A. Ahjua, “Experimental Study of Internet Stability and Wide-Area Backbone Failures”, SIGCOMM 2000, http://sigcomm.it.uu.se/conf/paper/sigcomm2000-5-2.ps.gz
[FR00] A. Feldman, J. Rexford, “IP Network Configuration for Traffic Engineering”,
http://citeseer.nj.nec.com/feldmann00ip.html
[Ah01] H. Ahmadi, “IP Network Management, Traffic Measurement and Performance Capabilities”, A Labs-Research News, 9/2001
http://www.research.att.com/news/2001/September/NetworkManagement.html
[La99] C. Labovitz, “Scalability of the Internet Backbone Routing Infrastructure”, Ph.D. thesis, Univer of Michigan, 1999,