ISSN: 2501 - 1235 ISSN-L: 2501 - 1235 Available on-line at: www.oapub.org/edu
doi: 10.5281/zenodo.3864522 Volume 6 │ Issue 4 │ 2020
EFFICACY OF PHYSICAL ACTIVITY COUNSELLING
INTERVENTIONS DELIVERED IN PRIMARY CARE:
A SYSTEMATIC REVIEW AND META-ANALYSIS
Micky Olutende Oloo1i,
Edwin Kadima Wamukoya1,
Maximilla Wanzala2
1Department of Health Promotion and Sports Science, Masinde Muliro University of Science and Technology, Kenya 2Department of Public Health, Masinde Muliro University of Science and Technology, Kenya
Abstract:
Background: Overwhelming success has been achieved in disease control through environmental interventions such as vaccinations and improved hygiene to increase life expectancy, many authorities in the field of preventative healthcare are of the opinion that too little has been done to target behavioral factors, particularly physical inactivity. Research suggests that the impact PA counselling in primary care could have at a population level is tremendous. However, gaps still exist between the science and the
practice when it comes to prescribing exercise in the healthcare context. Objectives: To
compare the effectiveness of health provider delivered interventions for physical activity (PA) promotion verses placebos or no or minimal intervention among community
dwelling adults Search methods: We searched Cochrane Central Register of Controlled
Trials in the Cochrane Library, Ovid MEDLINE(R), Embase Ovid, Web of Science, CINAHL (EBSCOhost) and SPORTDiscus (earlier dates to 10 January, 2020) electronic databases regardless of language or publication status using the optimal sensitive search strategy developed by The Cochrane Collaboration. We used Medical Subject Headings (MeSH) [1], Looked up words in text word, abstract, title [2], then Combined [1] with [2]
using Boolean logic (OR) and then Set up proper filters. Selection criteria: Randomised
controlled trials (RCTs) and cluster randomised trials. We excluded quasi-RCTs and cross-over trials. We will include studies comparing health provider counselling intervention to placebo or no counselling/exercise prescription. We excluded studies that had more than a 20% loss to follow-up if they did not apply an intention-to treat analysis. The studies were considered if the outcomes were measured on a continuous scale and
results reported in terms on mean change, confidence intervals of change, standard deviations or standard error and mean. Studies with dichotomous outcomes were
excluded. Data collection and analysis: Two review authors (EKW and MW)
independently carried out data extraction for each included record using a pro forma specifically designed for the purpose. We resolved differences in data extraction by discussion. We plotted the results of each trial as point estimates, using means and standard deviations for the continuous outcomes. Since studies reported different outcome measures but measured the same concept, we calculated the standardised mean
difference (SMD) with 95% confidence interval (CI) using a random-effects models. Main
results: There were 15,269 apparently healthy adults who participated in the 24 included studies. All studies recruited both genders. The stated age range of participants was from 18 to 80 years. Meta-analysis of data from these trials suggests that health provider-led physical activity counselling interventions in primary care may lead to increased self-report physical activity (SMD 0.11, 95% CI 0.04 to 0.17; participants = 13211; studies = 16;
I2 = 50%), total energy expenditure (SMD 0.20, 95% CI 0.13 to 0.27; participants = 3376;
studies = 8; I2 = 2%; overall effect P=0.00001) and systolic blood pressure at six showed a
mean difference (MD) favouring health provider-led physical activity counselling
interventions compared to usual care of -0.10 mmHg (SMD 0.27 95% CI 0.72 to 0.18;I2 =
0%, overall effect P = 0.006) among patients. However meta-analysis showed that health provider-led physical activity counselling interventions in primary care did not lead to
increased aerobic fitness (SMD 0.06, 95% CI -0.01 to 0.12; I2 = 35%), body mass index (SMD
-0.04, 95% CI -0.15 to 0.07) and total cholesterol (SMD -0.27, 95% CI -0.72 to 0.18 and Waist circumference (SMD -0.05, 95% CI-0.15 to 0.06; I2 = 0%;overall effect P=0.24). Although
there were limited data, there was no evidence of an increased risk of adverse events.
Authors' conclusions: Counselling delivered by health providers, probably leads to similar or better physical activity outcomes for patient conditions (moderate-certainty evidence). However, these results must be interpreted with a degree of caution, recognising the variation in interventions reported within studies and the complex interplay of factors affecting outcomes. Several studies included multiple intervention methods, which made it difficult to tease apart which intervention components were the active ingredients
Keywords: physical activity counselling; interventions; primary care
1. Introduction
1.1 Plain language summary
1.1.1 Physical activity counselling interventions for promoting physical activity
familiarization protocol or training sessions are needed to implement physical counselling to everyday practices and facilitate counselling cooperation. Self-monitoring of PA with expert feedback can be a useful and cheaper way of increasing especially the duration of overall weekly PA in the short term.
1.2 Background
Physical activity (PA) improves quality of life and health in clinical and non-clinical populations, including prevention and management of non-communicable diseases (NCDs) (Tero et al., 2017; Lee et al.m 2012) like diabetes (Thent, Das & Henry, 2013), lowers blood pressure and reduces the risk of coronary heart disease, hypertension and
stroke (Soares-Miranda et al., 2016; Green et al., 2011), reduces risk of developing breast
and colon cancer (Kimmel Haas & Hermanns 2014) and has beneficial effects on body
weight, fat mass and central obesity (Wiklund, 2016). A study by Machio, 2012 showed
that NCDs reduced labour force participation by 61% but with elimination of physical inactivity, life expectancy in Kenya was expected to increase by between 0.25-0.49 years (Lee et al., 2012). Regular PA can achieve parallel or greater effects on NCDs’ risk factors
than those achieved with drugs at a lower cost and with minimal adverse effects (
Fiuza-Luces et al., 2013). In a landmark British Medical Journal paper examining the
head-to-head effects of medication versus PA/exercise in chronic disease, Naci & Ioannidis, 2013
from Stanford University made a strong case for equivalent or superior effect of the health benefits of PA. In particular, PA interventions were more effective than drug treatment among patients with stroke and were as effective as medications for the
prevention of diabetes and secondary treatment of NCDs (Naci & Ioannidis, 2013).
Research suggests that the impact PA counselling in primary care could have at a
population level is tremendous. Goldstein et al., 1999 noted that the interaction between
the high prevalence of sedentary behavior and the frequency of physician visits, coupled with primary care PA promotion had the potential to significantly impact the incidence of hypokinetic diseases such as heart disease, stroke, hypertension. In 2005, the American College of Preventive Medicine issued a position statement “that primary care providers should incorporate PA counselling into routine patient visits” (Jacobson other professional organizations echo the American Academy of Family Physicians, the American Academy of Paediatrics, the American College of Obstetrics and Gynaecology, the American Heart
Association, National Institutes of Health, and the Surgeon General (Garry, Diamond &
Whitley, 2002; Jacobson et al., 2005). The ACSM is yet another organization that recognizes and endorses the importance of primary care PA counselling through its
initiative, “Exercise is Medicine” (Sallis, 2011). This initiative seeks to create awareness that
“exercise is medicine” and should be prescribed accordingly. Previous Cochrane reviews found that PA interventions had a moderate effect on participation levels (Foster et al 2005; Richards, Hillsdon, Thorogood & Foster, 2013). This review seeks to give and overview of the effectiveness of all health provider delivered intervention in improving physical activity outcomes in adult populations. It also seeks to give more detail to a
1.3 Description of the condition
It is evaluated that in 2008 physical inactivity caused 9% of untimely mortality and 5.3
million deaths around the world (Lee et al., 2012). This included between 6% to 10% of
all deaths from major non-transferable maladies all-inclusive. It has been assessed that expanding the number of individuals that accomplish the WHO PA proposals by 10% or 25% would forestall more than 553,000 and 1.3 million deaths, separately,
comprehensively every year (Lee et al., 2012). In Kenya, research shows that NCDs have
been a growing problem over the years (WHO, 2017; Machio, 2012). In 2012 NCDs
accounted for more than 50% of total hospital admissions and over 55% of hospital deaths
in Kenya (Kenya Demographic and Health Survey, 2014). According to Kenya
Demographic and Health Survey [KDHS] report (2014), over 61% of the population in Kenya did not engaged in exercise that caused an increase in their heart rate for at least 10 minutes continuously at work or during other activities. In the Western region of Kenya, results showed that 39.1% of women and 45.4% of men did not engage in PA at all (Grimstvedt et al., 2013). This corroborates with studies done in other parts of the world that showed most adults world- wide did not engage in PA at levels with the potential to yield benefits (Ding et al., 2016; Das & Horton, 2016; Hallal., 2012).
1.4 Description of the intervention
Studies have shown that HCPs have the best opportunity to question and counsel patients about the importance of PA since they can take advantage of the on-going care
they provide to a large sector of the population and be influential in changing patients’
behaviours. (Lobelo & de Quevedo, 2016; O’Brien et al., 2017; Lamming et al., 2017). Research has proven that HCPs have access to a large proportion of the sedentary
population (Vuori et al., 2013; Matheson et al., 2011) and are therefore considered to be
well positioned to champion the course of prevention of chronic diseases by prescribing
PA during standard consultation (Teferi, Kumar & Singh, 2017; Matheson et al., 2011). In
Western Kenya for example, Kakamega county which is the current study’s setting is the second most populous county in Kenya with a nurse patient ratio of 86.37 per 100,000
people, which is higher than the national average of 51.5 per 100,000 people (HMIS, 2012).
This is an indication that many HCPs in the county have access to a large proportion of the sedentary population.
1.5 How the intervention might work
Behavioural theories provide a foundation for an intervention that can explain the drivers of PA behaviour and potential pathways for change. It is now generally accepted that
well designed PA interventions are based upon behavioral theories (Bartholomew et al.,
2001). The majority of studies have adopted social psychology theories (Biddle & Mutrie,
2001). Some of the common theories used to explain behaviour include Social cognitive
expectancy, which is the belief that the behaviour will lead to a specific outcome and social norms which refers to the influence of expected behaviour within a social group. With regards to PA behaviour, experts agree that variation in PA behaviour can be
explained by factors operating at two levels, the intrinsic and extrinsic levels (Sallis, 2009).
Intrinsic factors have received greater attention than the external factors in attempts to explain behavioral choices. Exercise prescriptions from HCPs will remind patients that PA is part of their treatment plan and should be adhered to with the same diligence with
which their medication is taken (Grandes et al., 2009). Almost two-thirds of patients (65%)
would be more interested in exercise and PA to stay healthy if advised by their HCP (Leemrijse et al., 2015), while 24% of patients will turn to fitness and health web sites for
advice on exercise and PA but after consulting their HCP first (25%) (Derman et al., 2008).
Researchers have confirmed that majority of people cite their HCP as their primary
source of information regarding healthy lifestyle decisions (diet and exercise) (Lanhers et
al., 2015; Leemrijse et al., 2015).
1.6 Why it is important to do this review
There is no “silver-bullet” to solve the global physical inactivity, an “all of the above” and
“whole of society” approach, including PA counselling and referral in the health care
context, will be required (Heath et al., 2012). While overwhelming success has been
achieved in disease control through environmental interventions such as vaccinations and improved hygiene to increase life expectancy, many authorities in the field of preventative healthcare are of the opinion that too little has been done to target
behavioral factors, particularly physical inactivity (Sallis, 2011). Once we have a better
understanding of these factors, it will help better inform and target training efforts of current and future HCPs, and more importantly encourage HCPs to integrate exercise within standard consultation to further improve the health and well-being of clients. HCPs will begin to develop potentially better biopsychosocial treatment plans and interventions that include individually tailored exercise plans that help clients live increasingly holistic healthy lives. Understanding the effectiveness of these more traditional approaches to implementation should influence PA policy makers and professionals.
1.7 Objectives
2. Methods
2.1 Criteria for considering studies for this review 2.1.1 Types of studies
Randomised controlled trials (RCTs) and cluster randomised trials. We excluded quasi-RCTs and cross-over trials. We will include studies comparing health provider counselling intervention to placebo or no counselling/exercise prescription. We excluded studies that had more than a 20% loss to follow-up if they did not apply an intention-to treat analysis. The studies were considered if the outcomes were measured on a continuous scale and results reported in terms on mean change, confidence intervals of change, standard deviations or standard error and mean. Studies with dichotomous outcomes were excluded.
2.1.2 Types of participants
Community dwelling participants men and women (18 years and above) randomly assigned. Studies that only assessed men or women alone were also included. Exclusion criteria included participants who had secondary hypertension, mental or physical illness serious enough to potentially influence the compliance with the study procedures, alcoholism, type 1 diabetes, current or planned pregnancy and history of myocardial infarction or stroke within the preceding 3 months.
2.1.3 Types of interventions
Physicians, general practitioners, nurses, nutritionist in a primary care setting. Relevant interventions include, but not limited to:
• counselling or advice, or both;
• self-directed or prescribed exercise, or both;
• home based, telephone based or facility-based exercise, or both;
• written education or motivational support material, or both.
Telephone counselling. Intervention and comparators are eligible regardless of delivery or duration.
2.1.4 Types of outcome measures A. Primary outcomes
The primary outcomes of this review included data that assessed change between control and intervention for:
• self-report measures of PA behaviour. This was any physical activity outcome
assessed by questionnaires (Total energy expenditure (Kcal/week or Kcal/day) and physical activity (minutes/week or hours/week))
• aerobic fitness (VO2max) (ml/kg/min or ml/min). It was either estimated from a
submaximal fitness test or recorded directly from a maximal
B. Secondary outcomes
1. clinical anthropometric parameters. This was assessed by body mass index (BMI) and body circumferences (waist).
2. systolic blood pressure assessed in millimetres of Mercury (mmHg)
3. total cholesterol.
2.2 Search methods for identification of studies 2.2.1 Electronic searches
We searched the following electronic databases regardless of language or publication status using the optimal sensitive search strategy developed by The Cochrane
Collaboration (Lefebvre, 2011). We used the PICO (P-patient problem, I-intervention,
C-comparison, O-outcomes) acronym to help keep focus on the key concepts. We Used Medical Subject Headings (MeSH) [1], Looked up words in text word, abstract, title [2], then Combined [1] with [2] using Boolean logic (OR) and then Set up proper filters e.g. randomised controlled trials. We also borrowed the search strategies of a previous systematic review (Richards, Hillsdon, Thorogood & Foster, 2013). The searches were based on the MEDLINE search strategy combined with the sensitivity- and precision-maximising version of the Cochrane Highly Sensitive Search Strategy for identifying RCTs (Lefebvre, 2011). We modified the search strategy to use in the other databases.
Details of the search strategy are presented in the Appendices (Appendices)
1) Cochrane Central Register of Controlled Trials (January, 2020) in the Cochrane
Library;
2) Ovid MEDLINE(R) and In-Process & Other Non-Indexed Citations and Daily
(1948 to 17 January, 2020;
3) Embase Ovid (1980 to 29 January, 2020);
4) Web of Science (Search date: 18 January, 2020);
5) CINAHL (EBSCOhost) (Search date: January, 2020);
6) SPORTDiscus (1949 to 10 January, 2020.
2.2.2 Searching other resources
We screened individual journals and conference proceedings (via handsearching). We also examined reference lists of all pertinent reviews and studies for published RCTs. We conducted a grey literature search to identify studies not indexed in the databases listed above. We used the following sources.
1) OpenGrey (www.opengrey.eu).
2) The web, e.g. Google (http://scholar.google.com)
2.3 Data collection and analysis 2.3.1 Selection of studies
Two investigators (EKW and MW) independently screened titles and abstracts using an
online systematic review toolkit, Covidence (https://www.covidence.org/). Relevant
inclusion. We resolved all disagreements by discussion between the review authors to reach a consensus. Authors applied the following inclusion criteria to determine if the full paper was needed for further scrutiny.
1) The study was a RCT or a cluster randomised trial and aimed to examine the
effectiveness of a health provider based PA counselling/exercise prescription to increase PA levels
2) The study allocated participants to the intervention or control group/placebo
group using a method of randomisation
3) The study included adults aged 18 years and older and recruited community
dwelling adults that were free of chronic disease or pre-existing medical conditions that would limit participation in PA;
4) The study had analysed the results by intention to treat analysis or used per
protocol analysis but with an attrition of less than a 20% (Richards, Hillsdon, Thorogood & Foster, 2013).
2.3.2 Data extraction and management
Two review authors (EKW and MW) independently carried out data extraction for each included record using a pro forma specifically designed for the purpose. We resolved differences in data extraction by discussion. The following characteristics from each study that met the inclusion criteria were extracted:
1) Description of study participants (e.g., sample size, demographic characteristics,
country where study was performed);
2) Eligibility criteria for enrolment
3) Details about the intervention (e.g., length of intervention and follow-up,
individual or group modality, behavioral techniques);
4) Assessment of risk of bias (e.g., study design, generation of allocation sequence,
allocation concealment, blinding, loss to follow-up, inclusion of all randomised participants, incomplete outcome data addressed, and sample size calculation);
5) Outcome measures
We performed all statistical analyses using Review Manager 5.3 (Review Manager
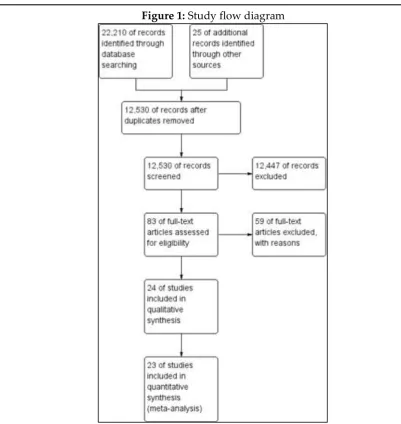
Figure 1: Study flow diagram
2.3.3 Assessment of risk of bias in included studies
Two review authors (MOO and EKW) assessed the risk of bias of included studies
independently using Cochrane's 'Risk of bias’ tool (Higgins, 2011). We assessed each
study for risk of bias in each of the following domains: sequence generation, allocation concealment, blinding of participants and personnel (performance bias), blinding of outcome assessment (detection bias), incomplete outcome data and selective outcome reporting. We assessed the risk of bias associated with (a) blinding and (b) completeness of outcomes separately for self-reported outcomes and objective outcomes. Where there was disagreement between the review authors in risk of bias assessment, a third author (MW) was asked to independently appraise the study and discrepancies were resolved by consensus between all three authors. Risk was categorized as either "Low risk”, "High
risk”, or "Unclear", and was listed in risk of bias tables broken down by trial. Studies at
2.3.4 Measures of treatment effect
Statistical analysis was conducted according to Cochrane guidelines (Higgins 2011). We
plotted the results of each trial as point estimates, using means and standard deviations (SDs) for the continuous outcomes. Since studies reported different outcome measures but measured the same concept, we calculated the standardised mean difference (SMD) with 95% confidence interval (CI) using a random-effects model. This strategy accounts for any potential heterogeneity that may occur following unique intervention approaches developed in various study settings.
2.3.5 Unit of analysis issues
We conducted statistical analysis using Review Manager 5.3 software and visualised the
results using forest plots. When a study had more than one study arm relevant to this review, we examined the overall effects of the intervention versus control by combining the data from the related study arms and calculated the standardized mean difference
using recommended approaches (Higgins, 2011).We also calculated individual study
effects and then the pooled effect sizes with 95% CIs. As in the 2013 update, we used Cohen's three levels to guide our classification of the estimates of effect as small (< 0.5),
medium (0.5 to < 0.8) or large (V 0.8; Cohen, 1988). In studies where data from all repeated
follow up assessments after baseline were available, we combined results from all follow up assessments to get an average change in outcomes for analysis.
The authors corrected the sample size in the cluster randomised trials included
according to the Cochrane handbook (Higgins, 2011). A common approach is to use
external estimates obtained from similar studies. According to the Cochrane handbook, for continuous data only the sample size need be reduced; means and standard deviations should remain unchanged. The effective sample size of a single intervention group in a cluster-randomised trial is its original sample size divided by a quantity called the ‘design effect’. The design effect was calculated using the following formulae 1 + (M
– 1) ICC. For this study we used ICC from a study by Grandes et al., 2009 to compute the
design effect.
2.3.6 Dealing with missing data
We applied the 'Risk of bias' criteria to exclude studies with a high risk of missing data,
as they pose serious threats to validity (Higgins, 2011).Where appropriate, we contacted
study authors for further information. If this was not possible, we reported the number of participants lost to follow-up. For studies that reported continuous data but did not report standard deviations, we calculated these values from other available data such as
standard errors, or imputed them using the methods suggested in Higgins 2011.
2.3.7 Assessment of heterogeneity
different studies was examined by χ2 tests. A P value for a χ2 test of less than 0.10
indicated heterogeneity. An alternative approach to quantify the effect of heterogeneity is assessing the inconsistency among the results of studies with 95% uncertainty intervals. A value of 0% indicates no observed heterogeneity and a value greater than 50% indicates the presence of substantial heterogeneity. We noted potential sources of differences between studies where analyses had high heterogeneity
2.3.8 Assessment of reporting biases
To reduce possible publication bias, we employed strategies to search for and identify relevant unpublished studies for inclusion. These strategies included searching the grey literature and prospective trial registration databases to overcome time-lag bias.
2.3.9 Data synthesis
We carried out statistical analysis using the Review Manager software (Review Manager
5.3). Had it been reasonable to assume that studies were estimating the same underlying
treatment effect, i.e. where studies were examining the same intervention, and the studies’ populations and methods were judged to be sufficiently similar, we would have used fixed-effect meta-analysis for combining data. Since there was clinical heterogeneity sufficient to expect that the underlying treatment effects differed between studies, we used random-effects meta-analysis to produce an overall summary when an average treatment effect across studies was considered clinically meaningful. Where the average treatment effect was not clinically meaningful, we did not combine studies. When we used random-effects analyses, the results were presented as the average treatment effect with 95% confidence intervals
2.3.10 Subgroup analysis and investigation of heterogeneity
Although we identified heterogeneity with type of health provider (general practitioners and nurses), time of follow up, different interventions (face to face, telephone, Internet based) and with PA supervised verses unsupervised, we were unable to investigate subgroup analyses due to insufficient data.
2.3.11 Sensitivity analysis
3. Results
3.1 Description of studies
The study selection process is summarized in Figure 1according to PRISMA guidelines.
See Characteristics of included studies; Characteristics of excluded studies;
Characteristics of ongoing studies
3.1.1 Results of the search
The database search identified 22, 210 studies. 12, 530 studies remained after duplicates were removed. We excluded 12,447 articles following a review of titles and abstracts and retrieved and assessed the full text of 55 articles. 24 randomised trials met the inclusion criteria, and we included them in this update. There were two ongoing studies which will be incorporated into the review at the next update. All searches were completed in January 2020.
3.1.2 Included studies
There were 15,269 apparently healthy adults who participated in the 24 included studies. All studies recruited both genders. The stated age range of participants was from 18 to 80
years, and six of the studies specifically targeted adults aged 65 years or older (Goldstein
et al., 1999; Kerse et al., 2005; Kolt et al., 2007; Mutrie et al., 2012; Petrella et al., 2003;
Pfeiffer et al., 2001)
3.1.3 Study design
Of the 24 included studies, 17 were randomised controlled trials (RCTs) (Aittasalo,
Miilunpalo, Harjula & Pasanen, 2006; Atay, Torman & Yaman, 2014; Fortier et al., 2011;
Green et al., 2002; Hillsdon et al., 2002; Kolt et al., 2007; Lawton et al., 2008; Lewis & Lynch, 1993; Little et al., 2004; Mutrie et al., 2012; Norris et al., 2000; Pears et al., 2016;
Petrella et al., 2003; Pfeiffer et al., 2001; Reid & Morgan, 1979; Swinburn et al., 1998;
Sørensen et at., 2008; Tylor & Fox, 2005), including 7 cluster-RCTs (Elley et al., 2003;
Goldstein et al., 1999; Grandes et al., 2009; Grandes et al., 2011; Kerse et al., 2005; Petrella, Lattanzio, Shapiro & Overend, 2010)
3.1.4 Location and Setting
One study was conducted in Finland (Aittasalo, Miilunpalo, Harjula & Pasanen, 2006),
one study in Turkey (Atay, Torman & Yaman, 2014), five studies in New Zealand (Elley
et al., 2003; Kerse et al., 2005; Kolt et al., 2007; Lawton et al., 2008; Swinburn et al., 1998),
two studies in Spain (Grandes et al., 2009; Grandes et al., 2011 ), four studies in the United
States (Goldstein et al., 1999; Green et al., 2002; Lewis & Lynch, 1993; Pfeiffer et al., 2001),
three studies in the United kingdom (Hillsdon et al 2002; Little et al 2004; Mutrie et al.,
2012; Pears et al., 2016; Tylor & Fox, 2005), four studies in Canada (Fortier et al 2011;
one study in the Pacific north (Norris et al 2000) and one study in Denmark (Sørensen et at 2008).
3.1.5 Types of intervention
The interventions in the study were all based in a primary care setting and were administered by either physician, general practitioners, doctors or nurses. The main modes of delivery of physical activity counselling were face to face, telephone, written or
combined. Of the 24 included studies, 21 were face to face delivery (Aittasalo, Miilunpalo,
Harjula & Pasanen, 2006; Atay, Torman & Yaman, 2014; Elley et al., 2003; Fortier et al., 2011; Goldstein et al., 1999; Grandes et al., 2011; Hillsdon et al., 2002; Kerse et al., 2005;
Lawton et al., 2008; Lewis & Lynch, 1993; Little et al., 2004; Mutrie et al., 2012; Norris et al., 2000; Pears et al., 2016; Petrella, Lattanzio, Shapiro & Overend, 2010; Petrella et al., 2003; Pfeiffer et al., 2001; Reid & Morgan, 1979; Sørensen et at., 2008; Tylor & Fox, 2005), five were either telephone delivered or combined with face to face (Green et al 2002;
Hillsdon et al., 2002; Kolt et al., 2007; Lawton et al., 2008; Swinburn et al., 1998), 5 were
either written only or combined with face to face delivery (Elley et al., 2003; Grandes et
al., 2009; Lewis & Lynch, 1993; Little et al., 2004; Reid & Morgan, 1979).
3.1.6 Follow up periods
The follow up periods ranged from one month to 25 months. One study used a one month
follow up (Little et al., 2004), five studies used a six months follow up period (Aittasalo,
Miilunpalo, Harjula & Pasanen, 2006; Atay, Torman & Yaman, 2014; Grandes et al., 2009;
Norris et al 2000; Reid & Morgan, 1979), five studies used a 12 months follow up period (Hillsdon et al., 2002; Kerse et al., 2005; Kolt et al., 2007; Petrella, Lattanzio, Shapiro & Overend, 2010; Petrella et al., 2003), and 3 studies used a 24 months follow up period (Grandes et al., 2011; Green et al., 2002; Lawton et al., 2008). Other studies had variables follow up periods (Elley et al., 2003; Fortier et al., 2011; Goldstein et al., 1999; Lewis & Lynch, 1993; Mutrie et al., 2012; Pears et al., 2016; Pfeiffer et al., 2001; Swinburn et al., 1998; Sørensen et al., 2008; Tylor & Fox, 2005)
3.1.7 Outcomes
The primary out comes in the studies were: Total energy expenditure (Kcal/week or
Kcal/day) reported in 8 studies (Atay, Torman & Yaman, 2014; Elley et al., 2003; Hillsdon
et al., 2002; Kerse et al., 2005; Norris et al., 2000; Pears et al., 2016; Petrella, Lattanzio, Shapiro & Overend, 2010; Tylor & Fox, 2005), Self reported physical activity
(minutes/week or hours/week) reported in 17 studies (Aittasalo, Miilunpalo, Harjula &
Pasanen, 2006; Elley et al 2003; Goldstein et al., 1999; Grandes et al., 2009; Grandes et al., 2011; Green et al., 2002; Kerse et al., 2005; Kolt et al., 2007; Lawton et al., 2008; Lewis & Lynch, 1993; Little et al., 2004; Norris et al., 2000; Pears et al., 2016; Pfeiffer et al., 2001;
Swinburn et al., 1998; Sørensen et at 2008; Tylor & Fox, 2005,) Aerobic fitness VO2 Max
(ml/kg/min or ml/min) reported in six studies (Fortier et al., 2011; Grandes et al., 2009;
Reid & Morgan, 1979), Systolic blood pressure(mmHg) reported in seven studies (Atay, Torman & Yaman, 2014; Elley et al., 2003; Hillsdon et al., 2002; Kerse et al., 2005; Lawton et al., 2008; Petrella, Lattanzio, Shapiro & Overend, 2010; Petrella et al., 2003) and Body
Mass Index (BMI) reported in seven studies (Atay, Torman & Yaman, 2014; Fortier et al.,
2011; Hillsdon et al., 2002; Petrella, Lattanzio, Shapiro & Overend, 2010; Petrella et al., 2003; Sørensen et at., 2008; Tylor & Fox, 2005). Other reported outcomes include Steps/walking, Body circumferences (waist, hip or limb), Total cholesterol and Blood Glucose.
3.1.8 Excluded studies
After assessment, the following 31 studies were excluded: 3 did not have a control group (Activity, 2001; Armit et al., 2009; Hardcastle, 2012); 2 did not use a randomised control
trial study/cluster randomised control trial design (Bucholz & Purath, 2007; Burn,
Camaione & Chartterton, 2000); 3 reported the outcomes as odds ratios and could not be
included in the meta analysis (Gao et al, 2016; Harland et al, 1999; Harrison, Roberts &
Elton, 2004); 15 were not based in a primary care setup and intervention not health provider based (Bennet et al, 2008; Calfas et al, 1996; Cunningham et al, 1987; Duru et at., 2010; Kriska et al., 1986; Marcus et al., 2007; Pekmezi et al., 2016; Schröder et al,. 2018;
Skår et al., 2011; Spittaels, Bourdeaudhuij & Vandelanotte, 2007; Steele, Mummery & Dwyer, 2009; Stralen et al., 2009; Wanner et al., 2009; William et al., 2006); 4 had inadequate data and attempts to reach the authors were futile (Bull & Jamrozik, 1999;
Dubbert et al., 2002; Fortier et al., 2006; Jimmy & Martin, 2005); 5 reported different
outcomes and/or used different interventions (Kastarinen et al., 2002; Long et al., 1996;
Nymberg et al., 2018; Pinto et al., 1998; Rome, Ekdahl & Gard, 2009). See Characteristics of excluded studies.
3.2 Risk of bias in included studies
We prepared an assessment of risk of bias for each trial and illustrated final judgements
for the ten criteria in Figure 2 and Figure 3. All studies had some methodological
shortcomings, in most instances related to unclear risk of bias for different criteria.
3.2.1 Allocation (selection bias)
Allocation bias was generally low in the review with 92% (22) of the studies having low risk. Only one study had a high risk of allocation bias. Most studies stated that participants or practices (in case of cluster randomisation) were assigned randomly, according to a computerised randomisation scheme. For one study, the risk of bias for random sequence generation was unclear owing to poor reporting.
Figure 3: Risk of bias summary: review authors'
3.2.2 Blinding (performance bias and detection bias)
We judged the risk of performance bias as unclear because no information was available. Of the 24 studies included, 33% (8) studies had low risk, while 54% (13) were classified as having unclear risk because they did not provide sufficient information on blinding of outcome assessment. Only three studies had high risk of performance bias. We expect that patients and personnel were not blinded in these studies because the care provider constitutes the intervention. Whether this lack of blinding influences outcomes is unclear.
3.2.3 Incomplete outcome data (attrition bias)
In half of the studies, 80% or more of the initial participants completed the study. Risk of bias due to incomplete outcome data was unclear in six of the studies because of limited reporting about follow-up. Four studies were classified as having high risk of attrition bias due to high follow up losses and no explanation at all.
3.2.4 Selective reporting (reporting bias)
A protocol was available for each study, and 63% (15) of the studies reported predefined outcome measures. Absence of study protocols to confirm reporting of all intended outcomes led to the unclear judgement in seven of the studies.
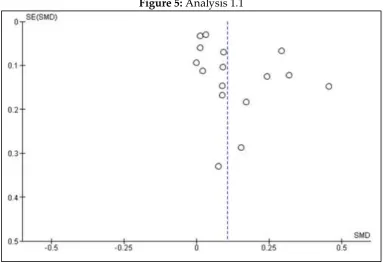
Figure 5: Analysis 1.1
Note: Funnel plot of comparison: 1 Physical activity counselling in primary care setting verses Usual care
Figure 7: Analysis 1.2
Note: Funnel plot of comparison: 1 Physical activity counselling in primary care setting verses Usual care
or placebo, outcome: 1.2 Total energy expenditure (Kcal/week or Kcal/day).
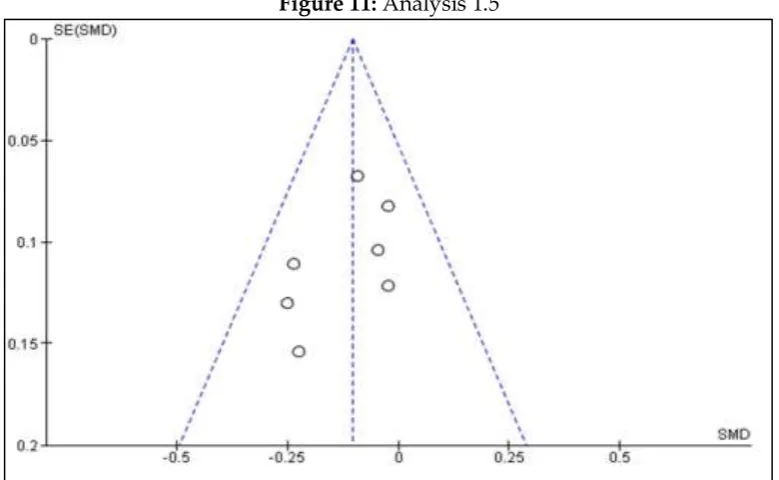
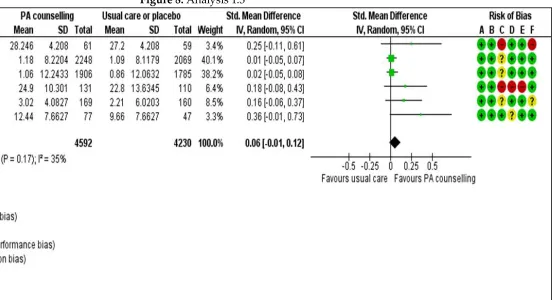
Figure 11: Analysis 1.5
Note: Funnel plot of comparison: 1 Physical activity counselling in primary care setting verses Usual care
or placebo, outcome: 1.5 Systolic blood pressure(mmHg). Effects of interventions
3.2.5 Publication bias
In the current review, there was no clear evidence of funnel plot asymmetry for the main significant outcomes total energy expenditure (Kcal/week or Kcal/day) and
systolic blood pressure (mmHg) (Figure 7; Figure 11), however there was some signs of
publication bias on the outcome self reported physical activity (minutes/week or hours/week), this can be attributed to limited studies with small sample size. See funnel plot (Figure 5).
A total of 23 trials investigated patient outcomes (Aittasalo, Miilunpalo, Harjula &
Pasanen, 2006; Atay, Torman & Yaman, 2014; Elley et al., 2003; Fortier et al., 2011;
Goldstein et al., 1999; Grandes et al., 2009; Grandes et al., 2011; Green et al., 2002; Hillsdon et al., 2002; Kerse et al., 2005; Kolt et al., 2007; Lawton et al., 2008; Lewis & Lynch, 1993;
Little et al., 2004; Norris et al., 2000; Pears et al., 2016; Petrella, Lattanzio, Shapiro & Overend, 2010; Petrella et al., 2003; Pfeiffer et al., 2001; Reid & Morgan, 1979; Swinburn et al., 1998; Sørensen et al., 2008; Tylor & Fox, 2005)
We grouped patient outcomes into the following categories: self reported physical activity (minutes/week or hours/week), Total energy expenditure (Kcal/wee or Kcal/day),
aerobic fitness VO2 max (ml/kg/min or ml/min), body mass index (Kg/m2), systolic blood
pressure (mmHg), total cholesterol (mmol/l) and waist circumference.
Tables 1: Summary of findings
Patient or population: primary care: A systematic review and meta-analysis
Setting: primary care setting
Intervention: Physical activity counselling in primary care setting
Comparison: Usual care or placebo
Outcomes Anticipated absolute
effects* (95% CI)
Relative effect (95% CI) № of participants (studies) Certainty of the evidence (GRADE) Comments
Risk with placebo Risk with
Physical activity counselling in primary care setting versus Usual care or placebo Self reports physical activity (minutes/week or hours/week)
The mean self reports physical activity
(minutes/week or hours/week) was 0
SMD 0.11 higher (0.04 higher to 0.17 higher)
- 13211 (16 RCTs)
⊕⊕⊝⊝ LOW 1 2 3 4 5
Total energy expenditure (Kcal/week or Kcal/day)
The mean total energy expenditure (Kcal/week or Kcal/day) was 0
SMD 0.2 higher (0.13 higher to 0.27 higher)
- 3376 (8 RCTs)
⊕⊕⊕⊕ HIGH 1 3 4 6
Aerobic fitness VO2 Max (ml/kg/min or ml/min)
The mean aerobic fitness VO2 Max (ml/kg/min or ml/min) was 0
SMD 0.06 higher (0.01 lower to 0.12 higher)
- 8822 (6 RCTs)
⊕⊕⊝⊝
Body Mass Index (BMI)
The mean body Mass Index (BMI) was 0 SMD 0.04 lower (0.15 lower to 0.07 higher)
- 2371 (7 RCTs)
⊕⊝⊝⊝ VERY LOW 3
9 10 11
Systolic blood pressure(mmHg)
The mean systolic blood pressure(mmHg) was 0 SMD 0.1 lower (0.18 lower to 0.03 lower)
- 2856 (7 RCTs)
⊕⊕⊕⊝ MODERATE
3 4 12 13
Total cholesterol The mean total cholesterol was 0
SMD 0.27 lower (0.72 lower to 0.18 higher)
- 2459 (4 RCTs)
⊕⊝⊝⊝ VERY LOW 1
3 11 14 15 16
Waist circumference
The mean waist circumference was 0
SMD 0.05 lower (0.15 lower to 0.06 higher)
- 1469 (4 RCTs)
⊕⊝⊝⊝ VERY LOW 3
9 12 16 17
*The risk in the intervention group (and its 95% confidence interval) is based on the assumed risk in the
comparison group and the relative effect of the intervention (and its 95% CI).
CI: Confidence interval; RR: Risk ratio; OR: Odds ratio;
Grade Working Group grades of evidence
High certainty: We are very confident that the true effect lies close to that of the estimate of the effect
Moderate certainty: We are moderately confident in the effect estimate: the true effect is likely to be close to the
estimate of the effect, but there is a possibility that it is substantially different
Low certainty: Our confidence in the effect estimate is limited: the true effect may be substantially different from
the estimate of the effect
Very low certainty: We have very little confidence in the effect estimate: the true effect is likely to be substantially
different from the estimate of effect
1 The studies with the highest weights only had unclear performance bias (single-blind). However, some studies noted that it was impossible to blind the personnel in this kind of intervention
2 The variation of effect sizes in the study was too big (0.02-0.46). The I2 was moderate at 50% and the P-value of heterogeneity was statistically significant (p=0.01)
3 A few variations in the intervention between studies. Some studies have a combined intervention of written and face to face counselling, telephone, and face to face counselling while others only focus on face to face,
4 The confidence interval of the overall effect was not wide and the sample size was above the recommended of 400 and the pooled effect did not include a null effect
5 The funnel plot was asymmetric indicating publication bias
6 There was a good overlap of confidence intervals amongst studies, the I2 was low at 2% and the P-value of heterogeneity was not statistically significant (P=0.42)
7 Only one study has signs of performance, detection, and attrition bias
8 There was a good overlap of confidence intervals amongst studies, the I2 was moderate at 35% and the P-value of heterogeneity was not statistically significant (P=0.17)
9 The confidence interval of the overall effect included the null effect and it was unclear if there was benefit or harm
10 There was a high performance, detection, and attrition risk of bias in the studies that had the highest weight
11 There were huge variations in the size and direction of the effects in the study (0.01 to-0.35). There was also a poor overlap of confidence intervals
13 There was a good overlap of confidence intervals amongst studies, all studies had consistency in direction of the effects, the I2 was low at 0% and the p-value of heterogeneity was not statistically significant (p=0.54)
14 There was little to no overlap amongst confidence intervals, the I2 percentage was 96% indicating heterogeneity amongst studies
15 There were huge variations in the size and direction of the effects in the study (0.09 to-0.75). There was also a poor overlap of confidence intervals
16 The studies were below 10 hence we could not generate a funnel plot, however, some studies had signs of selective analysis and poor methodology
17 There was a good overlap of confidence intervals amongst studies, all studies had consistency in direction of the effects, the I2 was low at 0% and the p-value of heterogeneity was not statistically significant (p=0.42)
Note: Physical activity counselling in primary care setting versus usual care or placebo compared to placebo in primary care: a systematic review and meta-analysis
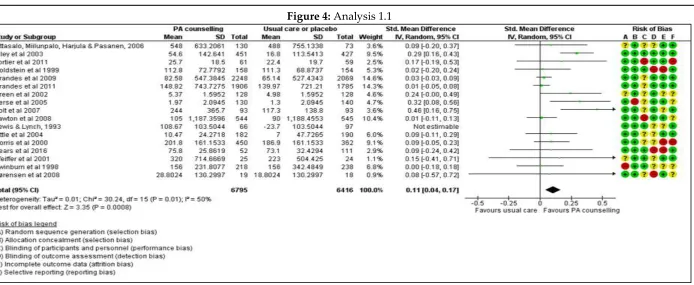
3.2.6 Self reported physical activity (minutes/week or hours/week)
Sixteen trials evaluated self reported physical activity in minutes/week (Aittasalo,
Miilunpalo, Harjula & Pasanen, 2006; Elley et al., 2003; Fortier et al., 2011; Goldstein et al., 1999; Grandes et al., 2009; Grandes et al., 2011; Green et al., 2002; Kerse et al., 2005;
Kolt et al., 2007; Lawton et al., 2008; Little et al., 2004; Norris et al., 2000; Pears et al., 2016;
Pfeiffer et al., 2001; Swinburn et al., 1998; Sørensen et al., 2008). Meta-analysis of data from these trials suggests that health provider-led physical activity counselling interventions in primary care may lead to increased physical activity among patients. The pooled effect was positive and high favouring the physical activity counselling interventions over usual care/placebo (random effects analysis P=0.0008). Data show little
evidence of statistical heterogeneity. Excluding from the meta-analysis a trial by (Lewis
& Lynch, 1993) greatly changed the result. Results differed considerably in the sensitivity
analyses (SMD 0.11, 95% CI 0.04 to 0.17; participants = 13211; studies = 16; I2 = 50% Figure
4). A SMD of 0.11 represents a small difference between groups. The evidence is of low
certainty (Summary of findings table 1) owing to a small confidence interval and
Figure 4: Analysis 1.1
Notes: Forest plot of comparison: 1 Physical activity counselling in primary care setting verses Usual care or placebo, outcome: 1.1 Self reports physical activity (minutes/week or hours/week).
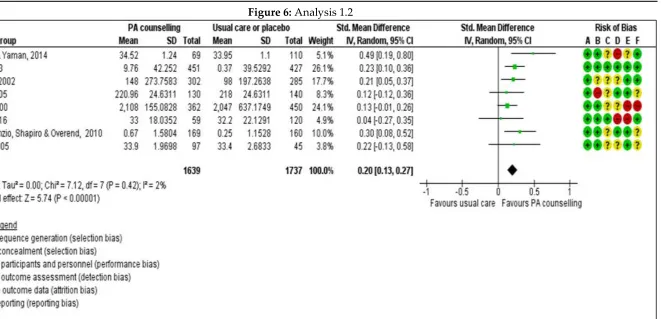
3.2.7 Total energy expenditure (Kcal/week or Kcal/day)
We found high-quality evidence, based on eight studies (Atay, Torman & Yaman, 2014; Elley et al., 2003; Hillsdon et al., 2002; Kerse et
al., 2005; Norris et al., 2000; Pears et al., 2016; Petrella, Lattanzio, Shapiro & Overend, 2010; Tylor & Fox, 2005), that the use health provider-led physical activity counselling interventions in primary care may lead to increased total energy expenditure among patients
when compared to usual care alone (SMD 0.20, 95% CI 0.13 to 0.27; participants = 3376; studies = 8; I2 = 2%; overall effect P=0.00001)
Figure 6: Analysis 1.2
Notes: Forest plot of comparison: 1 Physical activity counselling in primary care setting verses Usual care or placebo, outcome: 1.2 Total energy expenditure (Kcal/week or Kcal/day).
3.2.8 Aerobic fitness VO2 Max (ml/kg/min or ml/min)
Sixt trials (8822 participants) evaluated aerobic fitness as VO2 max (Fortier et al., 2011; Grandes et al., 2009; Grandes et al., 2011; Petrella et al., 2003; Petrella, Lattanzio, Shapiro & Overend, 2010; Reid & Morgan, 1979). Meta-analysis of data from these trials suggests that health provider-led physical activity counselling interventions in primary care did not lead to increased aerobic fitness among
was not significant (random effects analysis P=0.11). The evidence is of low certainty (Summary of findings, Table 1) owing to a large
confidence interval and moderate clinical heterogeneity, see, Analysis 1.3:
Figure 8: Analysis 1.3
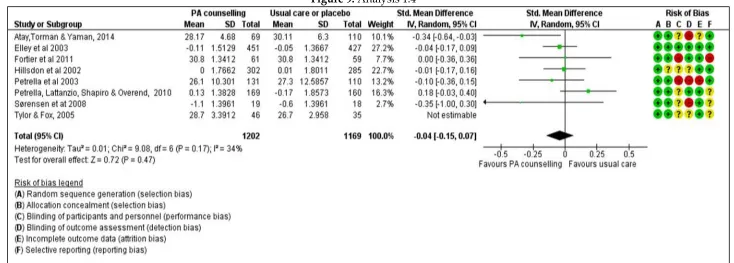
3.2.9 Body Mass Index (BMI) (Kg/m2)
Seven trials (2371 participants) investigated changes in body mass index (Atay, Torman & Yaman, 2014; Elley et al., 2003; Fortier et al.,
2011; Hillsdon et al., 2002; Petrella et al., 2003; Petrella, Lattanzio, Shapiro & Overend, 2010; Sørensen et at., 2008; Tylor & Fox, 2005). All the trials provided sufficient data for a metaanalysis. Data show that there may be little or no difference in body mass index (SMD
-0.04, 95% CI -0.15 to 0.07) Figure 9. For body mass index, the evidence is of very low certainty (Summary of findings, Table 1) owing to
moderate inconsistency (I2 = 34%; overall effect P=0.11; Random effects analysis) and imprecision (wide confidence interval). Results did
not change considerably under Sensitivity analysis. See, Analysis 1.4:
Figure 9: Analysis 1.4
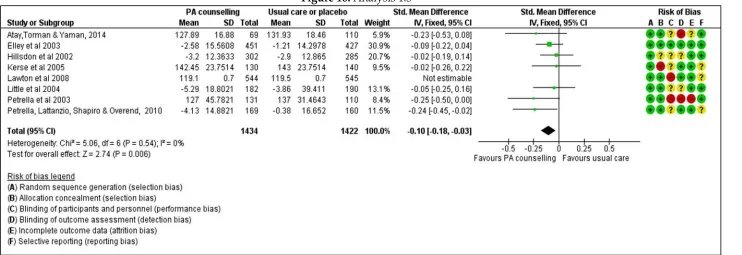
3.2.10 Systolic blood pressure (mmHg)
Eight trials (2856 participants) reporting systolic blood pressure at six showed a mean difference (MD) favouring health provider-led
physical activity counselling interventions compared to usual care of -0.10 mmHg (95% CI -0.18 to -0.03; Analysis 1.5. The analysis was
based on a fixed effects model. One study (Lawton et al., 2008) was excluded during sensitivity analysis. There was no heterogeneity
amongst results of the remaining trials (Atay, Torman & Yaman, 2014; Elley et al., 2003; Hillsdon et al., 2002; Kerse et al., 2005; Little et al., 2004; Petrella et al., 2003; Petrella, Lattanzio, Shapiro & Overend, 2010) (I2 = 0%, overall effect P = 0.006) Figure 10 .The evidence is of
moderate certainty owing to a small confidence interval and small clinical heterogeneity (Summary of findings, Table 1).
Figure 10: Analysis 1.5
3.2.11 Total cholesterol (mmol/l)
Four trials (2459 participants) investigated total cholesterol (Elley et al., 2003; Fortier et al., 2011; Lawton et al., 2008; Little et al., 2004).The meta-analysis suggests that there may be little or no difference between health provider-led physical activity counselling interventions
in primary care and usual care (SMD -0.27, 95% CI -0.72 to 0.18; very low-certainty evidence; Analysis 1.6 ). For total cholesterol, evidence
is of very low certainty (Summary of findings, Table 1) owing to strong inconsistency (I2 = 96%;overall effect P=0.24; random effects
analysis Figure 12 ) and a wide confidence interval, suggesting that the extent to which the total cholesterol differs between health provider-led physical activity counselling interventions in primary care and usual care varied with the context of physical activity.
Results did not change considerably in the Sensitivity analysis.
Figure 12: Analysis 1.6
3.2.12 Waist circumference (cm)
Four trials (1469 participants) investigated waist circumference (Atay, Torman & Yaman, 2014; Fortier et al., 2011; Lawton et al., 2008;
Tylor & Fox, 2005). All the trials provided sufficient data for a meta-analysis. The meta-analysis suggests that there may be little or no difference between health providerled physical activity counselling interventions in primary care and usual care (SMD 0.05, 95% CI
-0.15 to 0.06; very low-certainty evidence; Analysis 1.6 ). For total cholesterol, evidence is of very low certainty (Summary of findings,
Table 1) owing to a wide confidence interval (imprecision), suggesting that the extent to which the waist circumference differs between health provider-led physical activity counselling interventions in primary care and usual care varied with the context of physical activity.
There was no heterogeneity amongst study results (I2 = 0%; overall effect P=0.24; fixed effects analysis). Results did not change
considerably in the Sensitivity analysis.
Figure 13: Analysis 1.8
4. Data and analyses
Table 2: Physical activity counselling in primary care setting verses Usual care or placebo
Outcome or Subgroup Studies Participants Statistical Method Effect
Estimate
1.1 Self reports physical activity (minutes/week or hours/week)
16 13211 Std. Mean Difference (IV, Random, 95% CI)
0.11 [0.04, 0.17] 1.2 Total energy expenditure
(Kcal/week or Kcal/day)
8 3376 Std. Mean Difference (IV, Random, 95% CI)
0.20 [0.13, 0.27] 1.3 Aerobic fitness VO2 Max
(ml/kg/min or ml/min)
6 8822 Std. Mean Difference (IV, Random, 95% CI)
0.06 [-0.01, 0.12] 1.4 Body Mass Index
(BMI)
7 2371 Std. Mean Difference (IV, Random, 95% CI)
-0.04 [-0.15, 0.07] 1.5 Systolic blood pressure
(mmHg)
7 2856 Std. Mean Difference (IV, Fixed, 95% CI)
-0.10 [-0.18, -0.03] 1.6 Total cholesterol 4 2459 Std. Mean Difference
(IV, Random, 95% CI)
-0.27 [-0.72, 0.18] 1.8 Waist circumference 4 1469 Std. Mean Difference
(IV, Fixed, 95% CI)
-0.05 [-0.15, 0.06]
5. Discussion
5.1 Summary of main results
We included 23 randomised controlled trials (RCTs) and cluster randomised trials examining 15,069 patients aged between 18 to 80 years in this review. Sixteen studies examined self-reported physical activity in minutes/week (N =13211 randomised); eight studies examined total energy expenditure (N = 3376 randomised); six studies examined aerobic fitness (N=8822 randomised); seven trials examined body mass index (N=2371 randomised); seven trials examined systolic blood pressure (N=2856 randomised); four trials examined total cholesterol (N=2459 randomised) and four trials examined waist circumference (N = 2385 randomised). Findings suggest that counselling delivered by health providers, probably leads to similar or better physical activity outcomes for patient conditions (moderate-certainty evidence). However, these results must be interpreted with a degree of caution, recognising the variation in interventions reported within studies and the complex interplay of factors affecting outcomes. Several studies included multiple intervention methods, which made it difficult to tease apart which intervention components were the active ingredients. The effectiveness of the interventions was not significant in various outcomes. There was a paucity of data reporting on adverse events.
In summary:
1) Counselling delivered by health providers may lead to improved self reported
activity, compared to usual care. However, the SMD was small (0.11).
2) Total energy expenditure and blood pressure outcomes are probably slightly
3) There were no observed significant improvements in aerobic fitness, body mass index, total cholesterol and waist circumference
An overview can be found in (Summary of findings, Table 1)
5.2 Overall completeness and applicability of evidence
Several issues need to be considered when one is making judgements about the applicability of these findings in primary care setting. First, we were able to identify a moderate number of studies published up to 2014, which were sufficient to address all objectives of the review. These studies are highly varied in terms of types of health providers (physicians and nurses), healthcare setting, and geographical settings, and they examine counselling provided to general patient populations as well as to specific groups of patients, such as people with risk factors for non-communicable diseases. Next, we found a large variation in outcome measures. For a number of outcomes there were only a few contributing studies whereas for some other outcomes a relatively large number of studies contributed to the evidence. Furthermore, often details (such as type of health provider and type of intervention) were missing or unclear from study reports. Therefore, we were not able to conduct planned subgroup analyses. As a result, it is not possible to draw conclusions on the influence of health provider type and different types of the interventions on outcomes. In addition, all included studies were conducted in high-income country settings (Finland, Turkey, New Zealand, Spain, US, Canada, UK and Denmark). In other studies (Aittasalo, Miilunpalo, Harjula & Pasanen, 2006), patients were given an appointment but in others they were only advised to see their physicians (Elley et al., 2003), or included a longer time slot for physical activity consultations (Grandes et al., 2009). These differences in the interventions provided might have influenced study outcomes. Last, over the years, primary care services have changed considerably in many settings. However, we did not identify a trend in types of physical activity counselling interventions or in changes in outcomes assessed that might reflect changes in primary care services.
5.3 Quality of the evidence
We assessed the quality of evidence per outcome using the GRADEpro GDT. All studies
outcome measures (detection bias), which occurred for all the interventions. Overall, reports were poorly written and, in some cases, it was difficult to follow the analyses, although the more recent studies have improved in their design and analyses.
5.4 Potential biases in the review process
The process of study selection, data extraction, and assessment of risk of bias of included studies was performed by two independent review authors and we resolved disagreements through discussion and consensus. Our search strategy was designed to maximise sensitivity (detecting relevant research) at the expense of specificity (excluding irrelevant research). Even so, relevant research proved difficult to identify, and some studies may have been missed. We conducted this review according to Cochrane standards. Therefore, we are confident in the quality of the review itself. Although publication bias cannot be ruled out in this area, it seems unlikely that this bias could be substantial. We were unable to assess the risk of publication bias adequately as there was a very limited number of studies assessing similar types of interventions and outcomes. We had considerable difficulty in classifying the interventions and we might have been too restrictive in combining studies. However, we believe that the broad categories of physical activity interventions that we made have resulted in a meaningful categorisation. Thus, we believe it is possible to get at least an impression of the effectiveness of interventions in the various outcomes.
5.5 Agreements and disagreements with other studies or reviews
Our results mirrored in other systematic reviews of PA interventions for older adults. A review by Hillsdon, Thorogood & Foster, 2013 found that there was a positive and moderate pooled effect on self-reported PA at 12 months (SMD 0.19; 95% CI 0.06 to 0.31), however the systematic review focused on face to face interventions only. A study by
Conn (2011) reported on randomised and non-randomised PA interventions (n = 99,011 participants) and calculated a mean effect size for the comparison of intervention groups
versus control groups that was positive but not significant (SMD 0.19; 95% CI –0.14 to
0.53). Hobbs (2013) reported an identical pooled effects size for PA interventions for older
5.6 Authors' conclusions 5.6.1 Implications for practice
The review concludes that to initiate important increases in physical activity, both exercise prescription and counselling should be incorporated in standard practice. We recommend as a tool for primary health care physicians to promote PA, especially at health check and control visits, where more time can be allocated for the appointment. A more comprehensive familiarization protocol or training sessions are needed to implement physical counselling to everyday practices and facilitate counselling cooperation. Self-monitoring of PA with expert feedback can be a useful and cheaper way of increasing especially the duration of overall weekly PA in the short term.
5.6.2 Implications for research
From the review conclusions, comprehensive approaches involving repeated interventions that include behaviour change techniques and booster programs might enhance the long-term effectiveness of advice given by physicians and other health care professionals. Future studies should address the modelling and evaluation of these new and complex interventions and also demonstrate what intensity of follow-up is needed for longer-term maintenance
Acknowledgements
The authors wish to acknowledge Prof Edwin Kadima Wamukoya, and Dr Maximilla Wanzala for their contributions and support during the writing of this review.
Contributions of authors
Micky Olutende Oloo, Prof Edwin Wamukoya and Dr. Maximilla Wanzala conceived the paper, designed and performed the review. All authors read and approved the final manuscript
Declarations of interest
The authors declare that they have no competing interests. The findings and conclusions presented in this manuscript are those of the authors and do not necessarily reflect the official position of Masinde Muliro University of Science and Technology
References
Aittasalo, M., Seppo, M., Katriina, K., Matti P. (2006). A randomised intervention of physical activity promotion and patient self-monitoring in primary health care.
Preventive Medicine, (42), 40-46.
Emrah A., Naciye, F. T., Hakan, Y. (2014). Exercise Prescription by Primary Care doctors:
Effect on Physical Activity level and Functional Abilities in Elderly. Turkish Journal
Elley, C., Kerse, N., Arroll, B., & Robinson, E. (2003). Effectiveness of counselling patients on physical activity in general practice: cluster randomised controlled trial. British
Medical Journal, (326), 793-799. [DOI: 10.1136/bmj.326.7393.793]
Michelle S. F., William H., Tracey L., O’Sullivan, C. B., Ronald J. S., Robert D. R., Pierre,
B., Éric D., Étienne B., Julie, B., and Diane, C. (2011). Impact of integrating a physical activity counsellor into the primary health care team: physical activity and health outcomes of the Physical Activity Counselling randomised controlled trial. Appl. Physiol. Nutr, 36.
Goldstein, M. G., Pinto, B. M., Marcus, B. H., Lynn, H., Jette, A. M., Rakowski, W., ... Tennstedt, S. (1999). Physician-based physical activity counselling for
middle-aged and older adults: A randomized trial. Annals of Behavioral Medicine, (21),
40-47. [DOI: 10.1007/BF02895032]
Grandes, G., Sanchez, A., Sanchez-Pinilla, R. O., Ortega, R., Torcal, J., Montoya, I., ... Serra, J. (2009). Effectiveness of physical activity advice and prescription by
physicians in routine primary care. A cluster randomized trial. Archives of Internal
Medicine, 169(7), 694-701. [DOI: 10.1001/archinternmed.2009.23]
Gonzal, G., Alvaro, S., Imanol, M., Ricardo, O., Sanchez, P., Jesus, T.(2011). Two-year Longitudinal Analysis of a cluster randomised Trial of Physical Activity
Promotion by General Practitioners. Plos One, 6(3).
Beverly, B.G., Timothy, M., Michael, H., Linda, M., Madlen, C., Diana, Buist.(2002). Effectiveness of Telephone Support in Increasing Physical Activity Levels in
Primary Care Patients. American Journal of Preventive Medicine, 22(3), 177-183.
Melyvyn, H., Margaret, T., Ian, W. & Charlie, F. (2002). Advising people to take more exercise is ineffective: a randomised controlled trial of physical activity promotion
in primary care. international journal of epidemiology, 31, 808-815.
Kerse, N., Elley, C. R., Robinson, E., Arroll, B. (2005). Is physical activity counselling effective for older people? A cluster randomised, controlled trial in primary care.
Journal of the American Geriatric Society, 53(11), 1951-1956.
Gregory, S. K., Grant, M. S., Ngaire, K., Nick, G., and Melody, O. (2007). Effect of Telephone Counseling on Physical Activity for Low-Active Older People in
Primary Care: A Randomized, Controlled Trial. JAGS, 55, 986-992.
Beverley, A. L., Sally, B. R., Raina, E., Anthony, C. D., Anna, F., Simon, A. M. (2008). Exercise on prescription for women aged 40-74 recruited through primary care:
two year randomised controlled trial. BMJ, 337.
Lewis, B. S, & Lynch, W. D. (1993). The effect of physician advice on exercise behavior.
Preventive medicine, 22, 110-121.
Little, P., Dorward, M., Gralton, S., Hammerton, L., Pillinger, J., & White, P. (2004). A randomised controlled trial of three pragmatic approaches to initiate increased physical activity in sedentary patients with risk factors for cardiovascular disease.
British Journal of General Practice, 54(500), 189-195.
(2014). Increasing older adults’ walking through primary care:results of a pilot
randomised controlled trial. Family Practice, (29) 633-642. [DOI:
10.1093/fampra/cms038]
Norris, S. L., Grothaus, L. C., Bucner, D. M., & Pratt, M. (2000). Effectiveness of
physician-based assessment and counselling for exercise in a staff model HMO. Preventive
Medicine, 30, 513-523. [DOI: 10.1006/pmed.2000.0673]
Sally, P., Maaike, B., Katie, M., Joana, V., Richard, A., Parker, K.W., Soren, B., Wilson, E., Toby P., Ann-Louise, K., Simon, G., Stephen, S., Hardeman. W. (2016). A randomised controlled trial of three very brief interventions for physical activity
in primary care. BMC Public Health, 16.
Robert, J., Petrella, C. N., Lattanzio, S. S., Tom, O. (2010). Improving aerobic fitness in
older adults. Canadian Family Physician, 56, 191-200.
Petrella, R. J., Koval, J. J., Cunninham, D. A., & Paterson, D. H.(2003). Can primary care doctors prescribe exercise to improve fitness? The step test exercise prescription
(STEP) project. American Journal of Preventive Medicine, 24, 316-322. [DOI:
10.1016/S0749-3797(03)00022-9]
Pfeiffer, B. A., Clay, S. W., & Conatser Jr., R. R. (2001). A green prescription study: Does written exercise prescribed by a physician result in increased physical activity
among older adults? Journal of Aging and Health, 13:527-538. [DOI:
10.1177/089826430101300405]
Elizabeth, L.R., & Robert W. M. (1979). Exercise Prescription: A Clinical Trial. Am. J.Public
Health, 69, 591-595.
Swinburn, B. A., Walter, L. G., Arroll, B., Tilyard, M. W., & Russell, D. G. (1998). The Green Prescription Study: A randomised controlled trial of written exercise advice provided by general practitioners. American Journal of Public Health, 88, 288-291. [DOI: 10.2105/AJPH.88.2.288]
Sørensen, J., Kragstrup, T., Skovgaard, L., Puggaard. (2008). Exercise on prescription: a randomised study on the effect of counselling vs counselling and supervised
exercise. Scand J Med Sci Sports, 18, 288-297. [DOI: 10.1111/j.1600-0838.2008.00811.x]
Taylor, A. H. & Fox, K. R. (2005). Effectiveness of a Primary Care Exercise Referral
Intervention for Changing Physical Self-Perceptions Over 9 Months. Health
A. References to studies
a. Included studies
Aittasalo, Miilunpalo, Harjula & Pasanen (2006)
Aittasalo, M., Seppo, M., Katriina, K., Matti P. (2006). A randomised intervention of
physical activity promotion and patient self-monitoring in primary health care. Preventive
Medicine, (42), 40-46.
Atay, Torman & Yaman (2014)
Emrah A., Naciye, F.T., Hakan, Y. (2014). Exercise Prescription by Primary Care doctors: Effect on Physical Activity level and Functional Abilities in Elderly. Turkish Journal of Geriatrics, 17(1), 77-85.
Elley et al. (2003)
Elley, C., Kerse, N., Arroll, B., & Robinson, E. (2003). Effectiveness of counselling patients on physical activity in general practice: cluster randomised controlled trial. British
Medical Journal, (326), 793-799. [DOI: 10.1136/bmj.326.7393.793]
Fortier et al. (2011)
Michelle S. F., William H., Tracey L., O’Sullivan, C. B., Ronald J. S., Robert D. R., Pierre,
B., Éric D., Étienne B., Julie, B., and Diane, C. (2011). Impact of integrating a physical activity counsellor into the primary health care team: physical activity and health
outcomes of the Physical Activity Counselling randomised controlled trial. Appl. Physiol.
Nutr, 36.
Goldstein et al. (1999)
Goldstein, M. G., Pinto, B. M., Marcus, B. H., Lynn, H., Jette, A. M., Rakowski, W., ... Tennstedt, S. (1999). Physician-based physical activity counselling for middle-aged and
older adults: A randomized trial. Annals of Behavioral Medicine, (21), 40-47. [DOI:
10.1007/BF02895032]
Grandes et al. (2009)
Grandes, G., Sanchez, A., Sanchez-Pinilla, R. O., Ortega, R., Torcal, J., Montoya, I., ... Serra, J. (2009). Effectiveness of physical activity advice and prescription by physicians in
routine primary care. A cluster randomized trial. Archives of Internal Medicine, 169(7),
694-701. [DOI: 10.1001/archinternmed.2009.23]
Grandes et al. (2011)