ISSN: 2501 - 1235 ISSN-L: 2501 - 1235
Available on-line at: www.oapub.org/edu
doi: 10.5281/zenodo.3889044 Volume 6 │ Issue 4 │ 2020
A CROSS-SECTIONAL INVESTIGATION OF SLEEP HABITS
AND SELECTED BODY COMPOSITION PARAMETERS
AMONG UNIVERSITY STUDENTS
Mohammed Feroz Ali1,
Mohammad Ahsan2,
Prasanna B. K.3i
1Department of Physical Education, Fiji National University, Fiji, Research scholar, Mangalore University, Karnataka, India 2Assistant Professor, Dr., Department of Physical Therapy, College of Applied Medical Sciences, Imam Abdulrahman Bin Faisal University,
Dammam, KSA 3Assistant Director, Dr., Department of Physical Education and Sports,
Mangalore University, Karnataka, India
Abstract:
The study's objective was to compare sleep quality and selected body composition parameters between male and female participants. A cross-sectional study was conducted with five hundred participants (male and female) from different community places. Body composition parameters were measured with the help of a bioelectric impedance device. The sleep habits were determined with the Pittsburgh Sleeps Quality Index that used to evaluate sleep quality over a one-month time interval, and the Epworth Sleepiness Scale (Johns, 1991) was used to measure the level of the daytime sleepiness. The identified variables were statistically analyzed with an independent t-test, and Eta Squared was applied to find effect size. From the whole study population, only 12.2 % of participants are underweight, 51.4 % are healthy, 16.6 % are overweight, and 19.8 % are obese. Pittsburgh Sleep Quality Index is the lowest (7.90 ± 2.18) into the normal, whereas the highest (8.38 ± 2.93) into the underweight participants. Daytime sleepiness is lowest (10.23 ± 4.18) in underweight, whereas the highest (11.28 ± 3.28) in
obese participants. This study demonstrates females had a higher percentage of body fat than males throughout all categories that lead them towards poor sleep habits, which are mediating factors for good health and quality of life.
Keywords: sleep habits, sleep quality, sleepiness, body mass index, university students
1. Introduction
Sleep is a crucial factor in optimum health. During sleep, our body can rest and stock up for the next few days. Sleep is an excellent indicator of health status in both the general population and also for people with associated diseases [1]. Quality of Sleep is not only useful as a determinant of health but also an essential component of good quality of life [2]. American young adults enhanced the incidence from 15.6% in 1960 to 43% in 2009 for those who sleep less than 7 hours/day (National Sleep Foundation of America).
Furthermore, poor sleep habits lead to social, economic, and health problems. Some of the problems which are faced by lack of sleep are vascular problems, cerebrovascular diseases, development of neurodegenerative, and obesity. American adults reported around 27.5% to 29, 1% short sleep duration [3]. Various studies have examined relationships between sleep and obesity risk in the adult [4].
Noticeable body composition differences have been reported between male and female candidates around the world apart from their ethnicity, region, religion, culture, environment, lifestyle, age, and body size. Females comparatively have a higher percentage (25%) of body fat than males (15%), and males tend to have a higher percentage (43%) of muscle mass than females (36%) [5]. Male is having greater lean mass and a more central fat pattern, whereas females tend to have peripheral fat distribution, which defined as fat deposited in limbs and hips, particularly into the lower body [6].
duration mostly used BMI or weight gain as outcomes, and limited research measured body fat or abdominal obesity [13, 14]. Mahfouz et al., [15] conducted a cross-sectional study in Saudi Arabia revealed that female university students have poor sleep quality (69.1%) as they slept a mean of 4.77 hours/night. Epidemiological studies had shown a contrary correlation between body mass index (BMI) and sleep duration [16]. Sleep medicine in Saudi Arabia emphasizing that there is much demand for more sleep research to address the prevalence of various sleep disorders amongst the Saudi population related to the lifestyle and body composition [17].
Male and female are not only diverging in height but also body composition and sleep habits. Research findings regarding gender differences have been inconsistent. Therefore, this study set up to establish whether differences existed in body composition and sleeps habits between male and female participants. We also hypothesized that sleep and body compositions are comparative significant with both genders.
2. Methods
2.1 Design
We conducted a cross-sectional study of five hundred participants. Approval to undertake this study was obtained from the Institutional Review Board (IRB) from the deanship of research of the university, All participants participated in this study voluntarily, and the researchers received consent from the participants before the start of the investigation.
2.2 Participants
The data were collected from 500 males (n=250) and female (n=250) from different community centers as shopping malls, parks, playgrounds, and hospitals. The participants were selected by convenience sampling during 2017-2018. The selected participants were classified into underweight, normal, overweight, and obese categories, according to their Body Mass Index. The exclusion criteria for this study were to include those individuals who were suffering from physical or mental disabilities, cardiac problems, or any chronic illness.
2.3 Anthropometric Measurement
Researchers were responsible for the collection of anthropometric measurements of every participant. Anthropometric data, according to the gender, are available in the below Table 1.
Table 1: Anthropometric measurement of participants
S.No. Anthropometrics Total Subjects
(N=500)
Males (N=250)
Females (N=250)
2.4 Measuring Instruments
Weighing Scale: Portable electronic calibrated weight scale (Detecto Scale – model 750, U.S.A.) was used for height and weight measurement.
2.5 Bioelectric Impedance (BIA)
Body compositions were calculated with the help of a bioelectric impedance device [18]. The body composition assessment followed the manufactory's instruction of the bioelectrical analysis (BIA) (i0i 253, Jawon Medical, S. Koria). The parameters were determined are Body Mass Index (BMI), Percentage of Body Fat (PBF), Lean Body mass (LBM), Mass of Body Fat (MBF), Soft Lean Mass (SLM), and Total Body Water (TWB). Body composition was assessed at healthy body hydration (dehydration) in similar external temperature (22–24°C) [19]. The bioelectrical impedance used method shows a
high correlation (R = 0.88) with dual X-ray absorptiometry [20].
2.6 The Pittsburgh Sleeps Quality Index (PSQI)
A self-reported questionnaire PSQI was used to evaluate sleep quality during the past thirty days. Component scores range from 0 (no difficulty) to 3 (severe difficulty) and, when summed, generate a sum score ranging from 0 to 21. Scores > 5 indicate significant disturbance. Excellent psychometric properties have been established [21]. The Cronbach alpha for the PSQI has been previously reported as 0.83 [22], which is identical to the value reported in the original validation study [21].
2.7 Epworth Sleepiness Scale (ESS)
The ESS [23] is a self-reported measure designed to estimate the level of the daytime sleepiness in recent times. The measure consists of eight items on a four-point Likert scale on which respondents rate their response regarding the chance of dozing in each situation, from 0 (would never) to 3 (high chance). Total scores range from 0 to 24, with higher scores represent greater sleepiness. Scores over 10 suggest significant daytime sleepiness, and scores over 15 suggest pathological sleepiness associated with conditions like sleep-related breathing disorders or narcolepsy.
2.8 Procedure
participant asked to grip hold electrodes and press the button attached with hand-hold electrodes. The participants do not move or talk during the measurement going on. Within 2-3 minutes, the results' printout given by the device.
2.9 Statistical Analysis
The identified variables were statistically analyzed for the proper evaluation of characteristics related to both genders. Descriptive statistics as mean, standard deviation (SD), and percentage were calculated for participants' age, weight, height, and BMI. For the comparative analysis between both genders as per underweight, normal and overweight, and obese category independent t-test was applied. To find the effect of another independent variable into the same group, Eta Squared was also applied. A
p-value ≤ 0.05 was taken as statistically significant. The Statistical Package for Social
Sciences Version 20 for Windows (SPSS Inc., Chicago, IL, USA) was used to analyze the data.
3.Results
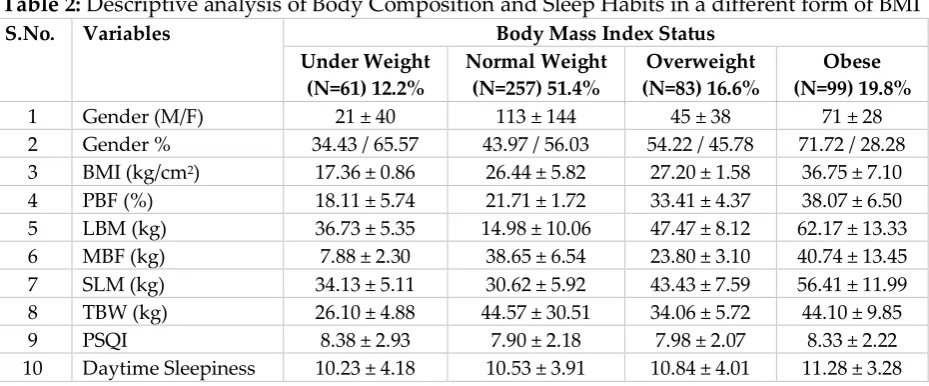
Table 2: Descriptive analysis of Body Composition and Sleep Habits in a different form of BMI
S.No. Variables Body Mass Index Status
Under Weight (N=61) 12.2%
Normal Weight (N=257) 51.4%
Overweight (N=83) 16.6%
Obese (N=99) 19.8%
1 Gender (M/F) 21 ± 40 113 ± 144 45 ± 38 71 ± 28 2 Gender % 34.43 / 65.57 43.97 / 56.03 54.22 / 45.78 71.72 / 28.28 3 BMI (kg/cm2) 17.36 ± 0.86 26.44 ± 5.82 27.20 ± 1.58 36.75 ± 7.10 4 PBF (%) 18.11 ± 5.74 21.71 ± 1.72 33.41 ± 4.37 38.07 ± 6.50 5 LBM (kg) 36.73 ± 5.35 14.98 ± 10.06 47.47 ± 8.12 62.17 ± 13.33 6 MBF (kg) 7.88 ± 2.30 38.65 ± 6.54 23.80 ± 3.10 40.74 ± 13.45 7 SLM (kg) 34.13 ± 5.11 30.62 ± 5.92 43.43 ± 7.59 56.41 ± 11.99 8 TBW (kg) 26.10 ± 4.88 44.57 ± 30.51 34.06 ± 5.72 44.10 ± 9.85 9 PSQI 8.38 ± 2.93 7.90 ± 2.18 7.98 ± 2.07 8.33 ± 2.22 10 Daytime Sleepiness 10.23 ± 4.18 10.53 ± 3.91 10.84 ± 4.01 11.28 ± 3.28
participants. Total Body Water (TBW) is highest (44.57 ± 30.51) in normal and lowest (26.10 ± 4.88) into the underweight participants. Pittsburgh Sleep Quality Index (PSQI) is the lowest (7.90 ± 2.18) into the normal, whereas the highest (8.38 ± 2.93) into the underweight participants. Daytime sleepiness is lowest (10.23 ± 4.18) in underweight, whereas the highest (11.28 ± 3.28) in obese participants.
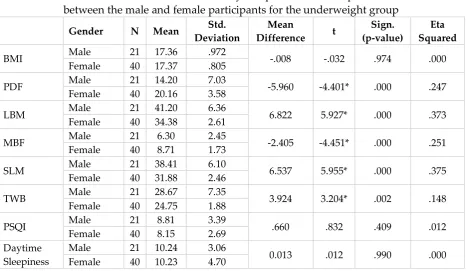
Table 3: Mean differences in body composition and sleep habits between the male and female participants for the underweight group
Gender N Mean Std.
Deviation
Mean
Difference t
Sign. (p-value)
Eta Squared
BMI Male 21 17.36 .972 -.008 -.032 .974 .000
Female 40 17.37 .805
PDF Male 21 14.20 7.03 -5.960 -4.401* .000 .247 Female 40 20.16 3.58
LBM Male 21 41.20 6.36 6.822 5.927* .000 .373
Female 40 34.38 2.61
MBF Male 21 6.30 2.45 -2.405 -4.451* .000 .251
Female 40 8.71 1.73
SLM Male 21 38.41 6.10 6.537 5.955* .000 .375
Female 40 31.88 2.46
TWB Male 21 28.67 7.35 3.924 3.204* .002 .148
Female 40 24.75 1.88
PSQI Male 21 8.81 3.39 .660 .832 .409 .012
Female 40 8.15 2.69 Daytime
Sleepiness
Male 21 10.24 3.06
0.013 .012 .990 .000 Female 40 10.23 4.70
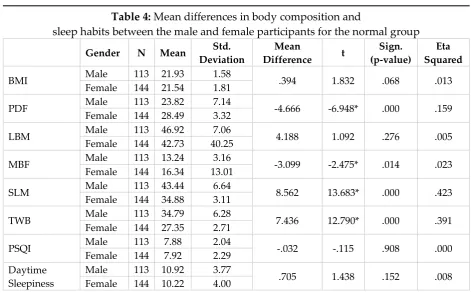
Table 4: Mean differences in body composition and
sleep habits between the male and female participants for the normal group
Gender N Mean Std.
Deviation
Mean
Difference t
Sign. (p-value)
Eta Squared
BMI Male 113 21.93 1.58 .394 1.832 .068 .013
Female 144 21.54 1.81
PDF Male 113 23.82 7.14 -4.666 -6.948* .000 .159 Female 144 28.49 3.32
LBM Male 113 46.92 7.06 4.188 1.092 .276 .005
Female 144 42.73 40.25
MBF Male 113 13.24 3.16 -3.099 -2.475* .014 .023 Female 144 16.34 13.01
SLM Male 113 43.44 6.64 8.562 13.683* .000 .423 Female 144 34.88 3.11
TWB Male 113 34.79 6.28 7.436 12.790* .000 .391 Female 144 27.35 2.71
PSQI Male 113 7.88 2.04 -.032 -.115 .908 .000
Female 144 7.92 2.29 Daytime
Sleepiness
Male 113 10.92 3.77
.705 1.438 .152 .008 Female 144 10.22 4.00
For the results independent sample t-test was conducted to compare the score for male and female participants. There was a significant difference in the PBF and MBF scores for male participants (M=23.82±7.14 and 13.24±3.16) and female participants (M=28.49±3.32 and 16.34±13.01, t(155) = -6.95 and -2.48, p <0.05). The magnitude in the differences between the means (MD = -4.67 and -3.10, 95% CI) was lower (eta squared = .159 and 0.23). This implies that female participants have significantly higher PBF and MBF than male participants. Significant differences were further found in the SLM and TBW score for the male participants (M= 43.44±6.64, and 34.79±6.28) and for female participants (M= 34.88±3.11, and 27.35±2.17, t(155)= 13.68 and 12.79, p < 0.05 respectively).
The magnitude in the differences between the mean (MD=17.79, 8.56, and 7.44, 95% CI) was greater (eta squared = .423 and .391). This implies that male participants have a higher significant difference than female participants, whereas no significant differences were found among male and female participants for the BMI, LMB, PSQI, and Daytime sleepiness as in the normal group.
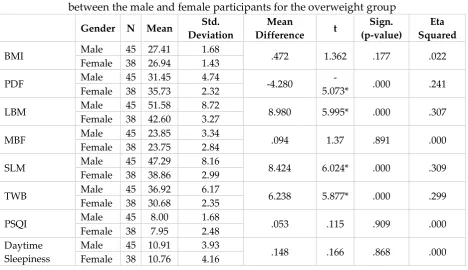
found in the LBM, SLM and TBW score for the male participants (M=51.58±8.72, 47.29±8.16, and 36.92±6.17) and for female participants (M=42.60±3.27, 38.86±2.99, and 30.685±2.35, t(81)= 6.00, 6.02, and 5.88, p < 0.05 respectively).
Table 5: Mean differences in body composition and sleep habits between the male and female participants for the overweight group
Gender N Mean Std.
Deviation
Mean
Difference t
Sign. (p-value)
Eta Squared
BMI Male 45 27.41 1.68 .472 1.362 .177 .022
Female 38 26.94 1.43
PDF Male 45 31.45 4.74 -4.280
-5.073* .000 .241 Female 38 35.73 2.32
LBM Male 45 51.58 8.72 8.980 5.995* .000 .307
Female 38 42.60 3.27
MBF Male 45 23.85 3.34 .094 1.37 .891 .000
Female 38 23.75 2.84
SLM Male 45 47.29 8.16 8.424 6.024* .000 .309
Female 38 38.86 2.99
TWB Male 45 36.92 6.17 6.238 5.877* .000 .299
Female 38 30.68 2.35
PSQI Male 45 8.00 1.68 .053 .115 .909 .000
Female 38 7.95 2.48 Daytime
Sleepiness
Male 45 10.91 3.93
.148 .166 .868 .000 Female 38 10.76 4.16
The magnitude in the differences between the mean (MD=8.98, 8.42, and 6.24, 95% CI) was greater (eta squared = .307, .309 and .2.99). This implies that male participants have a higher significant difference than female participants, whereas no significant differences were established between male and female participants for the BMI, MBF, PSQI, and Daytime sleepiness as in the overweight group.
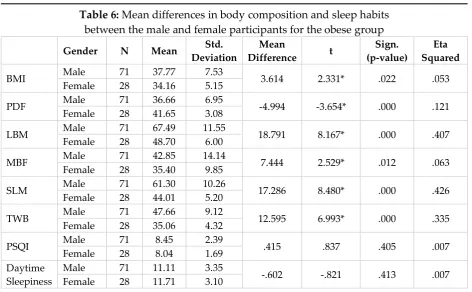
Table 6: Mean differences in body composition and sleep habits between the male and female participants for the obese group
Gender N Mean Std.
Deviation
Mean
Difference t
Sign. (p-value)
Eta Squared
BMI Male 71 37.77 7.53 3.614 2.331* .022 .053
Female 28 34.16 5.15
PDF Male 71 36.66 6.95 -4.994 -3.654* .000 .121 Female 28 41.65 3.08
LBM Male 71 67.49 11.55 18.791 8.167* .000 .407 Female 28 48.70 6.00
MBF Male 71 42.85 14.14 7.444 2.529* .012 .063
Female 28 35.40 9.85
SLM Male 71 61.30 10.26 17.286 8.480* .000 .426 Female 28 44.01 5.20
TWB Male 71 47.66 9.12 12.595 6.993* .000 .335
Female 28 35.06 4.32
PSQI Male 71 8.45 2.39 .415 .837 .405 .007
Female 28 8.04 1.69 Daytime
Sleepiness
Male 71 11.11 3.35
-.602 -.821 .413 .007 Female 28 11.71 3.10
The magnitude in the differences between the mean (MD=3.61, 7.44, 17.29, and 12.60, 95% CI) was higher (eta squared = .053, .407, .426, and .335). This implies that male participants have a higher significant difference than female participants, whereas no significant differences were found between male and female participants for the PSQI and Daytime sleepiness as in categories obese group.
4. Discussion
The purpose of the present research was to compare body composition and sleep quality between both genders. The findings of this research show that the Percentage of Body Fat (PBF) is higher in obese and lowest in the underweight participants. The Lean Body Mass (LBM) is lowest in the normal and highest in the obese participants. The Mass of Body Fat (MBF) is highest in the obese and lowest in the underweight participants. Soft Lean Mass (SLM) is the highest in obese and lowest in the normal participants. Total Body Water (TBW) is highest in normal and lowest into the underweight participants. Pittsburg Sleep Quality Index (PSQI) is lowest into the normal, whereas the highest of the underweight participants.
areas (Al-Khobar, Jeddah, and Riyadh), they indicate that prevalence of obesity equal 24% and 14% and overweight equals 19.5% and 20.8% in male and female respectively. In England and Spain, adult men reported being more overweight than women [26, 27]. Oh, et al. [28] examine a study with 775 females and 658 males into Korea and finds high prevalence of obesity in females (31.3%) compared to males (19.6). Reports of the study conducted by Unnithan and Syamakumari [29] among adolescents, has warned an increasing trend in the percentage of overweight in adolescent males compared to that of females. Observations of Bouchard and Peter [30] regarding gender on the global prevalence of obesity showed that in most of the countries, a more significant proportion of females are obese than males, whereas there is a higher proportion of males who are overweight than female. In the present study also, there is a higher proportion of overweight males than females during this age ranged. This may be because males engage in sedentary work and mostly busy with the latest electronic gadget and dependence on mechanized transportation which bereave them of their opportunities for physical activity.
Analyzing the difference between body composition and sleep suggests that the female participants showed higher PBF, MBF, and PSQI than male participants. An observation was reported by Arroyo et al. [31] (2004). The percentage of body fat was found to increase considerably during late adulthood, and females had a higher percentage of body fat than males throughout all age groups. According to the reports of a study done by Meeuwsen et al. [32], body fat and percent fat are higher in female than male and age were positively related with body fat percent in both genders. Gibson [33] states that, on average, the fat content of women is higher than that of men representing 26.9 percent of the total body weight compared with 14.7 percent for men. Kesavachandran et al. (2009) stated that even though physical activity alone cannot maintain BMI and percentage of body fat, it can reduce the risk of overweight and high body fat percent in the population. The same trend has been observed in the present study also. Meeuwsen et al. [34] state that increases in the percentage of body fat with age is predominantly due to a steady increase in fat mass and a smaller reduction in lean mass (fat-free mass). Knutson and Lauderdale [35] had reported that the odds ratio for overweight in adolescents using time-diary sleep times was not significantly affected by sleep duration.
modern society, a low level of physical activity combined with changes in eating habits is the main reason for the prevalence of overweight or obesity. The National Health and Nutrition Examination Survey (NHANES) data, the difference between male and female also found in the association between sleep duration and BMI, with the female being progressively more likely to be obese as sleep duration was reduced below 7 hours per night, whereas male was more likely to be obese with six or fewer hours of sleep per night. Conversely, there is a negative correlation between body fat, body mass, and sleep duration in a study [37]. Carter, III & Wetenpaugh, [38]; Lytle et al., [39] and Turco et al., [40] studies acknowledged the presence of a notable difference between genders related to sleep quality. It indicated that both genders had disturbed sleep behaviors with shorter sleeping hours per day, even they tend to take a nap. A study revealed lower fat in males and females who reported sleep 7-8 hours per night compared to those show-up 5-6 hours of sleep per night [41]. Ganswisch et al. [42] have stated that BMI was lower in male and female who slept more than 7 hours per night compared to those slept 7 hours or less only in individual age ranged 32-49. Rontoyanni1 [43] reported in his research a negative correlation between sleep duration and fat percentage in the healthy female, supporting the Idea that sleep duration is significantly associated with body fat. Daytime sleepiness is the lowest in underweight, whereas the highest in obese participants.
5. Conclusion
It is evident from the data presented in this study; females had a higher percentage of body fat than male throughout all categories that leads them towards poor sleep habits which are mediating factors for good health and quality of life to the community. More research needed to determine the degree of error introduced by biased sleep reporting into the association between body composition and sleep habits.
References
1. Miro, E. Cano-Lozano, C., & Buela-Casal, G. (2008). Dream and quality of life. Colombian Journal of Psychology, 14, 11-27.
2. Perez, S. D., Diaz, M. O., & Garrido, N. R. (2007). Prevalence of impaired sleep patterns among nursing students in Huelva. Global Nursing, 6 (2).
3. St-Onge M. P., Mikic A., Pietrolungo C. E. (2016). Effects of Diet on Sleep Quality. Advances in nutrition (Bethesda, Md).7(5):938-949.
4. Knutson K. L. (2012). Does inadequate sleep play a role in vulnerability to obesity? American journal of human biology: the official journal of the Human Biology Council; 24(3):361-371.
6. Couillard C., Bergeron N., Prud'homme D. (1999). Gender difference in postprandial lipemia: the importance of visceral adipose tissue accumulation. Arteriosclerosis, thrombosis, and vascular biology.19(10):2448-2455.
7. Galland B. C., Gray A. R., Penno J. (2017). Gender differences in sleep hygiene practices and sleep quality in New Zealand adolescents aged 15 to 17 years. Sleep Health, 3(2):77-83.
8. Zhang J., Chan N. Y., Lam S. P. (2016). Emergence of Sex Differences in Insomnia Symptoms in Adolescents: A Large-Scale School-Based Study. Sleep, 39(8):1563-1570.
9. Ohayon M. M., Zulley J. (2001). Correlates of global sleep dissatisfaction in the German population. Sleep. 24(7):780-787.
10. Bjorvatn B., Sagen I. M., Oyane N. (2007). The association between sleep duration, body mass index, and metabolic measures in the Hordaland Health Study. Journal of sleep research. 2007;16(1):66-76.
11. Bawazeer N. M., Al-Daghri N. M., Valsamakis G. (2009). Sleep duration and quality associated with obesity among Arab children. Obesity (Silver Spring, Md).17(12):2251-2253.
12. Al-Hazzaa H. M., Musaiger A. O., Abahussain N. A. (2012). Prevalence of short sleep duration and its association with obesity among adolescents 15- to 19-year olds: A cross-sectional study from three major cities in Saudi Arabia. Annals of thoracic medicine. 7(3):133-139.
13. Magee C. A., Iverson D. C., Huang X. F. (2008). A link between chronic sleep restriction and obesity: methodological considerations. Public health.122(12):1373-1381.
14. Theorell-Haglow J., Berglund L., Janson C. (2012). Sleep duration and central obesity in women - differences between short sleepers and long sleepers. Sleep medicine. 2012;13(8):1079-1085.
15. Mahfouz M. (2013). Sleep Quality among Students of the Faculty of Medicine in Jazan University, Saudi Arabia Middle-East Journal of Science and research, 16: 508-513.
16. Hursel R., Gonnissen H. K., Rutters F. (2013). Disadvantageous shift in the energy balance is primarily expressed in high-quality sleepers after a decline in quality of sleep because of disturbance. The American journal of clinical nutrition. 98(2):367-373.
17. Bahammam A. S. (2011). Sleep medicine in Saudi Arabia: Current problems and future challenges. Annals of thoracic medicine. 6(1):3-10.
18. Lukaski H. C., Johnson P. E, Bolonchuk W. W. (1985). Assessment of fat-free mass using bioelectrical impedance measurements of the human body. The American journal of clinical nutrition. 41(4):810-817.
20. Sun G., French C. R., Martin G. R. (2005). Comparison of multifrequency bioelectrical impedance analysis with dual-energy X-ray absorptiometry for assessment of percentage body fat in a large, healthy population. The American journal of clinical nutrition. 81(1):74-78.
21. Buysse D. J., Reynolds C. F., 3rd, Monk T. H. (1989). The Pittsburgh Sleep Quality Index: a new instrument for psychiatric practice and research. Psychiatry Research; 28(2):193-213.
22. Taylor D. J., Bramoweth A. D., Grieser E. A. (2013). Epidemiology of insomnia in college students: relationship with mental health, quality of life, and substance use difficulties. Behavior therapy.44(3):339-348.
23. Johns M. W. (1991). A new method for measuring daytime sleepiness: the Epworth sleepiness scale. Sleep.14(6):540-545.
24. Ahmed H. G., Ginawi I. A., Elasbali A. M. (2014). Prevalence of obesity in the Hail region, KSA: in a comprehensive survey. Journal of obesity. 14:1-5.
25. Al-Hazzaa H. M., Abahussain N. A., Al-Sobayel H. I. (2014). Prevalence of overweight, obesity, and abdominal obesity among urban Saudi adolescents: gender and regional variations. Journal of health, population, and nutrition; 32(4):634-645.
26. Rodriguez-Martin A., Novalbos Ruiz J. P., Martinez Nieto J. M. (2009). Lifestyle factors associated with overweight and obesity among Spanish adults. Nutrition hospitalaria;24(2):144-151.
27. NOO (2010). National Obesity Observatory. Causes of obesity, solutions for public
health, Obesity Learning Center,
http://www.noo.org.uk/NOO_about_obesity/causes.
28. Oh C., Jho S., No J. K. (2015). Body composition changes were related to nutrient intakes in older men, but older women had a higher prevalence of sarcopenic obesity in a population of Korean adults. Nutrition research (New York, NY);35(1):1-6.
29. Unnithan A. G., Syamakumari S. (2007). Prevalence of Overweight, Obesity, and Underweight among School Going Children in Rural and Urban areas of Thiruvananthapuram Educational District, Kerala State (India). International Journal of Nature and Wellness. 6: https://print.ispub.com/api/0/ispub-article/7073.
30. Bouchard C. and Peter T. K. (2010). Physical activity and obesity, II edition, Library of Congress cataloging 50- 51.
31. Arroyo M., Rocandio A. M., Ansotegui L. (2004). Comparison of predicted body fat percentage from anthropometric methods and impedance in university students. The British journal of nutrition; 92(5):827-832.
33. Gibson RS. (2005). Principles of Nutritional Assessment. New York: II Edition; Oxford University Press; 7: 292-293.
34. Kesavachandran C., Bihari V., Mathur N. (2009). Can physical activity maintain normal grades of body mass index and body fat percentage? International journal of yoga. 2(1):26-29.
35. Knutson K. L., Lauderdale D. S. (2007). Sleep duration and overweight in adolescents: self-reported sleep hours versus time diaries. Pediatrics.;119(5): e1056-1062.
36. Altair H., Bahammam A. (2008). Gender differences in Saudi patients with obstructive sleep apnea. Sleep & breathing Schlaf & Atmung. 12(4):323-329. 37. Stranges S., Cappuccio F. P., Kandala N. B. (2008). Cross-sectional versus
prospective associations of sleep duration with changes in relative weight and body fat distribution: the Whitehall II Study. American journal of epidemiology.;167(3):321-329.
38. Carter R., 3rd, Watenpaugh D. E. (2008). Obesity and obstructive sleep apnea: or is it OSA and obesity? Pathophysiology: the official journal of the International Society for Pathophysiology. 15(2):71-77.
39. Lytle L. A., Pasch K. E., Farbakhsh K. (2011). The relationship between sleep and weight in a sample of adolescents. Obesity (Silver Spring, Md). 19(2):324-331. 40. Turco G., Bobbio T., Reimao R. (2013). Quality of life and sleep in obese
adolescents. Arquivos de neuro-psiquiatria. 71(2):78-82.
41. Chaput J. P., Brunet M., Tremblay A. (2006). Relationship between short sleeping hours and childhood overweight/obesity: results from the 'Quebec en Forme' Project. International journal of obesity, 30(7):1080-1085.
42. Gangwisch J. E., Malaspina D., Boden-Albala B. (2005). Inadequate sleep as a risk factor for obesity: analyses of the NHANES I. Sleep; 28(10):1289-1296.
Creative Commons licensing terms