Distributed CA-CFAR and OS-CFAR
Detectors Mentored by Biogeography Based
Optimization Tool
Amel Gouri, Amar Mezache and Houcine Oudira
Abstract— In this paper, distributed constant false alarm rate (CFAR) detection in homogeneous and heterogeneous Gaussian clutter using Biogeography Based Optimization (BBO) method is analyzed. For independent and dependent signals with known and unknown power, optimal thresholds of local detectors are computed simultaneously according to a preselected fusion rule. Based on the Neyman-Pearson type test, CFAR detection comparisons obtained by the genetic algorithm (GA) and the BBO tool are conducted. Simulation results show that this new scheme in some cases performs better than the GA method described in the open literature in terms of achieving fixed probabilities of false alarm and higher probabilities of detection.
Index Terms— BBO, distributed CFAR detection, CA
-CFAR, OS--CFAR, fusion rule.
I. INTRODUCTION
n an automatic radar detection system, range resolution cells are used to estimate the background level and a threshold is then formed to test for the presence of a target in the cell under test (CUT). Centralized CFAR detectors operating in homogeneous and heterogeneous clutter are initially developed in terms of different test statistics. For instance, the cell averaging CFAR (CA-CFAR), the maximum likelihood CFAR (ML-(CA-CFAR), the logt-CFAR and the geometric mean CFAR (GM-CFAR) algorithms are all suited when the clutter is independent and identically distributed (iid) in the reference window [1-4]. In the realistic case when interfering targets and clutter edge situations are present, CFAR procedures based on the censoring of cells resolution contents like the order statistic CFAR (OS-CFAR), censored mean level CFAR (CMLD-CFAR), censored maximum likelihood CFAR (CML-CFAR) and Weber-Hykin CFAR (WH-CFAR) are proposed to maximize the detection probability [1].
Amel Gouri is with the Département d’Electronique, Université Mohamed Boudiaf-M’sila, Laboratoire Analyse des Signaux et des Systèmes, LASS, 28000 M’sila, Algérie ([email protected])
Amar mezache is with Département d’Electronique, Université Mohamed Boudiaf-M’sila, Laboratoire SISCOM, Université de Constantine ([email protected])
Houcine Oudira is with Département d’Electronique, Université Mohamed Boudiaf-M’sila, 28000 M’sila, Algérie. Laboratoire de Génie Electrique (LGE) ([email protected]).
Another way to increase the detection performance of targets is to use multi-static radars (sensors) which are distributed geographically [2-5]. In this system, all CFAR detectors are executed together and local decisions are then made. Form these binary declarations, a fusion rule must be applied at the fusion center to get the global binary decision. Compared to CFAR detectors decentralized
standard CFAR detectors,
require the optimization of unknown parameters (i.e., thresholds multipliers, ti and ranked cells orders, Ki) in the
expressions of the overall false alarm and detection probabilities. In this context, Blum and Qiao [3] applied OS-CFAR detection techniques to a distributed detection system with dependent observations from sensor to sensor under the assumption of weak signals. The best thresholds were given for schemes employing either an “AND” or “OR” fusion rule for specific cases. In all of the cases, the “OR” fusion rule provided better performance than the “AND” fusion rule for false alarm probabilities larger than some critical value. In [6], the performance of multi-static radar system for both CA-CFAR and OS-CFAR for homogeneous and heterogeneous backgrounds by using the GA is also investigated. For independent signals with known power, the trends of the probability of detection Pd and the optimum
rank K in the fusion center are presented. With respect to other parameters like ti , Ci, and Ki, the trends seem still not
very clear because of the sensitive property of the performance. For dependent signals with unknown power, the obtained results show that better results can be found with the GA approach.
to
In this work, we attempt improve the detection performance of decentralized CA-CFAR and OS-CFAR detectors in presence of Gaussian clutter presented in [6]. To this effect, the BBO algorithm which is constructed principally by immigration and emigration operators is used to find optimal values of local thresholds. Based on the Neyman-Pearson type test, CFAR detection comparisons test, obtained by the GA and the BBO tools are presented. Simulation results show that this new scheme in some cases performs better than the GA method described in the literature in terms of achieving lower probabilities of false alarm and higher probabilities of detection.
of the distributed CA-CFAR and OS-CFAR systems using “AND” and “OR” fusion rules. Section 4 illustrates a series of Swerling 1 target CFAR detection comparisons using GA and BBO tools. Finally, Section 5 reports some concluding remarks.
II. DISTRIBUTED CA-CFAR AND OS-CFAR DETECTORS
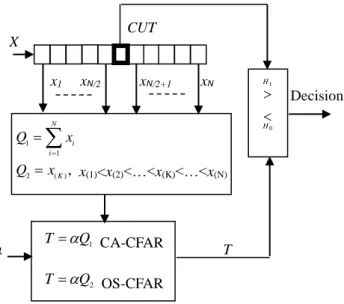
Recall that at the output of square law detector, centralized CA-CFAR and OS-CFAR detectors are suited for homogeneous and heterogeneous background respectively (see Fig. 1). The scale factor controls the desired value of the false alarm probability and a target is declared when the clutter intensity in the cell under test (CUT) exceeds the adaptive detection threshold T. A set of the data in the reference window x1, x2, …, xN are used for real time
estimates of the clutter power, Q.
Fig. 1.Centralized CA-CFAR and OS-CFAR detectors in presence of Gaussian clutter
Expression of Q in terms of recorded data is highly dependent on the situation of the clutter background. In Gaussian noise case and according to the two hypotheses
H1 (Target signal plus Gaussian noise) and H0 (Gaussian
noise only), corresponding probability density functions (pdfs) of the CUT are given by
+ − + = − = a b x a b H x p H b x b H x p H X X exp 1 ) ( : exp 1 ) ( : 1 1 0 0 (1)
where b and a are respectively the intensities of the clutter and the target of interest. From [1], calculation of the false alarm probability Pf and the detection probability Pd for
CA-CFAR detection is given by
− + − = − =
− − 0 1 0 1 exp ) ( . ) 1 ( exp exp ) ( . b q -exp dq b q N b q SNR b q P dq b q N b q P M M d M M f (2)Integrals of (2) are resolved to yield compact expressions of Pf and Pd as
(
)
+ + = + = − − N d N f SNR P P 1 1 1 (3)Similarly, Pf and Pd of OS-CFAR detector are computed
using the following integrals
− − − + − = − − − =
−+ − −+ − 0 1 1 0 1 1 exp 1 exp ) 1 ( exp exp 1 exp b q -exp dq b q b q K N b K SNR b q P dq b q b q K N b k P k k M d k k M f (4)Integrals of (4) are calculated to be
+ + + + + + − − = + + + + − − = )) 1 /( 1 ( )) 1 /( 1 ( )! ( ! ) 1 ( ) 1 ( )! ( ! SNR N SNR K N K N N P N K N K N N P d f (5)
From the past two decades, distributed signal detection schemes have received significant attention, but usually under the assumption of stationary observations which are independent from sensor to sensor [4, 6]. The parallel structure of distributed CFAR detection is highlighted in Fig. 2. Each local CFAR detector provides its binary decision and then transmits it to the fusion center. The n received decisions are then combined to yield a global decision according to “AND”, “OR” or “k” out of
“n“fusion rule.
Fig. 2. Distributed CFAR processor system.
In the presence of Gaussian background, two situations can be occurred for decentralized CFAR detection [4, 6]; independent signals with known power and non stationary observations where the signal observations are assumed to be dependent from sensor to sensor. In the following section, we give explicit formulas of the total false alarm and detection probabilities when “AND” and “OR” fusion rules are taken into account in the fusion center.
A. Independent signals with known power
Supposing that we have n detectors, the data fusion center determines the presence of a target in the cell under test (CUT) if at least k detectors have made the same decision. For n receivers this represents all the possible
CFAR 1 CFAR 2 CFAR n
Environment
Fusion rule selection at the fusion center
D1 D2 Dn
D Decision
1
Q
T=
CA-CFAR2
Q
T=
OS-CFARx1 xN/2 xN/2+1 xN
α T
CUT
2 ( ),
1 1 K N i i x Q x Q = =
=x(1)<x(2)<…<x(K)<…<x(N)
cases between the rule “OR” (k =1) and the “AND” rule (k=n). We assume an environmental interference with a Gaussian probability density function (pdf) for the in-phase and quadrature components, and targets having a similar pdf with a slow fluctuation (Swerling I model). The following false alarm rate probability, Pf and detection
probability, Pd for distributed CA-CFAR detector in
homogeneous background are given in [6].
(i) “AND” fusion rule:
In this case, Pf and Pd hold the following formulas
= = − n i i N i i i d n i i N i f t + S + S + = P t + = P 1 1 1 1 ) (1 (6)where Ni, i=1, …, n is the total number of estimation cells
of the detector i, ti=Ci/Niis the scale factorand Si is the
SNR (signal-to-noise ratio).
(ii) “OR” fusion rule:
In this case, corresponding expressions of Pf and Pd are
(
)
− − − −
= = − n i i N i i i d n i i N i f t + S + S + = P t + = P 1 1 1 1 1 1 ) 1 ( 1 1 (7)For distributed OS-CFAR detection, the probabilities of false alarm and detection in heterogeneous background are also given in [6].
(iii) “AND” fusion rule:
For this situation, Pf and Pd are expressed as
− − − −
= − = = − = n i Ki L i i i i d n i KiL i i
i f S + 1 t + L N L N = P t + L N L N = P 1 1 0 1 1 0 (8)
where Kiis the ranked cell order at the detector i.
(iv) “OR” fusion rule:
Here, Pf and Pd are
− − − − − − − −
= − = = − = n i Ki L i i i i d n i KiL i i
i f S + 1 t + L N L N = P t + L N L N = P 1 1 0 1 1 0 1 1 1 1 (9)
B. Dependent signals with unknown power
In [4], the authors analyzed the case where the signal observations are assumed to be dependent from sensor to sensor and weak narrowband random signal are observed in additive Gaussian noise-plus-clutter of unknown power. Their results are very useful especially when it is difficult to get accurate estimation of the SNRs and in cases where
the SNRs are varying. Taking into account the “AND” and “OR” fusion rules, we use the formulations in [4]. In order to obtain the best performance of a given multi-static radar system, we can choose the thresholds t1. . . ., tn, to
maximize 2 "(0)
d P
subject to the false alarm constraint,Pf =0
(i) “AND” fusion rule:
For the “AND” rule, the equations of Pf and Pd"(0) are
given by
(
)
(
)
(
)
= − + = − − −
= − = n j K , N , t g = K , N , t g L t N t P P α = t + L N L N = P j j j n i KL i i
i f d n = i i K =
L i i
i f i ..., , 2 , 2 ) 0 ( 1 1 1 1 1 1 0 2 " 1 0 0
(10)
where
(
)
(
)
(
)
(
)
− − − − − 1 0 1 0 2 1 / K = L K =l N+t L N+t L
L N = K N, t, g .
(ii) “OR” fusion rule:
For the “OR” rule, the equations of Pf and Pd"(0) are given
by
(
)
(
)
(
)
(
)
(
)
= − + − − − + − − = − − − −
− = = − = − = − = − = n j K , N , t g = K , N , t g L t N t L N L t N L N P P α = t + L N L N = P j j j KiL i i
i n i Ki L i Ki L i i Ki L i f d n = i Ki
L i i
i f ..., , 2 , ) 1 ( ) 0 ( 1 1 1 1 1 1 0 1 1 0 1 0 1 0 2 " 1 0 1 0 (11)
If the number of local detectors is equal to 3, the “MAJORITY” fusion rule can be considered for which the
Pf and Pd are given by
− + + = − + + = 3 2 1 3 1 3 2 2 1 3 2 1 3 1 3 2 2 1 2 2 d d d d d d d d d d f f f f f f f f f f P P P P P P P P P P P P P P P P P P P P (12)
III OPTIMIZATION METHODS
To solve the above detection problem, we propose in this work a flexible approach using the BBO to give the global optimal results in different situations. Each chromosome is a vector of the parameters of Pd and Pf at
the fusion center. The lengths of the chromosomes for CA-CFAR and OS-CA-CFAR are n and 2n respectively, where n is the number of sensors in the defined multi-static radar system. To optimize the system parameters, GA and BBO tools are used to find specifically optimum thresholds multipliers. This involves the maximization of the overall
Pd while keeping the overall Pf constant. In the sense of the
known power, the fitness or objective function to be minimized by the BBO algorithm is [6].
0 2 11
) ,
(ti Ki =w −Pd +w Pf −
Fitness (13)
In the case of dependent signals with unknown power, a third term given in (5) and (6) is added in (8). Hence [6]
=
− +
− + −
=
n
i
i i i
f d
i i
K N t g K N t g w
P w P w K t Fitness
2
1 1 1 3
0 2 " 2 1
) , , ( ) , , (
) 0 ( 1 ) ,
(
(14)
1
w ,w2and w3are the weights parameters to adjust the convergence of the BBO.
A. Genetic algorithm method
Genetic algorithms are gradient free parallel-optimization algorithms that use a performance criterion for the evaluation and a population of possible solutions to search for a global optimum [2] [7-8]. The manipulation is done by the genetic operators that work on the chromosomes in which the parameters of possible solutions are encoded. In each generation of the GA, the new solutions replace the solutions in the population that are selected for deletion. In real-coded GA, the variables appear directly in the chromosome and they are modified by special genetic operators. In the following, r
0,1 is a random number (uniformly distributed), t=0, 1,...,Tis the generation number, svand sw are chromosomes selected for operation of the GA, k
1,2,...,N
is the position of anelement in the chromosome, and min k
v and max k
v are the lower and upper bounds, respectively , on the parameter encoded by element k. For crossover operator, the chromosomes are selected in pairs
(
sv,sw)
. The Whole arithmetic crossover, is a linear combination, is usually used. For the mutation operator, all elements of a chromosome are mutated by a Gaussian mutation for example. Then, the crossover and the mutation operators can produce solutions that violate the bounds. After these operations, the constraints are forced. The length of a chromosome is n and 2n for distributed CA-CFAR and OS-CFAR detectors respectively. The structure of each chromosome can be expressed as a vector of parameters shown as below.] ., . . , ,
[t1 t2 tn n
ChromosomeCA−CFAR = (15)
n n n
CFAR
OS t t t K K K
Chromosom − =[1, 2,..., ; 1, 2,..., ]2 (16)
The real-coded GA is given by the steps as follows:
Step 1:
Create the initial population of chromosomes where their values are obtained between the lower and upper bounds.
Step 2:
Calculate initial fitness values using (8) or (9).
Step 3:
Repeat genetic optimisation for t=0, 1, 2… max iteration
- Select a pair of chromosomes and use a crossover operator.
- Use mutation operator of the resulting chromosomes by the crossover operator.
- Operate on chromosomes acknowledging the search space constraints.
- Create new population by substituting the operated chromosomes for those selected for deletion.
Step 4:
Select the best solution from a final population by evaluating the best fitness function.
B. Biogeography based optimization method
The BBO algorithm is a new kind of optimization technique based on biogeography concept. It is an evolutionary algorithm that optimizes a function by stochastically and iteratively improving candidate solutions with regard to a given measure of quality, or fitness function. This population based algorithm uses the idea of the migration strategy of animals or other species for solving optimization problems. This method belongs to the class of meta-heuristics since it includes many variations, and since it does not make any assumptions about the problem and can therefore be applied to a wide class of problems [9-12].
The structure of habitat for OS-CFAR can be expressed as a vector.
] ., . . , ,
[t1 t2 tn n
HabitatCA−CFAR = (17)
n n n
CFAR
OS t t t K K K
Habitat − =[1, 2,..., ; 1, 2,..., ]2 (18)
The environment of BBO corresponds to an archipelago where every possible solution to the optimization problem is an island, each solution feature is called a suitability index variable (SIV). The goodness of each solution is called its habitat suitability index (HSI) where a high HSI of an island means good performance on the optimization problem and a low HSI means bad performance on the optimization problem. Improving the population is the way to solve problems in heuristic algorithms. The method to generate the next generation in BBO is by immigrating solution features to other islands and receiving solution features by emigration from other islands. The mutation is performed for the whole population in a manner similar to the mutation in GA.
In the BBO algorithm, Fig. 2 illustrates migration models, the immigration rate λ and the emigration rate μ of a solution which are functions of its fitness. The immigration curve shows that the least fit solution has the largest immigration rate and smallest emigration rate. The most fit solution has the smallest immigration rate and the largest emigration rate.S1represents a poor solution
whileS2 represents a good solution. The process of the BBO involves the following steps [11, 12]:
Step 1: Initialize the BBO parameters: maximum species
Step 2: Initialize a random set of habitats, each habitat corresponding to a potential solution to the given problems.
Fig. 3. Illustration of two BBO individuals using linear migration curves where S1 represents a poor solution and S2 represents a good solution
Step 3: For each habitat, map the habitat suitability index to
the number of species S, the immigration rate λ and the emigration rate, μ.
Step 4: Probabilistically use immigration and emigration to
modify each non_elite habitat, then recompute each HSI.
Step 5: For each habitat, update the probability of its
species count, then mutate each probability and recomputed each HSI.
Step 6: Is acceptable solution found? If yes then go to step
8.
Step 7: Number of iteration over? If no then go to Step 3
for the next iteration.
Step 8: Stop.
The BBO has the ability to search for total optimal results without fixing any parameters as classical methods.
IV. DISTRIBUTED CFAR DETECTION COMPARISONS
In this section, we will employ the GA and BBO algorithms presented in the previous section for the optimization of local thresholds of distributed CA-CFAR and OS-CFAR detectors. First, the search interval is set to
] 100 , 0 [
i
t and the ranked order is fixed in the intervalKi[1,Ni]
.
The initial population of about 30random islands is generated for the BBO method and equations (13) and (14) are used as the objective measure functions (fitness functions) in the sense of the Neyman-Pearson criterion. After giving the desired value of
0
=
f
P , the weighting parameters in (13) and (14) are
fixed in all simulations to w1=1, w2=1/0and w3=1 in all
simulations. Two cases of distributed CFAR detection are assessed in this section; distributed CA-CFAR and CFAR detectors with known power and distributed OS-CFAR detectors with unknown power.
A. Distributed CFAR detection with known power
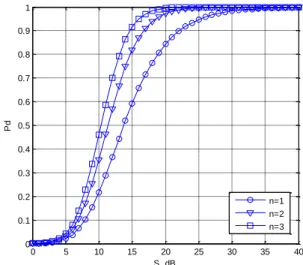
In this situation, we start by using the BBO method for the optimization of single, two and three identical CA-CFAR and OS-CA-CFAR detectors given in equations (7) and (9) with the “OR” fusion rule, Ni=32 (i.e., N1=N2=N3=32)
and Si=20 (S1=S2=S3=20). As ploted in Figs. 4 and 5, the
increase of the number of sensors provides better detection performances. When the desired value of Pfis used as a
parameter, Pd values versus S (SNR) are depicted for the
case of non-identical CA-CAR sensors using GA method and “AND” fusion rule. Moreover, Figures. 6. a and 6. b show that the best detection performances are achieved for high values of Pf. Taking the same conditions as before,
the BBO is executed and high values of Pd results are
obtained for large values of Pf as illustrated in Figs. 7. a
and 7. b. Now, we apply the two optimization tools (i.e., GA and BBO methods) to the distributed OS-CFAR detectors with “OR” fusion and Ni=32 (see Figs. 8 and 9).
In terms of the optimization method, similar Pd results are
given and the Pd values will be better if Pf takes high level.
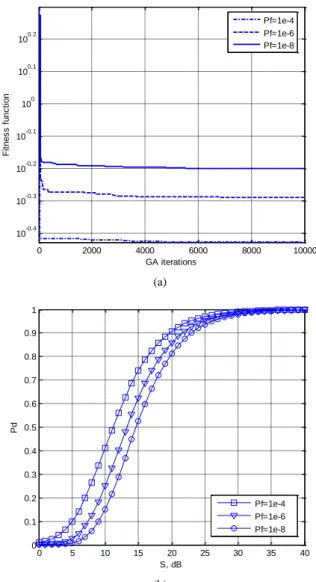
Fig. 10. b depicts the detection performances of non-identical CA-CFAR detectors using GA tool and “OR” fusion rule. It is noticed that the finale fitness function has a full dependent on the desired value of Pf. Also, the
fitness function evolution versus the number of iterations is illustrated in Fig. 10.a. As expected, the maximization of the Pd is related to the desired values of Pf.
To compare optimized values of local thresholds, ti we
consider identical CA-CFAR with Ni=40 and Si=20. These
variables which have similar values are optimized by the GA and the BBO tools. It is observed in TABLE I that the GA and the BBO tools give the same detection results, because we have only one variable to be optimized i.e., ti.
Our second experiment is the determination of unknown thresholds by means of GA and BBO methods when non identical sensors with N1=16, N2=24 and N3=32 are used.
Compared to the GA results in the case of “AND” fusion rule, the BBO algorithm provides the best Pd values as
shown in TABLE II. If the “OR” fusion rule is used, the BBO and the GA tools give almost the equivalent Pd values
with slight superiority to BBO algorithm as shown in TABLE III.
0 5 10 15 20 25 30 35 40
0 0.1 0.2 0.3 0.4 0.5 0.6 0.7 0.8 0.9 1
S, dB
Pd
n=1 n=2 n=3
Fig. 4. Detection probability of identical CA-CFAR detectors using BBO method for “OR” rule, Pf=1e-6, Ni=32 and Ki=3Ni/4.
Fitness Emigration Probability
Immigration 1
0 5 10 15 20 25 30 35 40 0
0.1 0.2 0.3 0.4 0.5 0.6 0.7 0.8 0.9 1
S, dB
Pd
n=1 n=2 n=3
Fig. 5. Detection probability of identical OS-CFAR detectors using BBO method for “OR” rule, Pf=1e-6, Ni=32 and Ki=3Ni/4.
0 2000 4000 6000 8000 10000
10-0.4 10-0.3 10-0.2 10-0.1 100 100.1 100.2
GA iterations
F
it
n
e
s
s
f
u
n
c
ti
o
n
Pf=1e-4 Pf=1e-6 Pf=1e-8
(a)
0 5 10 15 20 25 30 35 40
0 0.1 0.2 0.3 0.4 0.5 0.6 0.7 0.8 0.9 1
S, dB
Pd
Pf=1e-4 Pf=1e-6 Pf=1e-8
(b)
Fig. 6. Detection performances of non identical CA-CFAR detectors using GA method for N1=16, N2=24, N3=32 and “AND” fusion rule.
(a) Fitness function versus the number of generations. (b) Pd versus S (SNR).
0 2000 4000 6000 8000 10000
10-0.4 10-0.3 10-0.2 10-0.1 100 100.1 100.2 100.3
BBO iterations
F
it
n
e
s
s
f
u
n
c
ti
o
n
Pf=1e-4 Pf=1e-6 Pf=1e-8
(a)
0 5 10 15 20 25 30 35 40
0 0.1 0.2 0.3 0.4 0.5 0.6 0.7 0.8 0.9 1
S, dB
Pd
Pf=1e-4 Pf=1e-6 Pf=1e-8
(b)
Fig. 7. Detection performances of non identical CA-CFAR detectors using BBO method for N1=16, N2=24, N3=32 and “AND” fusion rule
(a) Fitness function versus the number of generations. (b) Pd versus S (SNR).
0 200 400 600 800 1000
10-2 10-1 100 101 102 103 104
GA iterations
F
it
n
e
s
s
f
u
n
c
ti
o
n
Pf=1e-4 Pf=1e-6 Pf=1e-8
0 5 10 15 20 25 30 35 40 0
0.1 0.2 0.3 0.4 0.5 0.6 0.7 0.8 0.9 1
S, dB
Pd
Pf=1e-4 Pf=1e-6 Pf=1e-8
(b)
Fig. 8. Detection performances of identical OS-CFAR detectors using GA method for Ni=32 and “OR” fusion rule
(a) Fitness function versus the number of generations (b) Pd versus S
0 200 400 600 800 1000
10-2 10-1 100 101
BBO iterations
F
it
n
e
s
s
f
u
n
c
ti
o
n
Pf=1e-4 Pf=1e-6 Pf=1e-8
(a)
0 5 10 15 20 25 30 35 40
0 0.1 0.2 0.3 0.4 0.5 0.6 0.7 0.8 0.9 1
S, dB
Pd
Pf=1e-4 Pf=1e-6 Pf=1e-8
(b)
Fig. 9. Detection performances of identical OS-CFAR detectors using BBO method for Ni=32 and “OR” fusion rule
(a) Fitness function versus the number of generations (b) Pd versus S
0 2000 4000 6000 8000 10000
10-2 10-1 100 101
BBO iterations
F
it
n
e
s
s
f
u
n
c
ti
o
n
Pf=1e-4 Pf=1e-6 Pf=1e-8
(a)
0 5 10 15 20 25 30 35 40
0 0.1 0.2 0.3 0.4 0.5 0.6 0.7 0.8 0.9 1
S, dB
Pd
Pf=1e-4 Pf=1e-6 Pf=1e-8
(b)
Fig. 10. Detection performances of distributed CA-CFAR using GA algorithm for N1=16, N2=24, N3=32 and “OR” fusion rule
(a) Fitness function with Si=20.
TABLE I
BEST THRESHOLDS FOR IDENTICAL CA-CFAR DETECTORS USING GA AND BBO ALGORITHMS WITH N=40, S=20 AND “OR” FUSION RULE
Optimization tool Pf n=2 n=3 n=5 n=7
GA method [6]
10-4 t
i=0.2809 Pd=0.8300
ti= 0.2940 Pd= 0.9224
ti= 0.3106 Pd=0.9827
ti= 0.3217 Pd=0.9959
10-6 t
i =0.4372 Pd=0.6848
ti = 0.4519 Pd=0.8116
ti= 0.4705 Pd=0.9298
ti= 0.4830 Pd=0.9729
10-8 t
i= 0.6126 Pd=0.5329
ti = 0.6290 Pd=0.6673
ti = 0.6500 Pd=0.8264
ti = 0.6639 Pd=0.6072
BBO method
10-4 t
i =0.2809 Pd=0.8300
ti = 0.2940 Pd= 0.9224
ti = 0.3106 Pd=0.9827
ti = 0.3217 Pd=0.9959
10-6 t
i =0.4372 Pd=0.6848
ti = 0.4519 Pd=0.8116
ti = 0.4705 Pd=0.9298
ti = 0.4830 Pd=0.9729
10-8 t
i = 0.6126 Pd=0.5329
ti = 0.6290 Pd=0.6673
ti = 0.6500 Pd=0.8264
ti = 0.6639 Pd=0.6072
TABLE II
OPTIMAL THRESHOLDS FOR NON IDENTICAL CA-CFAR DETECTORS USING GA AND BBO ALGORITHMS WITH N1=16, N2=24, N3=32, S=20 AND “AND” FUSION RULE
TABLE III
OPTIMAL THRESHOLDS OF NON IDENTICAL CA-CFAR DETECTORS USING GA AND BBO ALGORITHMS FOR N1=16, N2=24, N3=32, S=20 AND “OR” FUSION RULE
Optimization Tool
Pf t1 t2 t3
GA method [6]
10-4
0.1531 0.1150 0.1445
Pd=0.6271
10-5 0.0988 0.5049 0.0062
Pd=0.5196
10-6 0.1770 0.2150 0.2266
Pd=0.4857
10-7 0.5362 0.1999 0.1646
Pd=0.4145
10-8 0.3045 0.3804 0.2226 Pd=0.3684
BBO method
10-4 0.1289 0.1255 0.1486
Pd=0.6272
10-5 0.1566 0.0991 0.2413
Pd=0.5502
10-6
0.2065 0.2150 0.2115
Pd=0.4860
10-7 0.4086 0.3477 0.1147
Pd= 0.4161
10-8 0.2830 0.2497 0.3282
Pd=0.3700
Optimization Tool
Pf t1 t2 t3
GA method [6]
10-4
0.9114 0.5405 0.3754
Pd=0.9025
10-5 1.2059 0.6664 0.5055
Pd=0.8339
10-6 1.5352 0.8599 0.5964
Pd=0.7524
B.Distributed CFAR Detection with unknown power
In the case of dependent signals with unknown power, we compare the detection performance of distributed OS-CFAR detectors using GA and BBO methods. In this study, two sensors are considered with different values of sample sizes, N1=6 and N2=20.
Optimal parameters are found in TABLES IV and V for “AND” and “OR” fusion rules respectively. A closed look at these tables turns out that the BBO method provides the best Pd values in almost cases.
By investigating the illustrated results, it is observed that the efficiency of the BBO algorithm will be useful when the optimization complexity of the distributed non identical CFAR detection for several parameters increases.
TABLE IV
CFAR DETECTION COMPARISONS BETWEEN THE GA AND BBO ALGORITHMS IN THE CASE NON IDENTICAL OS-CFAR DETECTORS WITH UNKNOWN POWER, N1=16, N2=20 AND “AND” FUSION RULE
Pf BBO method GA method [6]
10-1 T
1=0.8204, T2=0.6457
K1=12, K2=18
) 0 (
" 2
d P
= 0.4390
T1=0.726, T2 =1.129
K1=13, K2=14
) 0 (
" 2
d P
= 0.4389 10-3 T
1=2.6286, T2=2.1864
K1=12, K2=18
) 0 (
" 2
d P
= 1.21e-2
T1=1.556, T2 =3.281
K1=15, K2=15
) 0 (
" 2
d P
= 1.205e-2
10-4
T1=3.6178, T2=3.0954 K1=12, K2=18
) 0 (
" 2
d P
=1.500e-3
T1= 3.156, T2=3.539 K1=13, K2=17
) 0 (
" 2
d P
=1.552e-3
10-5
T1= 4.6611, T2=4.1103 K1=12, K2=18
) 0 (
" 2
d P
=1.860e-4
T1= 2.878, T2=5.162 K1=15, K2=16
) 0 (
" 2
d P
=1.863e-4
10-6
T1= 5.7803, T2=5.2269 K1=12, K2=18
) 0 (
" 2
d P
=2.1506e-5
T1= 5.937, T2=6.073 K1=12, K2=17
) 0 (
" 2
d P
=2.148e-5
TABLE V
OPTIMIZATION BY GA AND BBO ALGORITHMS OF NON IDENTICAL OS-CFAR DETECTORS WITH UNKNOWN POWER, N1=16, N2=20 AND
“OR” RULE
Pf BBO method GA method [5]
10-3
T1= 6.1382, T1= 6.9298 K1=13, K2=18
) 0 (
" 2
d P
= 2.53e-2
T1= 7.272, T2=4.655 K1=13, K2=18
) 0 (
" 2
d P
=1.162e-2
10-4
T1=5.9420, T2=7.6778 K1=15, K2=18
) 0 (
" 2
d P
=2.900e-3
T1= 5.3610, T2=7.703 K1=16, K2=17
) 0 (
" 2
d P
=1.418e-3
10-5
T1= 8.2147, T2=10.6284 K1=15, K2=18
) 0 (
" 2
d P
=3.3683e-4
T1=9.7140,T2=8.6910 K1=15, K2=18
) 0 (
" 2
d P
=1.662e-4
10-6
T1= 10.895,T2=14.0889 K1=15, K2=18
) 0 (
" 2
d P
=3.7978e-5
T1= 10.12, T2=9.179 K1=16, K2=19
) 0 (
" 2
d P
=1.873e-5
V. CONCLUSIONS
In this work, the optimization of distributed CFAR detection in Gaussian clutter was carried out using GA and BBO tools. Two CFAR procedures were considered; the CA-CFAR and the OS-CFAR. The detection performances were assessed as a function of the number of sensors, the desired value of the false alarm probability and the preselected “AND” or “OR” fusion rule at the fusion center. The obtained results showed the improvements of the global detection probability using the BBO algorithm in almost cases rather than the GA algorithm.
10-8 2.3957 1.2512 0.8407
Pd=0.5584
BBO method
10-4 0.8762 0.5293 0.4018
Pd=0.9018
10-5 1.1964 0.6918 0.4838
Pd= 0.8355
10-6
1.5268 0.8646 0.5962
Pd=0.7524
10-7 1.8740 1.0736 0.7205 Pd= 0.6567
10-8 2.3798 1.2541 0.8432
REFERENCES
[1] L. A. Prastitis, “On Adaptive Censored CFAR Detection”, Phd thesis, Department of Electrical and Computer Engineering, 1993.
[2] A. Mezache, and F. Soltani, “Threshold optimization of decentralized CFAR Detection in Weibull clutter using genetic algorithms,” Signal Image and Video Processing, Springer, vol. 2, pp. 1-7, 2008.
[3] R. S. Blum and J. Qiao, “Threshold Optimization for Distributed Order-Statistic CFARSignal Detection”, IEEE Transactions on Aerospace and Electronic Systems, vol. 32, no. 1, pp. 368-377, 1996.
[4] F. Gini, and F. Lombardini, “Decentralized CFAR Detection with binary integration In Weibull clutter,” IEEE Transactions on Aerospace and Electronic Systems, vol. 33, no. 2, pp. 396-407, 1997.
[5] M. Weiss,“Analysis of some modified Cell-Averaging processors in multiple target situations”, IEEE Transactions on Aerospace and Electronic Systems, vol. AES-18, no. 1, pp. 102-114, 1982. [6] W. Liu, Y. Lu and J. S. Fu, “Data Fusion of Multiradar System by
Using Genetic Algorithm”, IEEE Transactions on Aerospace and Electronic Systems, vol. 38, no. 2, pp. 601-612, 2002.
[7] M. Setnes, H. Roubos, “GA-Fuzzy modeling and classification: complexity and performance”, IEEE Transactions on fuzzy systems, vol.8, no.5, pp. 509–522, 2000.
[8] M. Herrer, F. Lozano, J.L. Verdegay,“Tackling real-coded Genetic algorithms: Operators and tools for behavioural analysis”. Artif. Intell. Rev, 1998.
[9] H. Ma. “An analysis of the equilibrium of migration models for biogeography based optimization,” Information Sciences 180, pp. 3444-3464, 2010.
[10] S. Dan, “A Probabilistic Analysis of a Simplified Biogeography Based Optimization Algorithm,” Department of Electrical and computer Engineering, Cleveland state University, Cleveland, Ohio, 44115, USA.
[11] S. Dan, “A dynamic system model of biogeography_ based optimization”, Applied Soft Computing, vol. 11, pp. 5652-5661, 2011.
[12] S. Kumar, P. Bhalla, and A. Singh, “Fuzzy Rule base Generation from Numerical Data Using Biogeography based Optimization,” IE(I) Journal–ET, vol. 90, pp. 1-6, 2009.
Authors short biographies
Amel Gouri was born in M’sila, Algeria, on January 5, 1991. She received the Master degree in Electronics/systems control from the University of Mohamed Boudiaf-M’Sila, Algeria in 2015. She is a doctorate student in Telecommunication at the University of M’Sila since 2015. Her main research interests include radar signal processing, Parameter estimation of statistical models and CFAR detection.
Amar Mezache was born in Constantine, Algeria, in 1971. He received the Engineering degree in Electronics/Systems Control, the Msc degree and the Doctorate degree both in Signal Processing from the University of Constantine, Algeria in 1997, 2000 and 2007, respectively. He joined the Department of Electronics, the University of M’sila, in 2004 as a full-time Professor, where he has been teaching radar signal detection and estimation, power electronics and control of DC/AC motors. He is a member of the SISCOM (Signaux et Systèmes de Communication) Laboratory, University Constantine 1. His current research interests include modeling and parameter estimation of high resolution sea clutter data, radar CFAR detection and application of artificial intelligence in radar signal processing.