The University of San Francisco
USF Scholarship: a digital repository @ Gleeson Library |
Geschke Center
Master's Theses
Theses, Dissertations, Capstones and Projects
Summer 8-1-2016
Characterization of ETBE + Cl and Isooctane + Cl
Combustion Products using Synchrotron
Photoionization
rong yao
university of San Francisco, [email protected]
Follow this and additional works at:
https://repository.usfca.edu/thes
Part of the
Physical Chemistry Commons
This Thesis is brought to you for free and open access by the Theses, Dissertations, Capstones and Projects at USF Scholarship: a digital repository @ Gleeson Library | Geschke Center. It has been accepted for inclusion in Master's Theses by an authorized administrator of USF Scholarship: a digital repository @ Gleeson Library | Geschke Center. For more information, please [email protected].
Recommended Citation
yao, rong, "Characterization of ETBE + Cl and Isooctane + Cl Combustion Products using Synchrotron Photoionization" (2016).
Master's Theses. 188.
Characterization of ETBE + Cl and Isooctane + Cl
Combustion Products using Synchrotron Photoionization
To the Department of Chemistry
of the University of San Francisco
in partial fulfillment of the degree of
master of Science in Chemistry
A thesis written by Rong Yao
Bachelor of Clinical Pharmacology
Anhui Medical University, China
Characterization of ETBE + Cl and Isooctane + Cl
Combustion Products using Synchrotron Photoionization
Thesis written by Rong Yao
This thesis is written under the guidance of Faculty Advisory Committee, and approved by all its
members, has been accepted in partial fulfillment of the requirements for the degree of
Master of Science in Chemistry
Thesis Committee
Giovanni Meloni, Ph.D. Date
Associate Professor, Research Director
William Melaugh, Ph.D. Date
Professor
Ryan West, Ph.D. Date
Assistant Professor
Marcelo Camperi, Ph.D. Date
Acknowledgments
This thesis would not have been possible without the support and help from many people in
many different ways. Those people to whom I owe a great deal of thanks I would like to address
my appreciation:
First and the foremost, I would like to express my gratitude to my advisor, Dr. Giovanni
Meloni. During my two-year graduate study here, Dr. Meloni is providing me continuous
invaluable supports, supervisions, encouragements and guidance for research. He shows me what
a scientist should be. His irrepressible enthusiasm and constant striving to be the best keep
pushing us to learn more. I am very honored to having the chance working with Dr. Meloni.
Thank you for your attention until the completion of my dissertation. It is meaningful for me.
At the beginning of my master career, Joseph Czekner and Ken Smith had helped and
trained me. With great patience, they supplied me excellent training on both experiment and
theory that servers as important foundations for me to become independent and successful in my
later research. What they had done are really appreciated. I also want to thank all the other group
members in Dr. Meloni’s group, including Brittany Bryan, Magaly Wooten, Audrey Smith, Giel
Muller, for providing such a friendly and supportive environment.
Furthermore I would like to thank the Chemistry Department at USF. Gratitude goes to Dr.
West and Dr. Melaugh for their generous help on my thesis. I am also grateful to the department
supporting staff including Chad and Angela. Special thanks go to the program assistant Deidre.
Last, but not least, I want to thank my family and my husband, Yuntao Xu for their endless
support and encouragement. They are always here when I need them. I could not have been what
Abstract
The low temperature (298 – 700 K) oxidation characterizations of a series of fuel
additives (ETBE and isooctane) were studied at advanced light source in Lawrence Berkley
National lab, using a multiplexed chemical kinetics photoionization mass spectrometer with
tunable synchrotron radiation. Using Cl atoms as initiators in presence of oxygen,
photoionization data were collected. Data analysis was performed via characterization of the
reaction species photoionization spectra and kinetic traces, from which the products and also the
intermediates were identified. Relevant reaction dynamics on potential energy surfaces were
calculated, reaction enthalpies of each individual step were presented using the CBS-QB3
composite model, and reaction pathways were proposed.
v
Table of Contents
Chapter 1 Introduction
1.1 Energy Insufficient ………...1
1.2 Environmental Crisis ………...1
1.3 Combustion ………...1
1.4 Homogeneous Charge Compression Ignition (HCCI) Engine ...2
1.5 Fuel Additives……….. ..4
1.6 Reference ………....5
Chapter 2 Experimental Set-Up 2.1 Introduction………..6
2.2 Excimer Laser………...6
2.3 Slow-Flow Reaction Tube………...8
2.4 Vacuum Systems.……….8
2.5 Photoionization Source………10
2.6 Beamline………...……...12
2.7 Microchannel Plates (MCP) Detector……….14
2.8 Time-of-Flight Mass Spectrometer……….16
2.9 Reference……….17
Chapter 3 Theory and Methodology 3.1 Introduction………..19
3.2 Radical………..19
3.3 Ionization and dissociation Energy……….………..20
3.4 Photoionization Cross Section……….….21
3.5 Frank-Condon Principle………....23
3.6 Photoionization Spectra………....25
3.7 Electronic Structure Calculations……….….26
vi
3.9 Reference………..31
Chapter 4 Synchrotron Photoionization Investigation of the Oxidation of Ethy Tert-Butyl Ether 4.1 Introduction………..34
4.2 Experimental Section………...35
4.3 Computation Method………...36
4.4 Results………..36
4.5 Postulated Mechanism………..42
4.6 Branching Ratios………..47
4.7 Conclusions………..49
4.8 Reference……….49
Chapter 5 Characterization of Isooctane Oxidation at Low Temperature via Synchrotron Photoionization Mass Spectrometry 5.1 Introduction………53
5.2 Experimental Section……….54
5.3 Computation Methods………54
5.4 Results………55
5.5 Postulated Mechanism………60
5.6 Conclusions……….66
Chapter 1.Introduction
1.1 Energy Insufficient
The rising population, heavy industrialization, and motorization have led to a steep rise of the energy demand. The major energy sources in global scale are petroleum (oil), natural gas, coal,
nuclear, and renewable. According to US Energy Information Administration (EIA),1 the total
primary energy consumption will grow from 95 quadrillion Btu ,which is the abbreviation of British thermal unit, a traditional energy unit defined as the energy to cool or heat one pound of water by one degree and used in the power, steam generation, heating and air conditioning
industries,2 in 2012 to 106 quadrillion Btu in 2040, an increase of 12% in the Annual Energy
Outlook 2014.3 The domestic production of natural gas and crude oil will grow annually of 0.8
million barrels per day (MMbbl/d), through 2016 in total it will be 9.5 MMbbl/d to meet the
residential and commercial needs.1
Since the enormous consumption of coal and gasoline and the increasing need for energy and the limited reserve, seeking new kinds of replaceable energy and improving the combustion efficiency of engines is gaining public and scientific attention.
1.2 Environmental Crisis
The environmental crisis represented by greenhouse effect, climate change, air pollution, ozone depletion, and severe water contamination, requires an immediate solution. It is expected that the
concentration of CO2 in the atmosphere will be around 480 parts per million (ppm) in 2050, it will
continue to rise to around 585 ppm in 2100 with the growing demand for fossil fuel.4 It has been
shown that the total green house gas emission has increased by 65% to 222,988 Gg, or gigagram
that equals to 106Kg,5 in 2000 from the 1994 level.6
In January 2013 Beijing experienced a prolonged and severe smog, which contained 40 times the
amount of hazardous particles than the safe level defined by the World Health Organization.7
These hazardous particles mostly came from coal combustion and vehicles exhaust emissions. For these reasons, there are many studies concerning the energy output optimization and lowering of pollutant emissions. For example, new biodiesel, produced by enzymatic transesterification of cottonseed oil with methanol, showed great performance in greenhouse gas emission reduction:
CO emission gets reduced by 33.3% and CO2 gets reduced by 8.4%.
8
1.3 Combustion
Combustion is basically the exothermic oxidation chemical reactions of fuels. Its general equation is:
Fuel + Air CO2 + H2O + Heat
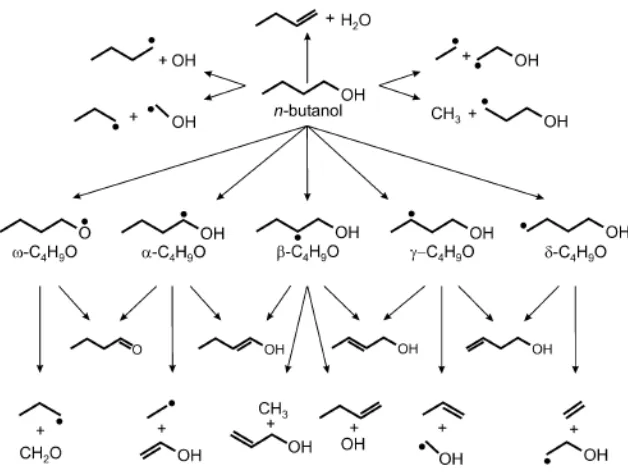
However, this only occurs in simple and complete combustion. But for most of the fuels, such as diesel, oil, coal, or wood, incomplete combustion occurs, which involves numerous individual free radicals and intermediates. As shown in Fig. 1.1, several different intermediates emerged during the low pressure oxidation of n-butanol.
Figure 1.1. Reaction pathway for n-butanol in low pressure premixed flames.9
These different intermediate reaction pathways will give rise to unwanted pollutants. In this thesis, we specifically focus on reactions in which the fuel and oxidizers are premixed before combustion at lower temperature (<900 K).
1.4 Homogeneous Charge Compression Ignition ( HCCI ) Engine
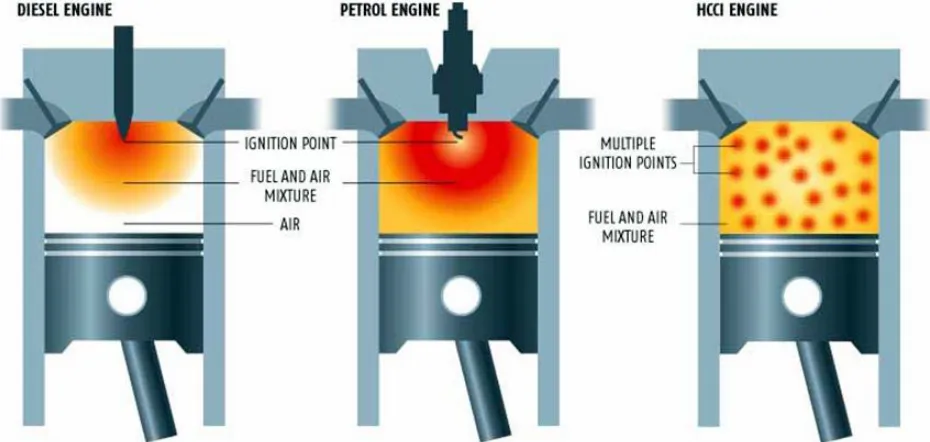
The quality of combustion can be improved by advanced combustion engines. Homogeneous Charge Compression Ignition or HCCI is one example of new generation advanced engines, which has no spark plug and relies on compression ignition of premixed fuels autoignition. HCCI engine
basically has two benefits. It lowers NOx emission10 and improves combustion efficiency. Via a
homogeneous charge in the chamber at high compression ratio through multiple ignition points the combustion is more homogeneous and, therefore, more efficient. At the same time, the maximum temperature of the charge is kept low by means of super-lean mixtures and/or inert dilution. With
such conditions, very low NOx are produced and relatively high efficiency cycles can be
designed.11 Figure 1.2 shows the schematics of traditional spark and Diesel engines compared to a
HCCI engine.
Figure 1.2. General layout of traditional spark induced diesel and petroleum engines compared to
a homogeneous charge compression ignition (HCCI) engine.11
The challenges of HCCI engines are ignition timing, combustion duration,12 and load range of
fuel.13 Fuels like DME14 and n-butanol12 can be operated in such engines, where low temperature
auto-ignition occurs. Therefore, the low temperature oxidation of fuels is crucial to improve the HCCI systems and combustion efficiency, and lower pollutants emission.
Reactivity Controlled Compression Ignition (RCCI) is another example of advanced engines, which allows increased combustion efficiency and lower possible emissions. RCCI is a dual fuel, light-duty, and low-temperature combustion technique that operates using fuel premixing like methane/gasoline blend or methanol/diesel and obtains diesel-like efficiency or better with
ultra-low nitrogen oxide and soot emissions.15 Figure 1.3 shows the schematic of a RCCI engine, in
which gasoline and diesel are mixed. RCCI uses in-cylinder fuel blending with at least two fuels of different reactivity and multiple injections to control fuel reactivity and optimize combustion phasing duration and magnitude. First, the low reactivity fuel (in this case gasoline) is injected into the cylinder through the port, and is mixed with air and recycled exhaust gases to create the premixed fuel. Then, the higher reactivity fuel (in this case diesel) is injected directly. Meanwhile,
the mixed fuel ignites.16 RCCI is actually a variant of HCCI, which still does not have the spark
ignition system but relies on the compression of mixed fuel.
Figure 1.3. General layout of a reactivity controlled compression ignition (RCCI) engine.16
There are still many questions to be answered for the development of RCCI, such as: (a) which low and high reactivity fuel are chosen?; (b) What is the most optimized ratio of their relative amounts?; (c) What is the perfect ignition timing?; (d) How is the controlled temperature
chosen?17 All these questions need us to explore and investigate the low temperature oxidation of
fuels.
1.5 Fuel Additives
Additives to petroleum fuels have been proven to make the fuels more stable with higher combustion efficiency and lower noxious emissions. Specific fuel additives are used depending on the internal combustion engine.
For the petrol engines, typical fuel additives are oxidation inhibitors or antioxidants, which prevent oxidation, polymerization, and polycondensation processes in petrol. Phenol and amines derivatives are currently used the most. Specifically, the main function of amines additives is to control combustion chamber deposit, which cause an increase in the requirement of octane
number18 that is a value used to indicate the resistance of a fuel to knock. Its value is based on a
scale in which isooctane is 100 and heptane is 0.19 Knocking is the sharp sound caused by
combustion of part of compressed air-fuel mixture in the cylinder of an internal engine. Knocking causes overheating of the spark-plug points, erodes the combustion chamber, and decreases
combustion efficiency.20 Unsaturated hydrocarbons (mainly alkenes and aromatics) and
oxygenates (such as methyl tert-butyl ether and ethanol) comprise another group of very important fuel additives. Unsaturated hydrocarbons can polymerize and form gums, which are injected into the combustion chamber to prevent engine damages. The unsaturated hydrocarbons also can
increase the amount of dissolved oxygen to improve the combustion efficiency.20
For the diesel engines, additives are used to increase lubricity, stability, and combustion cetane number, which refers to the combustion quality of diesel fuel and represents the time delay between the start of injection process and the point where the fuel ignites. The cetane number is
determined by the % amount of cetane in isocetane21. The diesel engines will produce more NOx
pollutants than gasoline engine since the different burning processes inside the cylinders.22 For
example, ethylene glycol monoacetate, an oxygenated additive derived from biomass, has been
showed that it improves the combustion performance and lower the NOx pollutants emission.
23
In general, additives are relatively unstable compounds, which will be converted to radicals to initiate
and promote the combustion of diesel fuel.24
Currently, the most used gasoline additive in the market is ethanol. The oxygenated additives employed in gasoline engines are mainly alcohols, such as methanol, ethanol isopropyl alcohol,
butanol, and ethers like methyl tert-butyl ether (MTBE), tert-amyl methyl ether (TAME), ethyl tert-butyl ether (ETBE), and tert-amyl ethyl ether (TAEE). The other group of gasoline additives is
antiknock agents like toluene, ferrocene, isooctane, and triptane.25 The antiknock additives
interrupt the chain reaction of auto ignition by lowering the temperature, pressure and increasing the auto-ignition rate.26
The diesel additives currently used are 2-ethylhexyl nitrate, isopropyl nitrite, tetrathylene glycol dinitrate, and di(tert-butyl)peroxide, which are the primary cetane improvers.
1.6 References
(1) (EIA), U. E. I. A. 2014.
(2) http://en.wikipedia.org/wiki/British_thermal_unit.
(3) http://www.eia.gov/forecasts/aeo/er/pdf/0383er%282014%29.pdf.
(4) Dietz, S.; Stern, N. Environmental Econmomics & Policy2009, 3, 138.
(5) http://www.convertunits.com/info/Gg.
(6) Leong1, Y. P.; Mustapa, S. I.; Hashim, A. H. International Journal of Climate Change:
Impacts & Responses.2011, 2, 9.
(7) Xu, B. Council on Foreign Relations2014.
(8) Chattopadhyay, S. Applied EnergyMay 2013, 105, 319.
(9) Hansen, N.; Harper, M. R.; Green, W. H. Phys. Chem. Chem. Phys.2011, 13, 20262.
(10) Andrae, J. C. G. Energy Fuels2013, 27, 7098.
(11) Hairuddin, A. A.; Yusaf, T.; Wandel, A. P. Renewable Sustainable Energy Rev.2014, 32,
739.
(12) Liu, M.-b.; He, B.-q.; Yuan, J.; Zhao, H. Neiranji Xuebao2013, 31, 324.
(13) Kobayashi, K.; Sako, T.; Sakaguchi, Y.; Morimoto, S.; Kanematsu, S.; Suzuki, K.;
Nakazono, T.; Ohtsubo, H.; International Gas Union: 2011; Vol. 3, p 2066.
(14) Jang, J.; Lee, Y.; Cho, C.; Woo, Y.; Bae, C. Fuel2013, 113, 617.
(15) Curran, S. J.; Hanson, R. M.; Wagner, R. M. International Journal of Engine Research
2012, 13, 216.
(16) Curran, S.; Gao, Z.; Szybist, J.; Wagner, R. 2014 CRC Workshop on Advanced Fuels and
Engine Efficiency2014.
(17) Wagner, R.; Curran, S.; Hanson, R.; Barone, T.; Briggs, T.; Kokjohn, S.; Reitz, R.
Directions in Engine-efficiency and emissions research conference2011.
(18) Rang Heino; Juri, K. Estonian Academy of Sciences:ChemistrySep 1, 2003.
(19) Hosoya, H. Croatica Chemica ACTA2002, 2, 433.
(20) A.Groysman Corrosion in Systems for storage and transporation of petroleum products
and biofuel identification,monitoring and solutions. Springer Science2014.
(21) Bamgboye, A. I.; Hansen, A. C. Int.Agrophysics2008, 22, 21.
(22) C.-Y. Lin; Huang, J.-C. Ocean EngineeringSep. 2003, 30, 1699.
(23) Diana Hernández; Jhon J. Fernández; Fanor Mondragón; López, D. FuelFeb, 2012, 92,
130.
(24) Jimmie C. Oxley ; James L. Smith ; Evan Rogers ; Ye, W. Energy& Fuels2001, 5, 1194.
(25) http://en.wikipedia.org/wiki/List_of_gasoline_additives.
(26) E. A. Dem'yanenko; A. V. Sachivko; V. P. Tverdokhlebov; P. S. Deineko; A. M.
Bakaleinik; V. M. Manaenkov; V. E. Emel'yanov; Onoichenko, S. N. Chemistry and Technology of Fuels
and Oils1993, 29, 267.
6 Chapter 2.Experimental Set-Up
2.1 Introduction
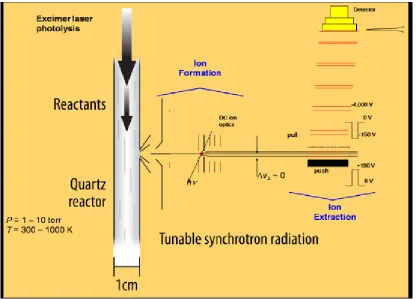
This chapter describes the main experimental instruments we used for our research. The experiments are conducted at the Chemical Dynamics Beamline 9.0.2 of the Advanced Light Sources (ALS) at the Lawrence Berkeley National Laboratory. Radical precursor and reactant diluted with helium gas flow into the top of the reactor tube with a flow velocity of about 400 cm s-1 at a total flow of 100 standard cubic centimeter per minute (sccm) and a total pressure of 4 Torr at room temperature and 7 Torr at 550 K. Their flows are metered by calibrated individual mass flow controllers. Reactions are initiated by formation of free radicals from a precursor using an unfocused excimer laser pulse (possible wavelengths include 193, 248, or 351 nm depending on the photolytic precursor), which propagates collinearly down the reaction tube, ensuring spatial homogeneity of radicals on a relatively short time scale. The quasi-continuous tunable vacuum ultraviolet radiation combined with the time of flight (TOF) mass spectrometer (MS) is used to probe our systems. The overall schematic is presented below (Figure 2.1). The important components will be discussed further.
Figure 2.1. Cross section view of reactor tube and multiplexed photoionization time of flight mass spectrometer using the tunable VUV radiation of the Advanced Light Source.1
2.2 Excimer Laser
7
radical precursors at precise wavelengths. For example, Cl radical is produced by Cl2 photolysis at 351
nm, and OH radicals are generated by H2O2 photolysis at 248 nm.
Figure 2.2 shows the components of a state-of-the art modular excimer laser. Optical pulse multiplier is one of its important components. It receives the laser output beam and produces a larger number of pulses. Usually a noble gas (argon, krypton, or xenon) and a reactive gas (an halogen such as fluorine or chlorine) are used as the lasing medium. For a KrF laser, the lasing medium is about 0.1% fluorine, 1.3% krypton, and the rest helium as buffer gas. For an ArF laser, the laser medium is about 0.1% fluorine, 3% argon and the rest helium.2 The laser gas is introduced in the laser cavity at a pressure between 3 and 3.5 atm using the tangential blower located in the laser discharge chamber. The natural bandwidth of the excimer laser is narrowed by line narrowing modules that comprise of more optical units used for the purpose of selecting a center wavelength and, therefore, narrowing the bandwidth. These components are designed for quick replacement as individual units to minimize downtime to the laser when maintenance is performed. A commutation module, a compression module, and a high voltage power supply module serve as a pulse power system and provide electrical pulses to the electrodes located in the discharge chamber. An interface module and a control module include an elliptical mirror and a diffraction grating, which is a laser beam dispersion and extraction unit. It receives the laser beam extracted through the laser oscillator and is configured to selectively extract a specific wavelength. A stabilization module and an auto-shutter module serve as a prism and a selective transmission surface, respectively, which transmit the laser beam with the selected wavelength and reflect other lines of the laser beam. The interface and control modules also include a diffraction grating cooling system for cooling the grating and preventing the gas from diffusing toward the front surface of the diffraction grating. If the gas reaches the front surface of the diffraction grating by diffusing, the grating which is very sensitive will malfunction due to contamination.3
Figure 2.2. The schematic of KrF excimer laser2.
Lasers work on the basic principle of population inversion, which occurs when the number of atoms or molecules in an excited state is more than the number existing in lower energy states.4 Specifically, population inversion in excimer lasers is achieved by an electric current from the high-voltage electrode that produces molecules in an excited state. This electric discharge will excite Kr to an excited state, or kick an electron off Kr creating Kr ions. Meanwhile, some electrons collide with F2
8
to their ground state by emitting a photon and give rise to the laser light in the ultraviolet range. Their ground state is inherently unstable and dissociates back into two unbound atoms. 5,6
The unfocused excimer laser in our experiments is operated at a repetition rate of 4 Hz, with the fluence of 10-60 mJ cm-2 and pulsewidth of 20 ns.
2.3 Slow-Flow Reaction Tube
The reaction is carried out in a 62 cm long side-sample quartz flow reactor tube with the inner diameter of 1.05 cm and the outer diameter of 1.27 cm. The reactions are investigated under a selected temperature, which can be varied between 298 and 700 K, and pressure between 4 and 10 Torr. In order to assure uniform initial radical density, the total pressure is kept low so that gaseous diffusion in the reactor smoothes any inhomogeneity on a short time-scale. The temperature inside the cell is measured by a thermocouple utilizing a closed-loop feedback circuit controlling the gas temperature over the range 300−1050 K. The reactor tube is thermally insulated by a 18 m thick nichrome tape in order to minimize temperature gradients. The heating tape is insulated with square-weave, yttria-stabilized zirconia cloth (ZYW-15, Zircar Zirconia, Inc.) and encapsulated by a gold-plated copper sheath in order to keep temperature homogeneity.1 The pressure in the reactor is maintained at a specific chosen value by gas removal using a Roots pump controlled by a closed-loop feedback throttle valve. The total gas flow rate in the reactor tube is maintained at 400 cm s-1 at each pressure and temperature in order to have a fresh sample at each laser shot. A 400−650 m pinhole in the side of the reactor tube, which is 35 cm downstream from the opening, allows gases to effuse as a sampled beam into the source chamber. The remainder of the main chamber (source chamber) is evacuated using a 3200 Ls-1 oil-free turbo molecular pump. Reaction gases are measured by individual calibrated mass flow controllers and fed down the tube.
2.4 Vacuum Systems
The reactions are carried out under differential vacuum environment. The pressure in the beamline before our experimental apparatus is extremely low (on the order of 10-9 Torr) to minimize the photon absorption. There are three different vacuum pumps, which are designed to be free of hydrocarbon contamination: roots pumps, turbomolecular pumps, and backing scroll pumps.7
The roots pumps evacuate the reactor tube. Their working mechanism consists of two symmetrically counter-rotating rotors separated by a thin gap (0.05−0.25 mm) rotating in opposite directions.8 Figure 2.3 (a) shows the picture of a roots pump and (b) shows its internal diagram. Its vacuum capacity can vary from 21 to 8,333 L/s (75 to 30,000 m3/h) with a total operating pressure range from 10 to 10-3 mbar.
(a) (b)
9
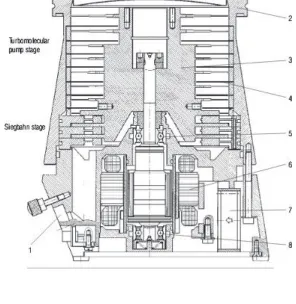
The turbo molecular pumps, as shown in Figure 2.4, consist of a rotor, a stator, and turbine blades, which are located around the circumferences of the stator and the rotor.9 The space between the stator and the rotor disks is on the order of millimeters or less. The high-speed rotating blades transfer momentum to the gas molecules, with a component towards the pump outlet. Concentration, arrival rate, and directionality are determined by the flow rates and chamber pressure.10 Kinetic gas theory shows us the parameters affecting the gas average molecular speed c in the following equation:
M T R c
* * * 8
(2.1)
where M is the molar mass of the pumped gas, R is the universal ideal gas constant, and T is the temperature of the source chamber.9
Three turbo molecular pumps are employed in our experiments. A 3200L/s turbomolecular pump is used to evacuate the reaction chamber. A 600 L/s turbomolecular pump is employed to evacuate the detector region and a 1600 L/s turbomolecular pump is used to pump the ionization region.1
10
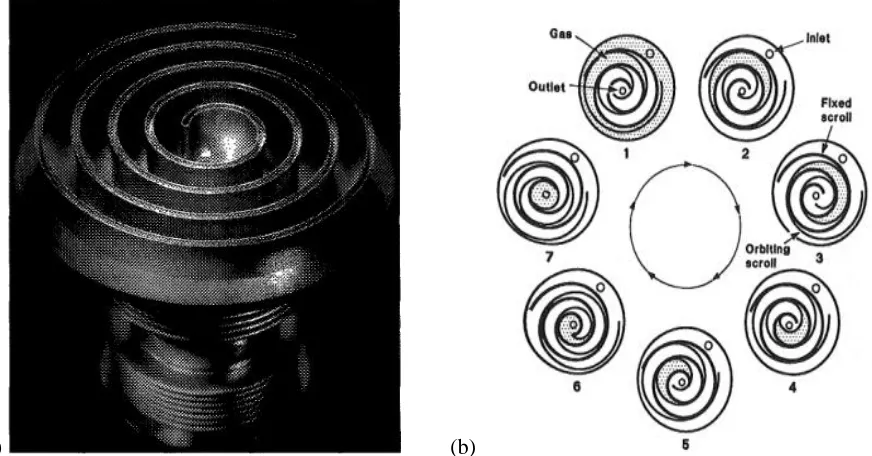
The scroll pumps are used to pump the entire apparatus before the turbo pumps start. Their operating pressure range may vary from 1,000 to 10-2 mbar with a pumping speed of 5.6 to 14 L/s (20 to 50 m3/h).7 The scroll pump consists of two mated plates, each with a spiral machined into it, as shown in Figure 2.5 (a).11 The two plates are interweaved, and one remains fixed while the other is driven in an orbital motion, so that one spiral sways involuntarily within the second one.12 A schematic of how scroll pumps work is given in Figure 2.5 (b).13 The motion of the two plates traps volumes of gas and compresses them along the spiral in chambers that are constantly becoming smaller until the gas is expelled to the atmosphere.
(a) (b)
Figure 2.5. (a) Picture of the spiraled plate of a scroll pump,11 and (b) its general schematic.13
2.5 Photoionization Source
A specific energy range is needed to ionize the reaction species. In our experiments, 3rd generation synchrotron radiation from the Chemical Dynamics Beamline of the Advanced Light Source (ALS) at Lawrence Berkeley National Laboratory in the UV−VUV region (7.2−25 eV) is employed to provide this ionizing energy. The details of synchrotron radiation will be discussed further below.
11
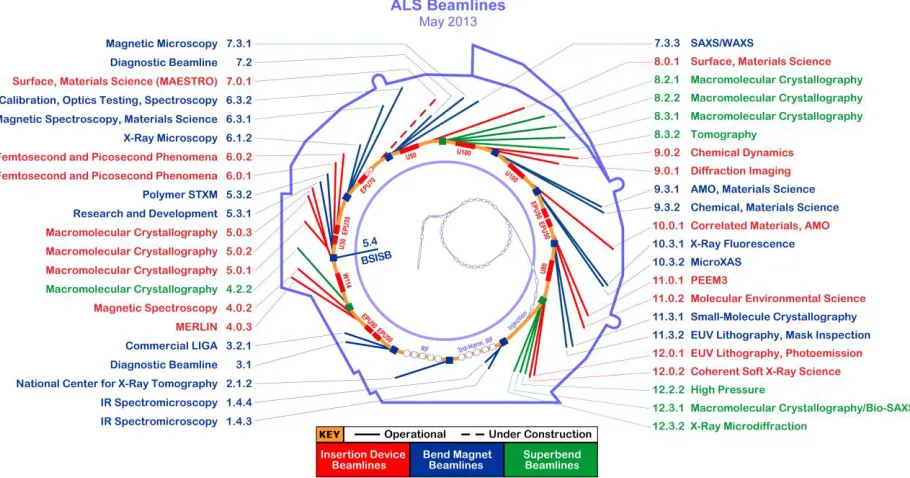
Figure 2.6. Layout of the ALS at the Lawrence Berkeley National Laboratory.15
The most outstanding feature of synchrotron radiation is the high brightness (i.e., photon flux per unit area). The brightness of the photon beam from the ALS is a million times more intense than that produced by X-ray tubes and can be several orders of magnitude larger than any conventional laboratory source. The other remarkable feature of synchrotron radiation is its tunability. The radiation can be continuously changed using appropriate monochromators on each beamline. The energy range of the beamline we use is 7.2−25 eV with an energy resolution of approximately 25 meV.
12 Figure 2.7. The overview of ALS 50 MeV Linac.16
Once the electrons reach an optimum energy, they are injected into a roughly circular storage ring under vacuum, where the electrons circle millions of times per second. In the storage ring, bending magnets, undulators, and wigglers are used to make and deliver the synchrotron radiation. Bending magnets provide broad spectrum, low power radiation at the turns in the storage ring. Undulators and wigglers are periodic magnets, repeated as N and S poles, placed in the straight section of the storage ring, as shown in Figure 2.8. These periodic arrays of alternating magnets force the electrons through a series of oscillations around their mainly straight trajectory, “wiggle” electrons back and forth to form a narrow beam of light that is a hundred times brighter than conventional X-ray sources. Since wigglers have less magnets than undulators, undulators provide bright, laser like radiation, while wigglers provide broad spectrum high photon flux radiation.17 The tuning of the undulator is achieved by varying the value of the so-called “magnetic deflection parameter” which is proportional to the strength of the magnetic field (B0) and the
spacing (λμ) between every adjacent two magnets with same polarity (as shown in Fig. 2.8).18 Three
undulators are used at the ALS: two U5.0 that have 89 periods and each period is 5 cm, and one U8.0, which has 55 periods and each period is 8 cm.19
Figure 2.8. The periodic magnets of an undulator.17
Undulator radiation generates high power, tunable X-ray sources, but is not inherently 100% spectrally and spatially coherent. Radiation from an undulator is quasi monochromatic. Increased spectral coherence is achieved with a coupled monochromator.17
2.6 Beamline
13
Figure 2.9, there are 43 beamlines at the ALS, each optimized for a particular field of research according to its energy range and characteristics.
Figure 2.9. The ALS beamline diagram.20
14 Figure 2.10. Schematic layout of Beamline 9.0.2.
The monochromator selects a specific wavelength value based on Braggs’ law (equation 2.2). An incident beam that scatters on a diffraction grating is reflected according to the following equation,
n
2dsin
(2.2)where d is the distance between layers in a crystal, θ is the incident angle, λ is the wavelength of the incident beam of light, and n is order of the reflection. Essentially, the grating works as an optical filter allowing only a specific wavelength to be reflected from the incident radiation. The reflection occurs when Bragg’s law is satisfied. By changing the angle θ different wavelengths can be selected.
2.7 Microchannel Plates (MCP) Detector
15
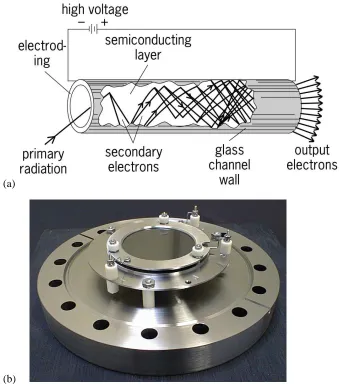
A microchannel plate (MCP) consists of millions of ultra-thin conductive glass capillaries from 4 to 25 μm in diameter and 0.20 to 1.0 mm in length fused together and sliced in the shape of a thin plate, as shown in Figure 2.11 (b). Each capillary or channel functions as an independent secondary electron multiplier and they form together a two-dimensional secondary electron multiplier.27 For the purpose of increasing the electron gain, two MCPs are often sandwiched together so that the small angles oppose each other (Chevron configuration) to obtain gains of 106-107, which is used in our experiment. A stacking of three MCP’s (Z-stack configuration) will be up to gains of 108
. These three types of MCP are showed in Figure 2.12.
(a)
(b)
16
Figure 2.12. Multichannel plates arrays: Single, Chevron (double or V-stack) and z-stack configuration.
2.8 Time-of-Flight Mass Spectrometer
The time-of- flight (TOF) mass spectrometer (MS) is used to detect and identify the species in our experiments. TOF-MS operate on the simple principle that ions of different mass-to-charge (m/z) ratios, but equal kinetic energy, when projected into an electric field free region, will separate according to their
m/z ratios.29 Since charge is nominally unity, the separation occurs as a function of mass, which is described in equation 2.3
Ekin = ezU = 1/2 mv 2
(2.3)
Then, the velocity can be expressed as
m ezU
v 2 (2.4)
If the ions travel a known distance s to a detector, then the TOF is given by the expression 2.5
t
s
m
ezU
v
2
(2.5)where e is the electronic charge, z the ion charge, U the accelerating voltage, m the ion mass, and t the flight time. In this case, with the same Ekin the flight time is proportional to the square root of the ion m/z
17
Figure 2.12. Schematic overview of orthogonal time-of-flight mass spectrometer.30
The time-of-flight mass spectrometer utilized in our experiments has an orthogonal configuration,24,29 which is shown in Figure 2.12. The ions produced at low pressure expand continuously into a vacuum chamber by means of a 3-step differential pumping system. Several ion optical lenses collimate the continuous ion beam into an extraction region that consists of several electrodes. The ions enter a field free extraction region. Ions of all masses, which have the same velocity, cross this region without experiencing any electrical force. When an electrical pulse or bias is supplied to the back electrode, the ions in the extraction region are accelerated in a direction perpendicular to the original axis of the beam in the vacuum chamber. Repeating this pulse periodically, ion packets are generated at the repetition rate of the pulse. The ions are further accelerated by a constant electrical field into a field- free region (flight tube) and then are mass analyzed according to the equation 2.5.
2.9 References
(1) Osborn, D. L.; Zou, P.; Johnsen, H.; Hayden, C. C.; Taatjes, C. A.; Knyazev, V. D.; North, S. W.; Peterka, D. S.; Ahmed, M.; Leone, S. R. Rev. Sci. Instrum.2008, 79, 104103/1.
(2) Richard G. Morton; Partlo, W. N. US Patents 2000, US 6067311 A. (3) Kim, J.-S. US Patents:US 7426229 B22006.
(4) Koerber, K.; Kulik, C.; Springer GmbH: 2005, p 33.
(5) McNaught, A. D.; Wilkinson, A. IUPAC. Compendium of Chemical Terminology, 2nd ed
by Blackwell Scientific Publications, Oxford1997.
(6) Basting, D.; Marowsky, G. Excimer Laser Technology. Springer: 2005.
(7) Salikeev, S.; Burmistrov, A.; Bronshtein, M.; Fomina, M. Vak. Forsch. Prax.2014, 26, 40.
(8) Burgmann, W.; Goehler, K. Metallurgist (N. Y., NY, U. S.)2013, 57, 516.
(9) Hermann Adam ; Alfred Bolz; Hermann Boy; Heinz Dohmen; Karl Gogol; Wolfgang Jorisch; Walter Mönning; Hans-Jürgen Mundinger; Hans-Dieter Otten; Willi Scheer; Helmut Seige; Wolfgang Schwarz; Klaus Stepputat; Dieter Urban; Heinz-Josef Wirtzfeld; Zenker, H.-J. Fundamentals
of vacuum technology1998.
(10) R. Y. Jou; S. C. Tzeng; Liou, a. J. H. International Journal of Rotating Machinery2004,
18
(11) Yau, P. M.; Patil, A. N. R&D (Cahners)2000, 42, 80. (12) Anon R&D (Cahners)1997, 39, 55.
(13) Lafferty, J. M., ed Foundation of Vacuum Science and Technology1998, Wiley.
(14) Albert Thompson; David Attwood; Eric Gulllikson; Malcolm Howells; Kim, K.-J.; Kirz, J.; Kortright, J.; Winick, H.; Lindau, I.; Liu, Y.; Pianetta, P.; Robinson, A.; Scofield, J.; Underwood, J.; Williams, G. X-ray data booklet2009, Center for A-ray optics and Advanced Light Source.
(15) Berhardt, K.-H. Vacuum Technology2008, Braunfels, Germany: Pfeiffer Vacuum
GmbH. .
(16) Selph, F.; Massoletti, D.; IEEE: 1991; Vol. 5, p 2978.
(17) Rosfjord, K. M.; Liu, Y.; Attwood, D. T. IEEE J. Sel. Top. Quantum Electron.2004, 10, 1405.
(18) Hofmann, A. The Physics of Synchrotron Radiation; Cambridge Univ. Press, 2004. (19) Mossessian, D. A.; Heimann, P. A. Rev. Sci. Instrum.1995, 66, 5153.
(20) http://www-als.lbl.gov/index.php/beamlines/beamlines-directory.html.
(21) Lide, D. R. Ionization potentials of atoms and atomic ions in Handbook of Chem and Phys1992, 10, 211.
(22) Weitzel, K. M.; Mahnert, J.; Penno, M. Chem. Phys.Lett.1994, 224, 371.
(23) Wetzel, R. C.; Baiocchi, F. A.; Hayes, T. R.; Freund, R. S. Phys Rev.A1987, 35, 559. (24) Kelly, R. L. J. Phys. Chem. Ref. Data, Suppl.1987, 16, 1.
(25) applications, C. e. m. h. f. m. s. Photonis.
(26) Gross, J. B. Mass Spectrometry. A textbook from Springer. Berlin2004. (27) Hamamatsu Technical Information.
(28) http://www.rmjordan.com/mcpdetector.html.
Chapter 3. Theory and Methodology 3.1 Introduction
The aim of our research is to characterize intermediates and final products of low temperature oxidation of biofuels using Synchrotron Photoionization Mass Spectrometry, investigate the kinetics properties of the reaction, and probe the possible reaction pathways. From the generation of photons to the kinetics calculations, many concepts and analysis methods are involved, such as radical, photoionization, absolute cross section, Frank-Condon Principle, photoionization spectrum, and electronic structure calculations, just to mention a few.
In this chapter, these concepts and analysis methods will be introduced. The data acquisition and analysis programs will also be briefly discussed.
3.2 Radical
A radical is a neutral reactive intermediate with unpaired electrons. Radicals are usually formed from breaking a covalent bond by means of heat or electromagnetic radiation. Radicals are generally highly reactive and, therefore, unstable with a very short lifetime. Nevertheless, they are key reactive
intermediates in both combustion and atmospheric chemistry.1
There are several ways to form radicals: photolysis, photoionization, photodissociation, electron
impact, and reaction with some chemical agents.2 In our experiments, the formation of radicals is
crucial to initiate reactions. Cl* and OH* radicals are the most used by photolysis of Cl2 and H2O2,
respectively, through 355 nm and 248 nm lasers.3,4
(3.1)
(3.2)
(3.3)
(3.4)
(3.5)
As an example, the Cl initiated reaction with methane is presented in the scheme above. Step 3.1 is
the initiation step, ultraviolet light provides sufficient energy to split the chlorine molecule bond and leave two chlorine atoms with an unpaired electron. Steps 3.2 and 3.3 are the propagation steps, where reactive intermediates react with stable molecules to generate other reactive intermediates. Cl* radical
abstracts a hydrogen from CH4 to form a methyl radical CH3*; CH3* abstracts a Cl atom from Cl2 to
form CH3Cl and another Cl*. Steps 3.4 and 3.5 are referred to as termination steps, in which usually
two reactive intermediates combine into one stable molecule to terminate the reaction.5
3.3 Ionization and dissociation energy
Mass spectrometry is a very powerful technique for identifying unknowns, and studying molecular structures. The identification of species is based on the ions separation based on their
mass-to-charge ratio (m/z). There are several ways to generate ions: electron ionization, chemical
ionization, negative-ion chemical ionization, field desorption, particle bombardment, electrospray
ionization, and photoionization.6 However, photoionization is one of the classic methods and is also
the method we utilized in our experiments, which will be introduced further below.
Photoionization is based on the well-known photoelectric effect. It occurs when electrons are removed from an atom or molecular species by absorption of photons of visible or ultraviolet light. More commonly, the species we are dealing with are ionized in the vacuum ultraviolet (VUV) range
Of 7.2– 25 eV.7
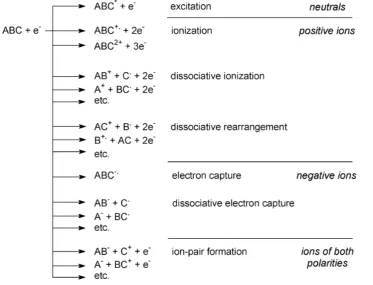
Figure 3.1. Possible processes under electron ionization conditions.2
The ionization process can produce different types of ions or fragments as shown in Figure 3.1 depending on the photon energy the atoms or molecule absorb. It can produce a molecular ion, which will have the same molecular weight and elemental composition of the starting analyte, while the
amount of energy required to remove an electron from isolated molecular or atoms in the gaseous state is its ionization energy:
AB + h
υ
AB+ + e- (3.6)Computationally (see later), the ionization energy of the species AB [IE(AB)] is equal to
IE(AB) = E(AB+) – E(AB) = ∆fHo(AB+) – ∆fHo(AB) (3.7)
where E is the total electronic zero-point corrected energy, and ∆fH
o
is the standard enthalpy of formation. If both the neutral and cation are in their ground state this quantity is called adiabatic ionization energy (AIE). Ionization can also produce a fragment ion, which corresponds to a smaller
piece of the analyte molecule, while bond dissociation energy is involved.2 In this case the energy at
which the fragment or daughter ion appears is called the appearance energy (AE). The bond
dissociation energy is defined as the standard enthalpy Do change of the following fission:
A B A + B (3.8)
Do is usually derived by the thermochemical equation 3.9
Do(A−B) = ∆fH
o
(A) + ∆fH o
(B) – ∆fH o
(AB) (3.9)
The relationship between ionization energy (IE) and dissociation energy (Do) is illustrated in the
Figure 3.2 showing the formation of AB+ and AB in a cycle, then using different expressions we can
get the connection between Do and IE.
Figure 3.2. Formation Cycle for reactions of AB.
From equations 3.7 and 3.9, we have
IE(AB) = E(AB+) – E(AB) = ∆fH
o
(AB+) – ∆fH o
(AB)
IE(B) = E(B+) – E(B) = ∆fH
o
(B+) – ∆fH o
(B)
Do(A−B) = ∆fH
o(A) + ∆
fH
o
(B) – ∆fH o
(AB) Do(A−B+) = ∆fH
o(A) + ∆
fH
o
(B+) – ∆fH o
(AB+)
Then, we can obtain the relationship of Do and IE as shown in equation 3.10.
AB + (∆ f H o (AB + )) AB (∆ f H o (AB)) A (∆ f H o (A)) B + (∆ f H o (B + ))
A (∆
f
H
o
(A)) B (∆
Do(AB) = Do(AB+) + IE(AB) - IE(B) ( 3.10)
3.4 Photoionization Cross Section
Photoionization cross section is the effective area in which there is the greatest probability to ionize the species at a given energy. It describes an area through which the electron must travel in order to effectively escape the neutral, therefore, photoionization cross section is often given in units
of megabarns (Mb = 10-18 cm2).8
When an atom or molecule gets excited by photoabsorption, the total photoabsorption cross section (σabs
T
) is given by:
σabs
T = σ
n+ σion
T
(3.11)
where σn is cross section for neutral processes and σionT is the total photoionization cross section9.
While the relation between σion
T and σ abs
T
can also be defined as:
σion T
= Γσabs T
(3.12)
where Γ is the total photoionization efficiency or quantum yield10 given by:
=
Γ 𝑁𝑁𝑁𝑁𝑁𝑁𝑁𝑁𝑁𝑁𝑁𝑁𝑜𝑜𝑜𝑜𝑖𝑖𝑜𝑜𝑖𝑖𝑖𝑖𝑖𝑖𝑖𝑖𝑖𝑖𝑖𝑖𝑁𝑁𝑒𝑒𝑁𝑁𝑖𝑖𝑒𝑒𝑒𝑒/𝑒𝑒
𝑁𝑁𝑁𝑁𝑁𝑁𝑁𝑁𝑁𝑁𝑁𝑁𝑜𝑜𝑜𝑜𝑝𝑝ℎ𝑜𝑜𝑒𝑒𝑜𝑜𝑖𝑖𝑒𝑒𝑎𝑎𝑁𝑁𝑒𝑒𝑜𝑜𝑁𝑁𝑁𝑁𝑁𝑁𝑎𝑎/𝑒𝑒 (3.13)
The photoionization cross section at a certain frequency
υ
is expressed as
υ
π
σ
υd
df
mc
e
p 2 2,
=
(3.14)or 2 2 3 ,
'
3
8
Mif
h
cg
e
i pυ
υ
π
σ
υ=
(3.15)where f is the optical oscillator strength,h
υ
' is the photon energy passed the ionization threshold andgi is the statistical weight of the initial discrete state. The matrix element is defined in terms of
continuous wave functions as follows:
Mif
=
∑
i
∑
f
∫
ψ
f*∑
µψ
id
υ
2 2
(3.16)
However, since it is difficult to get accurate electronic wave functions, it is difficult to calculate photoionization cross sections for complicated atoms, not even mention the lager molecules like ethyl tert-butyl ether (ETBE) and isooctane. Recently, Anna Krylov and her coworkers proposed that with a modified central potential model that accounts for the nonspherical charge distribution of the core, using approximate treatments of the photoelectron wave function, plane and Coulomb waves, the
accurate molecular photoionization cross sections could be computed.11 Meanwhile, the
semi-empirical model by Bobeldijk12 is utilized to estimate the absolute photoionization cross section.
A molecule’s photoionization cross section is found through the summation of the cross sections of its component atoms or groups of atoms, and this model reproduces the molecular ionization cross
sections within 20%.12 Bobeldijk also mentioned that this approximation tends to breakdown to the
vicinity of the ionization energy threshold.12
The cross section is important to determine the product concentrations and calculate the branching ratio and branching fraction of a specific mass product and its isomers. Usually absolute or total photoionization cross sections are obtained by taking the photoionization spectrum of a target species at a known concentration with a calibration species, which has a known photoionization cross
section at a specific photon energy. The concentration of a species Cp is related to the photoionization
cross section (
σ
) by the following relationship:Sp(E) = k
σ
p(E)δ
pCp (3.17)where Sp(E) is the ion signal of the species p at a specific energy E in the photoionzation spectra, k the
instrument constant, and
δ
p the mass-dependent response of the species p, which in the currentinvestigation is approximately equal to the mass (m) of the observed species to the power of 0.67.13
When the
σ
p(E) is calculated, the branching fraction, BF, can be obtained by relating the ion signalsof the product P and the reactant R at the specific photon energy E as
𝐵𝐵𝐵𝐵𝑃𝑃= 𝐶𝐶𝑃𝑃 𝐶𝐶𝑅𝑅= ⎣ ⎢ ⎢ ⎢ ⎡ 𝑆𝑆𝑃𝑃(𝐸𝐸) 𝜎𝜎𝑃𝑃(𝐸𝐸)𝛿𝛿𝑃𝑃 � ⎦ ⎥ ⎥ ⎥ ⎤ ⎣ ⎢ ⎢ ⎢ ⎡ 𝑆𝑆𝑅𝑅(𝐸𝐸) 𝜎𝜎𝑅𝑅(𝐸𝐸)𝛿𝛿𝑅𝑅 � ⎦ ⎥ ⎥ ⎥ ⎤= 𝑆𝑆𝑃𝑃(𝐸𝐸)𝜎𝜎𝑅𝑅(𝐸𝐸)𝛿𝛿𝑅𝑅 𝑆𝑆𝑅𝑅(𝐸𝐸)𝜎𝜎𝑃𝑃(𝐸𝐸)𝛿𝛿𝑃𝑃 �𝑚𝑚 𝑅𝑅 𝑚𝑚 𝑃𝑃
� �0.67 (3.18)
The ion signal, at the specific photon energy E, is chosen at a plateau or constant ion signal of the photoionization spectrum, which is done to minimize error due to experimental signal fluctuations. A plot of photon energy against photoionization cross-section is called absolute photoionization spectrum or absolute PI curve, which, if unknown, can be obtained by comparing the species pure sample experimental PI spectrum with a known concentration to the absolute photoionization cross-section of a reference species, such as propene in this work. The absolute cross-section of
propene used as a reference was recorded by Person and Nicole.14
3.5 Frank-Condon Principle
A molecule at room temperature normally resides in its ground electronic (S0) and lowest
vibrational state (
ν
=
o
). A ground-state molecule absorbs a photon and undergoes a transition to itsexcited state (S1). Once a molecule is in this excited vibronic state, it immediately relaxes back down
to the lowest vibrational level in the S1 state by releasing energy. After a delay the electron relaxes
back down to its ground electronic state S0. But similar to absorption, this relaxation to S0 can occur
between the lower vibrational states (ν) and if the transition occurs between the molecular ground
state and ionic ground state, the energy required is the minimum and is known as adiabatic ionization energy (AIE).
Since nuclei can be considered massive compared to the electron and the ionization occurs in a very short time scale, the position of the nuclei of the target molecule does not change when a vertical electronic transition happens. Frank–Condon (FC) Principle states that when a molecule is ionized by photons or by interaction with energetic electrons, the highest probability configuration of the resulting ionic states will be the one identical to the original neutral molecule. In quantum mechanical terms, the Frank–Condon principle states that the molecule will undergo a transition to the upper vibrational state that most resembles the vibrational wave function of the vibrational ground state of the lower electronic state, as shown in Figure 3.3 (a). The degree of the overlap of the two wave
functions is defined by the Frank–Condon factor.15
(a)
(b)
Figure 3.3. (a)Illustration of the transitions from the neutral to the ionic state for a diatomic
molecule AB; (b) Schematic distribution of Frank–Condon factors, fFC, for various transitions.
2
An electrical dipole transition from the initial vibrational state (
υ
)
of the ground electronic level(
ε
) to its vibrational state (υ
') of an excited electronic state(ε
') occurs when there is a change in thedipole moment. The molecular dipole operator
µ
is determined by the charge (-e) and location (ri)of the electrons and the charges (+Zje) and locations (Rj) of the nuclei (electron dipole moment µe and
nuclear dipole moment µN):
=
+
=
−
∑
+
∑
j j j i i Ne
µ
e
r
e
Z
R
µ
µ
(3.18)
The probability amplitude P for the transition between these two states is given by:
∫
=
=
ψ
µ
ψ
ψ
µψ
d
τ
P
'
'*
(3.19)where
ψ
andψ
'
are the overall wavefunctions of the initial and final state, respectively. Theoverall wavefunction can be expressed approximately as product of the individual vibrational (depending on spatial coordinates of the nuclei), electronic, and spin wavefunctions:
ψ
=
ψ
eψ
υ
ψ
s (3.20)According to the Born-Oppenheimer approximation, then
∫
∫
∫
∫
∫
∫
∫
∫
∫
+
=
+
=
+
=
=
s s s N e e e s s s e e e n s e N s e s e e s e N e s e s e s ed
d
d
d
d
e
d
d
d
sd
e
P
τ
ψ
ψ
τ
ψ
µ
ψ
τ
ψ
ψ
τ
ψ
ψ
τ
ψ
µ
ψ
τ
ψ
ψ
τ
ψ
ψ
ψ
µ
ψ
ψ
ψ
τ
ψ
ψ
ψ
µ
ψ
ψ
ψ
τ
ψυψ
ψ
µ
µ
ψ
ψ
ψ
ψ
ψ
ψ
µ
ψ
ψ
ψ
υ υ υ υ υ υ υ υ υ υ υ υ'*
'*
'*
'*
'*
'*
'*
'*
'*
'*
'*
'*
)
(
*
*
*
'
'
'
The first integral after the plus sign is equal to zero because electronic wavefunctions of different states are orthogonal, so
P =
∫
ψ
'*υψ
υdτ
n∫
ψ
'*eµ
eψ
edτ
e∫
ψ
'*sψ
sdτ
s (3.21)Here the first integral
∫
ψ
'*υψ
υdτ
υ is the Frank-Condon factor, which represents the vibrationaloverlap in quantum mechanics, the second integral
∫
ψ
'*eµ
eψ
edτ
e represents the orbital selection rule,and the third integral
∫
ψ
'*sψ
sdτ
s is the spin selection rule quantum expression.16The quantum mechanical formulation of Frank–Condon principle is the result of a series of approximations, principally the electrical dipole transition assumption and the Born-Oppenheimer approximation. For any given transition, the P value is determined by all of the selection rules; however, spin selection is the largest factor, followed by electronic selection rule. The Franck–
Condon factor modulates the relative intensity of the transitions.17
3.6 Photoionization Spectra
In our experiments at the Advanced Light Source, due to the multiplex capability of the apparatus a three-dimensional (3D) data block is obtained, where the ion signal is a function of m/z, reaction time (t), and photon energy (E). Visualization is accomplished by two-dimensional orthogonal slicing of the data by integrating over the desired range of the third dimension. For example, integration over 20-90 ms gives a 2-D plot of intensity as a function of photon energy and mass-to-charge ratio. The
photoionization spectrum of the specific mass will be gotten by integrating a photoelectron spectrum at a specific mass. Using the one-dimensional plot of ion signal as a function of synchrotron energy (photoionization energy of target molecule), the isomeric composition at a specific mass-to-charge ratio will be gotten as shown in Figure 3.4.
Figure 3.4. Literature PI curve of formaldehyde superimposed (black solid line) onto the experimental
m/z = 30 for the reaction of ETBE with Cl radical at RT.
As shown in Figure 3.4, the ionization threshold is the point at which there is enough kinetic energy for the electron to be able to escape and it is known as adiabatic ionization energy (AIE). The shape of the curve is determined by the overlap of the vibronic wavefunctions of the initial (neutral) and final (cation) electronic states, which are known as Franck-Condon factors. If the vibronic wavefunction overlap between two electronic states is good (very similar geometries of the initial and final states), the PI spectra produced would have a steeper signal increase at the threshold. Otherwise, the PI spectra would present a gentler increase. Comparison of experimental spectra with literature and/or calculated plots is a very important method for the identification of potential products in our experiments.
3.7 Electronic Structure Calculations
Electronic structure calculations are performed routinely for data analysis in our research. The two
systems, ethyl tert-butyl ether (ETBE) and isooctane, were studied using the Gaussian 09 program18 by
several different levels of theories and basis sets. The CBS-QBS composite method12,19 is employed to
obtain optimized molecular structural parameters, such as bond lengths, bond angles, harmonic vibrational frequencies, force constants, ionization energies, and transition state characterization. The Gaussian program is also used to calculate Franck-Condon (FC) factors for the transition between the ground vibronic states of the neutral and cation to generate a photoelectron spectrum, which can be integrated into simulated photoionization spectra by Igor software.
3.7.1 Density-Functional Method
Density functional theory (DFT) provides a powerful tool for investigating the properties of the ground state molecule structures according to the functional of the spatially dependent electron density.
DFT is constructed based on two Hohenberg-Kohn theorems.20 The first Hohenberg-Kohn theorem
states that an electron density depending on three spatial coordinates determines the ground state
properties of a many-electron system.21 The second Hohenberg-Kohn theorem gives the definition of an
energy functional for the system and confirms that the correct ground state electron density minimizes
this energy functional.22 Kohn and Sham adapted DFT into a practical version,23,24 which describes the
mathematics of electron densities and their subsequent correlations to molecular energies as shown following:
EDFT[
ρ
]=T[ρ
]+Ene[ρ
]+J[ρ
]+Exc[ρ
] (3.22)where E is the total energy, T the electron kinetic energy, Ene the nuclear-electron attraction (Coulombic)
energy, J the electron-electron repulsive (Coulombic) energy, and Exc the electron-electron
exchange-correlation energy, which is the result of unknown interactions between the electrons and is
the most important effect limiting the accuracy of DFT.23,25-28 Each of these terms is a function of the
electron density
ρ
, which is a function of the three positional coordinates (x, y, and z) itself.The B3LYP method is one of the DFT methods used most in our work. B3LYP is one of the hybrid functionals, which combines the local gradient-corrected correlation-energy functional of
Lee-Yang-Parr (LYP) with Hartree-Fock theory.28,29
3.7.2 Complete-Basis-Set method
A basis set in theoretical and computational chemistry is a set of functions, which correspond to linear combinations of electronic wavefunctions and define the space of a range of atoms, to create the molecular orbitals. Generally there are four types of basis sets:
(1) Minimal: in which a single basis function is used for each orbital in a Hartree-Fock calculation
for each atom in the molecule. Slater-type orbitals, STO-nG, is the most common minimal basis, where n is an integer and represents the number of Gaussian primitive functions comprising a single basis function.
(2) Double zeta/triple zeta: with the minimal basis sets, all orbitals are approximated to be of the
same shape, which is not accurate. The double-zeta basis set treats each atomic orbital as the sum of the two Slater-type orbitals (STOs). One set is closer to the nucleus with larger exponents, the other is further from the nucleus with smaller exponents. The triple zeta basis sets use three Slater-type orbitals instead of two, which results in better accuracy but is more time-consuming.
(3) Split valence: since the inner-shell electrons are not as vital to the calculation, the core orbitals
are still represented by a minimal basis, only the valence part of the basis set is calculated using double, triple, quadruple-zeta basis sets. When higher angular momentum functions are added, for example d-functions to carbon atoms or p-functions to hydrogen atoms, angular flexibility will be allowed. Diffuse functions with small exponents added are usually applied to anions.
6-311+G is the basis set used mostly in this thesis, where “6” means that six contracted Guassian basis functions are used to approximate the core atom orbitals, “3” suggests that inner
components of valence atom orbitals are expressed with three contracted Guassian functions, “1” indicates outer component is presented by one Gaussian function, “+” implies a highly diffuse function (anions, compounds with lone pairs, and hydrogen-bonded dimers have significant electron density at large distances from nuclei) with a very small orbital exponent.
(4) Correlation-consistent basis set, which are designed to converge systematically using empirical
extrapolation techniques.
Complete-Basis-Set (CBS) models involve low-level (Self-consistent field method (SCF)) calculations on large basis sets, mid-sized sets for second-order corrections, and small sets for high
level corrections. CBS models are developed to compensate the limits of DFT30 (incomplete treatment
of dispersion) and coupled-cluster method (insufficient accuracy or relatively inexpensive for big system), such as CCSD, and to get a more accurate energetic result. CBS-QB3 is the method used most
in our work. CBS-QB3 is developed by Petersson and his coworkers19,31-37, and involves the following
steps:
I) B3LYP/6-311G(2d,d,p) geometry optimization.
II) B3LYP/6-311+G(2d,d,p) frequencies with a 0.99 scale factor for the ZPE (
∆
EZPE).III) Unrestricted Moller-Plesset UMP2/6-311+G(3d2f,2df,2p) energy (EMP2) and CBS extrapolation.
IV) MP4(SDQ)/6-31+G(d(f),p) energy (
∆
EMP4).V) CCSD(T)/6-31+G+ energy (
∆
ECCSD(T)).Finally, the total energy ECBS-QB3 and free energy GCBS-QB3 are calculated as:
ECBS-QB3=EMP2+
∆
EMP4+∆
ECCSD(T)+∆
EZPE+∆
ECBS+∆
Eemp+∆
Eint (3.23)GCBS-QB3= EMP2+
∆
EMP4+∆
ECCSD(T)+∆
Ethermalcorrection+∆
ECBS+∆
Eemp+∆
Eint (3.24)where
∆
ECBS is the energy corrected for the basis set truncation error in the second-order energies.31
3.7.3 Transition State Calculation methods
Transition state is defined as the state corresponding to the highest potential energy along the
reaction coordinate, which is critical to understand and estimate a given chemical reactions.38 At the
transition state, one vibrational normal mode, which aligns with the nuclear motion along the reaction coordinate, should have a negative force constant. This translates in the corresponding vibrational frequency to have an imaginary value. This provides an important criterion for transition states: there
is one and only one negative eigenvalue for the Hessian matrix.39
Three-dimensional geometries of transition states now can be visualized explicitly as those of the saddle points located by systematic computation of potential-energy surfaces. Furthermore, the
activation barrier can be evaluated accurately. Within the Gaussian 09 program, three ways are used to optimize transition state structures in our work:
I. Using Opt = TS. The input geometry has to be a good initial guess geometry for the transition structure. The input file is a guess structure for the transition state. If the geometry is feasible, the calculation will present the optimized structure with an imaginary frequency proving that it is a first-order saddle point.
II. Using Opt = QST2. Finding the good guess for the right transition state structure may be difficult. QST2 method will help generating the guess geometry. The input file includes two title and molecule specification sections, which are the optimized reactant and product geometries, respectively. The program will calculated a possible transition state between these two.
III. Opt = QST3 is used in more difficult cases. The input file will supply optimized geometries of both reactant and product, and a guessed transition state structure calculated by the TS method.
3.8 Data Analysis.
Our experiments are carried out at the ALS located in the Lawrence Berkeley National Laboratory. The ion intensity, reaction time, photoionization energy, and mass-to-charge ratio of the reaction species (reactants, products, and intermediates) are recorded by a multiplexed time- and
energy- resolved mass spectrometer. The ion intensity is plotted against reaction time (t), m/z, and E,
then a 3-D “picture” of the reaction will be observed. Whereas 3-D data is not directly used for the analysis due its complexity, 2-D “slices” are employed. The 2-D slices plots are the combinations of photon energy (E), mass-to-charge (m/z), and the time (ms). The upper right corner of Figure 3.5 is a 2-D plot of intensity as a function of photon energy E and mass-to-charge integrated. Other useful 2-D plot is the intensity as a function of time and mass-to-charge obtained by integration over a desired photon energy E range as shown at the bottom right corner of Figure 3.5.
Figure 3.5. Overview of relationship between 3-D data block and 2-D slices.
1-D slice photoionization energy vs. intensity for each mass is also known as the photoionization spectrum. The photoionization energy is the energy required to move the outermost electrons from a neutral molecular species. The photoionization spectrum is characteristic for each
species. An unknown can be identified based on its m/z and by comparing its PI spectrum to a
literature or computed photoionization curve. In Figure 3.6 the red open circles represent the
experimental PI spectrum of m/z = 58 unknown, the blue solid line is the PI curve of acetone from the
literature40, the green solid line is the PI spectrum of propanal recorded by Cool,41 and the yellow
solid line is the literature PI curve of glyoxal.42 The black solid line is the sum of these three literature
spectra and when superimposed onto the experimental data match the overall shape. In this case, the
m/z = 58 unknown can be identified as a mixture of acetone, propanal, and glyoxal.
Figure 3.6. Experimental photoionization spectrum at room temperature of m/z = 58 superimposed
onto the integrated photoelectron spectra of some m/z = 58 isomers in the ETBE+Cl+O2 reaction.
In 2-D time and m/z “slices,” which are the ion intensity plotted against reaction time and m/z,
the consumption of reactants and formation of products can be observed. 1-D “slices,” which are the
ion intensity vs. reaction time for a chosen m/z, show time traces of specific species providing
indications on its “nature,” i.e., reactant (depletion), product (formation), primary product (fast formation comparable to the depletion time of the reactant), secondary product (slower formation when compared to the depletion time of the reactant), and radical (fast formation followed by a fast
decay). Figure 3.7 is the time trace of m/z = 58, from which we can infer that this m/z consists of
primary products. Coupling the time trace with the results obtained from the photoionization spectra shown in Figure 3.6, acetone, propanal and glyoxal are considered to be primary products of in the
ETBE+Cl+O2 reaction at 293 K.