Ames Laboratory Publications
Ames Laboratory
7-31-2008
Pressure Induced Superconductivity in CaFe2As2
Milton S. Torikachvili
San Diego State University
Sergey L. Bud'ko
Iowa State University, [email protected]
Ni Ni
Iowa State University
Paul C. Canfield
Iowa State University, [email protected]
Follow this and additional works at:
http://lib.dr.iastate.edu/ameslab_pubs
Part of the
Condensed Matter Physics Commons
The complete bibliographic information for this item can be found at
http://lib.dr.iastate.edu/
ameslab_pubs/203
. For information on how to cite this item, please visit
http://lib.dr.iastate.edu/
howtocite.html
.
Abstract
CaFe2As2 has been found to be exceptionally sensitive to the application of hydrostatic pressure and can be tuned to reveal all the salient features associated with FeAs superconductivity without introducing any disorder. The ambient pressure, 170 K, structural/magnetic, first-order phase transition is suppressed to 128 K by 3.5 kbar. At 5.5 kbar a new transition is detected at 104 K, increasing to above 300 K by 19 kbar. A low temperature, superconducting dome (Tc∼12 K) is centered around 5 kbar, extending down to 2.3 kbar and up to 8.6 kbar. This superconducting phase appears to exist when the low pressure transition is suppressed sufficiently, but before the high pressure transition has reduced the resistivity too dramatically.
Keywords
Physics and Astronomy
Disciplines
Condensed Matter Physics
Comments
This article is fromPhysical Review Letters101 (2008): 057006, doi:10.1103/PhysRevLett.101.057006.
Pressure Induced Superconductivity in
CaFe
2As
2Milton S. Torikachvili
Department of Physics, San Diego State University, San Diego, California 92182-1233, USA
Sergey L. Bud’ko, Ni Ni, and Paul C. Canfield
Ames Laboratory, U.S. DOE and Department of Physics and Astronomy, Iowa State University, Ames, Iowa 50011, USA
(Received 3 July 2008; published 31 July 2008)
CaFe2As2 has been found to be exceptionally sensitive to the application of hydrostatic pressure and
can be tuned to reveal all the salient features associated with FeAs superconductivity without introducing any disorder. The ambient pressure, 170 K, structural/magnetic, first-order phase transition is suppressed to 128 K by 3.5 kbar. At 5.5 kbar a new transition is detected at 104 K, increasing to above 300 K by 19 kbar. A low temperature, superconducting dome (Tc12 K) is centered around 5 kbar, extending down to 2.3 kbar and up to 8.6 kbar. This superconducting phase appears to exist when the low pressure transition is suppressed sufficiently, but before the high pressure transition has reduced the resistivity too dramatically.
DOI:10.1103/PhysRevLett.101.057006 PACS numbers: 74.10.+v, 74.62.Fj, 74.70.Dd
Superconductivity has been stabilized in iron arsenide based compounds by fluorine doping,RFeAsO1xFx [1], oxygen depletion,RFeAsO1x [2], and potassium doping, Ba1xKxFe2As2 andSr1xKxFe2As2 [3,4] with transition
temperatures (Tc) in excess of 50 K for F-doped/ O-depleted members of theRFeAsOseries andTc values approaching 40 K for K-dopedAFe2As2(ABa, Sr). The
facts that (i) such high transition temperatures have been found in two distinct families of FeAs-based compounds, (ii) these compounds all manifest a structural phase tran-sition that is suppressed by doping, and (iii) doping is necessary to stabilize superconductivity, have given rise to a feeling that these FeAs compounds need to be finely tuned so as to create this intriguing, superconducting state. The recent discovery ofCaFe2As2 [5], a previously un-known member of the I4=mmm, AFe2As2 family [6] has expanded the isostructural series of alkali earth iron arsen-ides to three: ACa, Sr, Ba [5,7,8]. The structural phase transition from the high temperature, tetragonal phase to the low temperature orthorhombic phase is unambiguously first order inCaFe2As2 and occurs near 170 K with a 2 K
hysteresis width [5]. This transition is accompanied by a first order transition to a low temperature commensurate antiferromagnetic state [9]. In addition, it has been found that for sodium doping, Ca1xNaxFe2As2, the structural
phase transition is suppressed and superconductivity can be established withTc values close to 20 K [7].
Whereas chemical substitution is a convenient method for changing the properties of a compound, it inevitably changes many of the physical parameters in a multitude of uncontrollable ways. The existing data set on supercon-ductivity in iron arsenide compounds is intriguing, com-pelling, and exceedingly complex due to the many changes brought on by doping. There is a growing need to find a system that can be tuned in a more systematic fashion, but that still manifests the salient physics. In this Letter we establish pureCaFe2As2 as just such a system. The
appli-cation of very modest hydrostatic pressures (P <5 kbar) suppresses the high temperature tetragonal to orthorhom-bic phase transition. For higher pressures (P >5:5 kbar) a second phase transition, with a different resistive signature, is stabilized and increases rapidly with increasing pressure, with its transition temperature exceeding 300 K by 17 kbar. Nestled between these two, very pressure sensitive transi-tions is a dome like region of superconductivity with a maximum Tc value of 12 K centered close to 5 kbar. CaFe2As2, then, clearly shows that (i) superconductivity
can be stabilized without the complications associated with doping and (ii) superconductivity appears at the interface between the tetragonal to orthorhombic, structural (and antiferromagnetic) phase transition and a second phase transition of an as of yet unknown nature. As a result, CaFe2As2 may hold the key to understanding the nature and mechanism of superconductivity associated with the whole set of iron arsenide compounds.
Single crystals ofCaFe2As2were grown out of a Sn flux,
using conventional high temperature solution growth tech-niques as discussed in Refs. [5,10]. The temperature de-pendence of the in-plane resistivity was measured for various hydrostatic pressures below 20 kbar. Pressure was generated in a Teflon cup filled with Fluorinert FC-75 which was inserted into a nonmagnetic, piston-cylinder-type, Be-Cu pressure cell with a core made of NiCrAl (40 KhNYu-VI) alloy. The pressure was determined at low temperature by monitoring the shift in the Tcof pure lead [11]. Low temperature pressure values will be used throughout the text. Errors associated with the determina-tion of the low temperature pressure are 0:5 kbarand based on our experience with this cell, the higher tempera-ture transitions will have potential shifts in pressure on the order of 1 kbar. This uncertainty in pressure does not significantly affect any of our conclusions.
The temperature and magnetic field environment for the pressure cell was provided by a Quantum Design Physical
PRL101,057006 (2008) P H Y S I C A L R E V I E W L E T T E R S 1 AUGUST 2008week ending
Property Measurement System instrument. An additional Cernox sensor, attached to the body of the cell, served to determine the temperature of the sample for these mea-surements. The data presented were taken on cooling. The cooling rate was below 0:5 K=min, the temperature lag between the Cernox on the body of the cell and the system thermometer was<0:5 Kat high temperatures and 0.1 K or less below70 K. Below10 Kthe resistivity was mea-sured in a 250 Oe field so as to suppress the superconduc-tivity of traces of elemental Sn (residual flux).
Figure 1 presents the temperature dependent, basal plane, electrical resistivity of single crystalline CaFe2As2
for applied pressures ranging from near atmospheric to approaching 20 kbar. These data are remarkable in that there are three, very pressure dependent features that can be seen, all below 20 kbar. The first feature is the con-spicuous, discontinuous jump in electrical resistivity near 170 K seen in the ambient pressure resistivity. This feature has been clearly associated with a first order phase tran-sition from the high temperature, tetragonal phase to a low temperature, orthorhombic (antiferromagnetic) phase. As pressure is increased to 2.3 kbar this feature drops to 145 K and broadens but remains first order with the same 2 K thermal hysteresis. For the next pressure, 3.5 kbar, this feature drops further, to 130 K. It is im-portant to note that the resistivity ofCaFe2As2, well below
this transition (say between 20 and 50 K) is similar for each of these three data sets, suggesting that the nature of the low temperature state is similar.
The second conspicuous feature is the higher pressure transition that is most clearly seen in the 12.7 kbar data. For this pressure there is a dramatic drop in resistivity that starts below250 K. This feature can also be clearly seen for several pressures below 12.7 kbar and may also be present in the P16:8 kbar data set as well. This loss of resistivity transition is extremely hysteretic, manifesting up to30 Koffsets between warming and cooling scans. For P8:6 kbar and higher, the low temperature (i.e., sufficiently below the phase transition), temperature de-pendence of the resistivity is identical, again consistent with the low temperature state ofCaFe2As2being the same
forP8:6 kbar.
The P19:3 kbar data appear to represent a limiting curve for the high-pressure data, with the 5.5, 8.6, 12.7, and 16.8 kbar data increasingly falling upon it as the decrease in resistivity transition temperature is increased by increas-ing pressure. Figure1(b)presents the 19.3 kbar data as well as a fit to the form of0AT2for data between 15
and 100 K. Below 15 K the data manifest the shallow drop in resistivity seen in the ambient pressure as well as the P >8:6 kbar data (discussed below), for this reason the T <15 Kdata are excluded from this power-law parame-trization. The fit shown as a solid line in Fig.1(b)is rather good. The inset to Fig.1(b)is a log-log plot of the 19.3 kbar data (minus the0 term inferred above). These data show
that there is not perfect, power-law behavior, but that there
is a fair fit to these data between 10 and 300 K for 0ATn withn1:8.
The third feature is most clearly seen in Fig. 1(c). For pressures near 5 kbar there is a clear and complete super-conducting transition. The supersuper-conducting ground state is absent at ambient pressure and is also absent for pressures
FIG. 1 (color online). (a) The in-plane, electrical resistivity of
CaFe2As2 as a function of temperature for values of the low
temperature pressure, P0, 2.3, 3.5, 5.1, 5.5, 8.6, 12.7, 16.8, and 19.3 kbar. The downward and upward pointing arrows indicate the location of the upper transitions temperatures (see text). (b) The in-plane, electrical resistivity of CaFe2As2 as a
function of temperature for P19:3 kbar(symbols) and fit of data for 15 K< T <100 K to the form 0AT2 (solid
line, the fit results are 02:68 cm, A2:09
103 cm=K2). Inset: log-log plot ofT 0 data shown
for10 K< T <300 K. (c) Low temperature expansion of data shown in panel (a) shown on a semilog plot so as to clearly present details for all applied pressures despite a dramatic drop in the residual resistivity at higher pressures. Symbols are the same as those used in panel (a).
[image:4.612.355.516.49.445.2]greater than 8.6 kbar. Whereas this transition is complete (i.e., we measure zero resistivity at low temperature) for P3:5, 5.1, and 5.5 kbar, forP2:3and 8.6 kbar there is a sharp drop in resistivity that is highly suggestive of a superconducting phase transition, but the resistivity does not go completely to zero, even by 2.0 K. It is worth noting that the ambient pressure data, as well as the data forP > 8:6 kbar, manifest a broad down turn in resistivity forT < 10 K. The cause of this broad, gradual and only partial reduction of resistivity is, as of yet, unknown.
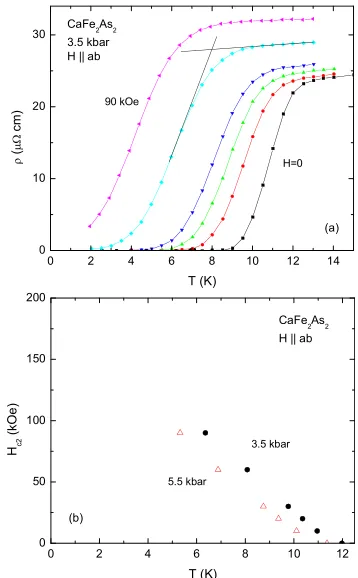
To more fully characterize the superconducting state, resistance data were collected for magnetic fields, H 90 kOe, applied perpendicular to the crystallographic c axis when P3:5 kbar. As can be seen in Fig. 2(a), there is a monotonic suppression of the superconducting transition, with modest broadening (from 2.5 K width in zero field to 4.0 K width in an applied field of 60 kOe). Using a resistive onset criterion [shown for the 60 kOe data in Fig.2(a)],Hc2T data can be inferred and are plotted in Fig.2(b). These data are consistent with a low temperature (T0)Hc2 value between 190 and 120 kOe, depending on the form of extrapolation or model used. Similar data were collected for P5:5 kbar (not shown) andHc2T
for this pressure are also presented in Fig.2(b). There is a slight downward shift inHc2T curve for the 5.5 kbar data
set, consistent with a slight decrease in the zero fieldTc value. Although these data are not conclusive proof that the low temperature state of CaFe2As2 for P3:5 and
5.5 kbar of hydrostatic pressure is superconducting, they are extremely compelling. Further measurements of either magnetization or specific heat under pressure will be needed to determine the superconducting fraction of the sample at these pressures.
The data in Fig.1can be summarized in theP-T phase diagram shown in Fig.3. The criteria used for determining the transition temperature for each phase transition do not change the qualitative nature of this figure, but they do affect the figure quantitatively. For this reason it is impor-tant to clearly outline each criterion. For the low-pressure, structural phase transition we use the high temperature, break in slope, indicated by the upward pointing arrows in Fig.1(a). For the high pressure, drop in resistivity transi-tion, we use the temperature at whichd=dTis maximum (maximum slope) to define the transition temperature, indicated in Fig. 1(a) by downward pointing arrows. For the superconducting phase transition, we use the onset criterion outlined in the discussion ofHc2and Fig.2.
The two, higher temperature, transitions are very pres-sure sensitive, with differing signs ofdTcrit=dP. The low-pressure, structural phase transition is suppressed at an initial rate of 12 K=kbar, with no clear feature of the transition being visible for P >3:5 kbar. The high-pressure, drop in resistivity transition temperature in-creases with increasing pressure at a rate of17 K=kbar forP >5:5 kbar. It is worth noting that neither phase tran-sition is seen in the 5.1 kbar data set, but also note that
given the opposite sign of the resistive anomalies, this may be a coincidence. In addition, it is also worth noting that there is no evidence of a crossing, of these two transitions; i.e., there is no evidence, in the transport data, that either phase transition exists as a lower phase transition, below a higher one.
In precisely the pressure region where the two high tem-perature phase transitions are either dropping to zero in a very nonlinear fashion or fading out or into each other, su-perconductivity can be detected at low temperature. The sharpest transitions are found for 3.5 and 5.1 kbar. The tran-sitions seen in the 2.3 and 8.6 kbar data have long, low tem-perature ‘‘feet’’ that extend to below our 2 K minimum temperature and are shown with an appropriate error bars in Fig.3. The position of the superconducting dome rela-tive to the two higher temperature phase transitions is even more clearly illustrated when the low temperature resistiv-ity as a function of pressure is examined in conjunction with the P-T phase diagram in Fig.3. The resistivity for T 15 K was chosen since it is well above the super-conducting transitions (as well as the broad downturns) and yet is in a fairly temperature independent, low temperature
FIG. 2 (color online). (a) Low temperature, in-plane, electrical resistivity of single crystalline CaFe2As2 for applied magnetic
field perpendicular to the crystallographic c axis, for P
3:5 kbar. Data sets for applied fields of 0, 10, 20, 30, 60, and 90 kOe are shown with an ‘‘onset criterion’’ forTcshown for the 60 kOe data set (see text). (b)Hc2T ofCaFe2As2 for applied
magnetic field perpendicular to the crystallographic c axis for P3:5 kbar(solid circles) and 5.5 kbar (open triangles).
PRL101,057006 (2008) P H Y S I C A L R E V I E W L E T T E R S 1 AUGUST 2008week ending
[image:5.612.347.526.44.333.2]residual resistivity region. For low pressures,P3:5 kbar, there is a gradual reduction of low temperature resistivity as pressure is increased. For3:5 kbar< P <8:6 kbarthere is a sharp decrease in the low temperature resistivity as pressure is increased, resulting in an over 5 times reduction in the low temperature resistivity between P3:5 and 8.6 kbar. ForP >8:6 kbarthe low temperature resistivity is essentially pressure independent and low. The super-conducting dome exists in precisely the pressure range that is associated with this dramatic decrease in low tem-perature resistivity (see inset to Fig. 3). To summarize: pressure induced superconductivity in the CaFe2As2 sys-tem only appears when (i) the structural (antiferromag-netic) phase transition has been dramatically reduced or fully suppressed, and (ii) when the higher pressure, loss of resistivity phase transition has not been too fully estab-lished at low temperatures, e.g., the reduction of resistivity associated with the higher pressure transition has not been completely realized.
Clearly the nature of the higher temperature phase tran-sitions will be key to understanding the mechanism for the superconductivity inCaFe2As2, and by analogy, for all of
the FeAs-based superconductors. The low-pressure phase transition is reasonably identified as a tetragonal to ortho-rhombic (and antiferromagnetic), structural phase transi-tion. The higher pressure transition, with its drop in resistivity, on the other hand, could have many origins: electronic, magnetic and/or structural. It appears though that going too far into this new phase is detrimental to superconductivity. With this in mind, then, one possible
interpretation of data presented in Fig. 3 is that super-conductivity exists when the structural (magnetic) phase transition is suppressed and there are still sufficient fluctu-ations or excitfluctu-ations to allow for the coupling or interac-tions required to allow Cooper pair formation. If these fluctuations or excitations are too fully removed, as mani-fest by too great of a reduction of the low temperature resistivity, then superconductivity does not persist.
It is not clear yet what precisely happens to the two, high temperature phase transitions in the vicinity of 5 kbar. It is possible that both transitions drop rapidly to zero, in which case theP-Tphase diagram shown in Fig.3bears a striking resemblance to a pressure induced quantum critical point. The superconducting dome being centered around the critical pressure is also consistent with this picture. Further data, perhaps from other measurement techniques, will be needed to clarify this key region of the phase diagram.
Speculation aside, it is manifestly clear that further study ofCaFe2As2under pressure holds great promise to unrav-eling the puzzles associated with superconductivity in FeAs compounds. Very modest changes in hydrostatic pressure move this compound from manifesting the te-tragonal to orthorhombic phase transition ubiquitous to theAFe2As2 (ACa, Sr, Ba) compounds, to manifesting
superconductivity below 12 K, to stabilizing a phase tran-sition that increases rapidly with pressure and manifests a dramatic reduction of low temperature resistivity. Studies of either NMR or neutron scattering under pressure should bring new insights to the high temperature transitions seen in this very promising compound.
Work at the Ames Laboratory was supported by the U.S. Department of Energy-Basic Energy Sciences un-der Contract No. DE-AC02-07CH11358. M. S. T. grate-fully acknowledges support of the National Science Foundation under No. 0306165 and No. DMR-0805335.
[1] Y. Kamiharaet al., J. Am. Chem. Soc.130, 3296 (2008). [2] H. Kitoet al., J. Phys. Soc. Jpn.77, 063707 (2008). [3] M. Rotteret al., arXiv:0805.4630.
[4] G. F. Chenet al., arXiv:0806.1209.
[5] N. Niet al., arXiv:0806.4328 [Phys. Rev. B (to be pub-lished)].
[6] M. Pfisterer and G. Nagorsen, Z. Naturforsch. B53, 703 (1980).
[7] G. Wuet al., arXiv:0806.4279.
[8] F. Ronninget al., J. Phys. Condens. Matter,20, 322 201 (2008).
[9] A. I. Goldmanet al., arXiv:0807.1525.
[10] P. C. Canfield and Z. Fisk, Philos. Mag. B65, 1117 (1992). [11] A. Eiling and J. S. Schilling, J. Phys. F11, 623 (1981). FIG. 3 (color online). Pressure-temperature phase diagram of
CaFe2As2. Solid squares represent lower pressure transitions
from high temperature tetragonal phase to the lower temperature orthorhombic (antiferromagnetic) phase. Solid circles represent the higher pressure phase transition that is evidenced by a marked loss of low temperature resistivity. Solid triangles rep-resent the lower temperature transition to the superconducting state. The solid stars are the 15 K resistivity values (plotted against the right-hand axis). The inset shows more clearly how the superconducting dome is centered around the sharp loss of low temperature resistivity near 5 kbar.
[image:6.612.75.274.46.189.2]