Health sector leadership in mitigating climate
change: experience from the UK and NSW
Abstract: The threat to human health from climate change means that all levels of government and private and public agencies will need to change their current practices to reduce carbon emissions. The health sector will also need to respond and change practice. The National Health Service in the United Kingdom is developing a systematic and strategic approach to reduce its carbon footprint, as described in the recently released NHS Carbon Reduction Strategy for England. The work is being led by the Service’s new Sustainable Development Unit. While the Australian health care system has not yet embraced a shared vision for carbon reduction, there are examples emerging of how the sector is con-tributing to reduce greenhouse gas production. Examples from two NSW area health services to reduce energy use and promote active transport are presented. In both countries, these changes are sup-ported by new legislation and policy.
There is a strong international scientific consensus about the consequences of the warming of the world’s climate system with a recent Lancet editorial arguing that ‘climate change is the biggest global health threat of the 21st century’.1–3A rise of more than 2% in the earth’s average surface temperature
NSW PUBLIC HEALTH
BULLETIN
Vol. 20(11–12) • November–December 2009
ISSN 1034 7674
w w w. p u b l i s h . c s i r o. a u / j o u r n a l s / p h b CONTENTS – See back page
will have significant health and social costs for Australia.4 Urgent international action is required; within Australia action is required by all levels of government, across all sectors and by individuals, to avoid the potential conse-quences. Professor Tony McMichael, a member of the United Nations Intergovernmental Panel on Climate Change, stated ‘We are not talking just about regrettable col-lateral damage. These health risks signify something pro-found – the potential of climate change to undermine the foundations of our wellbeing, health and survival.’5
This article presents arguments for why and how the health sector can respond to the threat posed by climate change. It highlights the work of the newly established Sustainable Development Unit of the United Kingdom’s National Health Service (NHS) and the 2009 Carbon Reduction Strategy for England.6 It is consistent with the 2008 World Health Organization’s general recommendations for how the health sector might achieve carbon savings.7Local examples from area health services (AHSs) in New South Wales (NSW) of carbon reduction initiatives are highlighted.
NHS Sustainable Development Unit
The Sustainable Development Unit focuses on carbon reduction by the NHS with the intention ‘to meet our needs today without compromising the ability to meet our needs and the needs of others – today and tomorrow’.6The Unit has been established to: inform and shape policy around promoting sustainable development and reducing carbon
David Pencheon
A, Chris E. Rissel
B,E, Glen Hadfield
Cand D. Lynne Madden
D ANational Health Service Sustainable Development Unit, EnglandBHealth Promotion Service, Sydney South West Area Health Service, University of Sydney CSydney West Area Health Service
DRoyal Australasian College of Physicians
174 | Vol. 20(11–12) 2009 NSW Public Health Bulletin
emissions in the NHS; engage in primary and secondary research to measure changes in carbon use; examine changes in carbon use that will occur up to 2050 and how the NHS can manage those changes; and to develop and promote this agenda.
Why the UK health sector needs to act
There are many reasons why the health sector should act to mitigate climate change. Some of these reasons are: 1. The 2008 Climate Change Act for England has set a
target of an 80% reduction in carbon emissions on 1990 baseline levels by 2050.8To achieve this target, a transformational change is required by the health sector.
2. Within an evidence-based health system, there is an imperative to respond to the immediate threat of climate change in light of the scientific evidence of the need to reduce carbon emissions.1
3. Some strategies to reduce carbon emissions create opportunities for immediate health co-benefits, especially in the way we promote how we move (active transport such as walking and cycling) and how we eat (a more balanced diet including less meat/dairy).
4. There are financial savings to be made from reduced energy costs from reducing the use of energy. 5. It is important that the health sector continues to be
resilient and robust, responding to changes in the political and social environment.
6. Consultation with health workers has demonstrated their commitment to addressing climate change.9 7. There is a special responsibility and opportunity for
the health sector to lead by example.
The vision for UK health services in the next 50 years is congruent with a low carbon society. Providing improved management of chronic diseases, delivering convenient care closer to home and the better use of technology are themes associated with both saving resources and improved health care.
Health co-benefits from reducing carbon use in the health sector
There are three levels of health co-benefits from reducing carbon use. First, there are the benefits from initiatives such as active travel, including personal health benefits from being more physically active, and, because fewer cars are being driven, reduced traffic congestion and air pollu-tion. Secondly, there are benefits from a more sustainable health care system, which is congruent with health care policy developments such as care closer to home, chronic disease management and self care. Thirdly, there are benefits for international health equity if developing coun-tries can move from pre-carbon economies to post-carbon systems, avoiding a period of heavy carbon use. Climate
change makes these developments that the health sector is already engaged with, even more compelling.
The carbon footprint of the NHS
The NHS is one of the largest employers in the world; it is also a large procurer of goods and services from local, national and international economies. Consequently it is often the biggest single employer in regional areas and forms a significant component of the regional economy. Reflecting its size, the NHS is responsible for 20 million tonnes of carbon dioxide per annum. It is the largest public sector contributor to climate change in England, produc-ing 25% of public sector emissions which is equivalent to the emissions of an entire medium-sized country.10The NHS carbon footprint is composed of energy (heating, lighting, hot water and ventilation; 22%), travel (staff, patients and visitors; 18%) and procurement (the supply chain of activities producing goods and services used by the health system; 60%).10 Despite an increase in effi-ciency, the NHS has increased its carbon footprint by 40% since 1990.10This means that meeting the Climate
Change Act targets of a 26% reduction by 2020 and an 80%
reduction by 2050 will be a challenge. The 2009 Carbon Reduction Strategy establishes that the NHS should have a target of reducing its 2007 carbon footprint by 10% by 2015. This will require the current level of growth of emis-sions to not only be curbed, but also for the trend to be reversed and absolute emissions reduced. Interim NHS targets will need to meet the government targets.
This will require transformational change management beyond that required to master the technical aspects of using less carbon; organisational structures, responsibili-ties and accountabiliresponsibili-ties within the NHS are being recon-sidered to ensure that change happens. Consequently, while the move to a more sustainable health system will need to be driven at all levels, the commitment from the top levels of management is essential.
The challenge to reduce the NHS carbon footprint
emissions associated with procurement. NHS contracts now include statements such as ‘criteria relating to sus-tainability and low carbon operations will increasingly be used in the commissioning of services and the procure-ment of goods’. The buying power and potential leverage of the health sector is significant and can have consider-able knock-on effects throughout the community through the goods and services it buys or commissions. This is important because of the multiplier effect through the supply chain.
The carbon footprint in the NSW health sector In NSW, health facilities account for 53% of the total NSW Government building energy usage.12For example, in the Sydney West Area Health Service in 2007–2008, 106 gigawatt hours of electricity and 348 terajoules of gas were used, equivalent to the use of a city the size of Lithgow.13It also used 665 megalitres of water, about the amount of 1.5 Olympic-sized swimming pools per day. This water and power cost $11.3 million per year to pur-chase and caused 125 000 tonnes of carbon dioxide to be emitted into the atmosphere, equivalent to the emissions of about 25 000 cars.13 The cost of these utilities is also expected to rise from between 12 and 35%, adding further pressure to reduce energy use and the associated costs. The NSW Government Sustainability Policy proposes: reducing greenhouse gas emissions from buildings to 2000 levels by 2020; a 15% reduction in water usage; that all products and appliances purchased to be 4.5-energy-star rated; and a renewable energy target of 20% by 2020.12 However, many in the health sector workforce are unaware of these targets. A shift in thinking that prioritises a smaller carbon footprint will be required across the whole Australian population and, equally, will need to be applied within the health sector workplace.
NSW initiatives
Sydney West Area Health Service – Energy
Blacktown, Mount Druitt and Nepean Hospitals are now generating 40–50% of their electricity onsite using cogen-eration fired by natural gas. This has resulted in an average 15% reduction in electricity consumption across the Sydney West Area Health Service (SWAHS). Twenty thou-sand energy efficient light fittings have been installed across SWAHS facilities.14 An independent audit has demonstrated that the area has reduced its carbon emis-sions by over 8000 tonnes in 2007–2008, and energy efficient upgrades at Westmead Hospital (the largest teaching hospital within the area) have compensated for the additional electricity consumption associated with the opening of two new buildings. In 2005, SWAHS was the first AHS in NSW to become a carbon trader, earning 22 286 NSW Greenhouse Abatement Certificates to date, equivalent to a reduction of 22 286 tonnes of carbon emissions.14
While these energy saving projects require investment to implement, they are usually responsible for recurrent savings. For example, at Westmead Hospital a lighting upgrade that cost approximately $2 million is estimated to save about $300 000 each year with a net financial benefit antic-ipated after 7 years. Similarly, a water recycling project that cost about $2.5 million is expected to save about $215 000 each year. Generally speaking, energy consumption can be reduced by up to 25%, with a relatively easy 10% reduction achieved through lighting upgrades.
SWAHS have completed a series of large-scale energy efficiency upgrades over the past 5 years and are now planning a series of further projects. Using Energy Performance Contracting a detailed audit of a facility is first undertaken to identify the opportunities for energy and water savings.15 A business case is then prepared, which leads to a project proposal based on guaranteed savings.
The projects completed by SWAHS represent an invest-ment of $13 million in new energy and water efficient infrastructure with savings estimated to be over $1.8 million every year. The scope of projects covered includes all the major AHS facilities, consisting of nine hospitals and 11 Community Health Centres.
Sydney South West Area Health Service – Transport
Health services generate an enormous number of trips to and from facilities every day. As previously described, how people travel can directly influence both their carbon use and their health. A strategy to reduce car use trialled by the Sydney South West Area Health Service has been the development of transport access guides for major trip generators such as hospitals.16 These guides illustrate how to travel to and from the hospitals using active travel by showing: where the cycle paths are; recommended walking routes from rail stations; locations of bus stops; and an indication of the frequency of buses. By not showing car parking stations and making active travel easier, this strategy is intended to influence the decision of how to travel to these destinations.
Another strategy has been to work with local cycling groups to develop cycling specific maps to highlight cyclist preferred routes to and from health facilities.17 Other activities to encourage greater levels of cycling have included: working with local councils on developing Bicycle Plans; the development of a cycling proficiency course to increase the skills and confidence of people wanting to cycle more; and the development of a staff bicycle pool.18–20
Health professionals as agents for change
176 | Vol. 20(11–12) 2009 NSW Public Health Bulletin
numbers and geographic dispersion throughout the popu-lation, as well as their clinical and social networks, ensure contact with almost everyone in a local population.21,22 Health professionals have an important role in supporting an environment for change within the health sector and evidence from the NHS suggests that this a role they would welcome.6
Conclusion
The threat to human health from climate change means that all levels of government and private and public agen-cies will need to change their current practices to reduce carbon emissions. All Australians will need to play a part in creating a healthy future and will need to fundamentally change the way they think and live. While the Australian health care system has not yet embraced the challenge of reducing its carbon footprint from a whole systems perspective as the NHS has done, there are many local examples of leadership in NSW.
Acknowledgment
This paper is based on the Australasian Faculty of Public Health Medicine’s Redfern Oration and two other keynote presentations in the Faculty’s Plenary Session, held during the Royal Australasian College of Physicians’ 2009 Physicians Week in May.
References
1. Intergovernmental Panel on Climate Change. Climate Change 2007: Impacts, Adaptation and Vulnerability. Contribution of Working Group II to the Fourth Assessment Report of the Intergovernmental Panel on Climate Change. Parry ML, Canziani OF, Palutikof JP, van der Linden PJ, Hanson CE, editors. Cambridge, UK: Cambridge University Press; 2007.
2. Costello A, Abbas M, Allen A, Ball S, Bell S, Bellamy R et al. Managing the health effects of climate change. Lancet 2009; 373(9676): 1693–733. doi:10.1016/S0140-6736(09)60935-1
3. Editors. A Commission on climate change. Lancet 2009; 373(9676): 1659. doi:10.1016/S0140-6736(09)60922-3
4. CSIRO, Australian Bureau of Meteorology. 2007. Climate change in Australia: technical report 2007. CSIRO. Available from: http://www.csiro.au/resources/ps3j6.html (Cited 7 August 2009.)
5. McMichael T. Health risks of climate change: we all need to be involved. RACP News 2009; June: 5–7.
6. Sustainable Development Unit. Saving Carbon, Improving health: NHS Carbon Reduction Strategy for England. Cambridge, UK: NHS Sustainable Development Unit; 2009.
7. World Health Organization. Protecting health from climate change – World Health Day 2008. Available from:
http://www.who.int/world-health-day/toolkit/report_web.pdf (Cited 22 July 2009.)
8. Climate Change Act. 2008 (c. 27). London: Her Majesty’s Stationery Office.
9. Sustainable Development Unit. Consultation on Draft Carbon Reduction Strategy for England. NHS Sustainable
Development Unit; 2008. Available from: http://www.sdu. nhs.uk/downloadFile.php?doc_url=1232987735_gmWy_ summary_of_responses.pdf (Cited 28 May 2009.)
10. Sustainable Development Commission and Stockholm Environment Institute. NHS England Carbon Emissions: Carbon footprint study, 2008. London: Sustainable Development Unit; 2008.
11. Pencheon D. Health services and climate change: what can be done? J Health Serv Res Policy 2009; 14(1): 2–4.
doi:10.1258/JHSRP.2008.008147
12. Department of Environment and Climate Change NSW. NSW Government Sustainability Policy. South Sydney: ISBN 9781741229417. Available from: http://www. environment.nsw.gov.au/resources/government/
08453SustainabilityPolicy.pdf (Cited 22 December 2009.)
13. Department of Environment, Climate Change and Water. Government Energy and Water Efficiency Investment Program Application Form: Environmental Summary; 2008. NSW Government. Available from: http://www.environment.nsw.gov. au/government/geeip.htm (Cited 22 December 2009.)
14. Sydney West Area Health Service. Annual Report 2006/2007. Westmead: Sydney West Area Health Service; 2007.
15. Association of Energy Performance Contractors Australia. What is energy performance contracting? Available from: www.aepca.asn.au (Cited 22 December 2009.)
16. Bresciani E, Wen LM, Rissel C, Alley J, Jochelson T. Promoting active transport: where to start? Environ Health 2002; 2(1): 55–60.
17. Health Promotion Service. Cycling around the University of Sydney and Royal Prince Alfred Hospital. Camperdown: Sydney South West Area Health Service; 2009. Available from: http://www.cs.nsw.gov.au/pophealth/healthpro/physical/pdf/ RPAH_SydUni_cyclemap.pdf (Cited 29 May 2009.)
18. Daley M, Rissel C, Lloyd B. All dressed up and nowhere to go? A qualitative research study of the barriers and enablers to cycling in inner Sydney. Road and Transport Research 2007; 16(4): 42–52.
19. Telfer B, Rissel C, Bindon J, Bosch T. Encouraging cycling through a pilot cycling proficiency training program among adults in central Sydney. J Sci Med Sport 2006; 9(1–2): 151–6. doi:10.1016/j.jsams.2005.06.001
20. Rissel C, Telfer B. Managing risk in a workplace bicycle pool.
J Australas Coll Road Safety 2005; 16(1): 18–24.
21. Gray M. Climate change is the cholera of our era. Times Online. 25 May 2009. Available from: http://www.timesonline.co.uk/ tol/comment/columnists/guest_contributors/article6355257.ece (Cited 29 May 2009.)
Newborn feeding practices at the time of
discharge from hospital in NSW in 2007:
a descriptive study
Abstract: Objectives: To describe the pattern of infant feeding at discharge from care after birth and the characteristics of mothers who are at risk of low rates of breastfeeding. Methods: Data were obtained from the NSW Midwives Data Collection for 2007. Information on infant feeding was obtained for babies who were alive at discharge from care after birth. Of 96 030 births reported, 93 505 (97.4%) were eligible for analysis. A descriptive analysis of factors associated with vari-ations in breastfeeding was carried out. Results: In 2007, 80% of babies were fully breastfed, 7% were partially breastfed, and 13% were not breastfed. Babies born to mothers with the following charac-teristics had relatively low rates of full breastfeed-ing: teenage mothers (69%); Aboriginal mothers (64%); mothers born in South-East Asia (71%), North-East Asia (72%) and Melanesia, Micronesia and Polynesia (74%); mothers who commenced antenatal care later than 20 weeks gestation (74%); mothers who smoked (67%); mothers who received general anaesthetic during delivery (67%); mothers who gave birth by caesarean section (76%); mothers living in the most socially disadvantaged areas (73%); mothers living in remote and very remote areas (73% and 76% respectively); and mothers of preterm infants (70%). Conclusion: There is a need to improve overall rates of breastfeeding initiation in NSW. Particular attention and support needs to be given to the groups of mothers identified in this study as having relatively low rates of full breastfeeding.
Lee K. Taylor
A,B, Kim Lim
Aand
Sarah E. Neville
AACentre for Epidemiology and Research, NSW Department
of Health
BCorresponding author. Email: [email protected]
The benefits of breastfeeding for mothers and newborns are well documented. Benefits for the mother include reduction in postpartum bleeding, a contraceptive effect leading to increased spacing between pregnancies, and reduced risk of pre-menopausal breast cancer. For the infant, breastfeeding helps protect against diarrhoea, res-piratory tract infections, otitis media and other infections. There is some evidence that breastfeeding is associated with reduced rates of allergies, obesity, diabetes, hyper-tension, cancer and Crohn’s disease, and with improved intellectual and motor development.1
The National Health and Medical Research Council (NHMRC) recommends that infants are exclusively breastfed for the first 6 months of life and has established a target of at least 90% for initiation of breastfeeding in Australia.2The NSW Health policy on breastfeeding3 identifies several strategies that are intended to improve initiation of breastfeeding. These include: implementation of the Baby Friendly Hospital Initiative across area health services; incorporating breastfeeding education and refer-ral into routine antenatal care and other hospital and health services; and identifying and providing specific breast-feeding education and support interventions to women who are at risk of low rates of breastfeeding.
From 2007, the type of infant feeding on discharge from hospital has been reported for all infants born in New South Wales (NSW). The objectives of this study are to describe the pattern of breastfeeding practices at the time of discharge from care after birth and to describe the char-acteristics of mothers at risk of low rates of breastfeeding.
Methods
Data were obtained from the NSW Midwives Data Collection (MDC) for 2007. The MDC is a population-based surveillance system covering all births in NSW public and private hospitals, as well as home births. It encompasses all live births and stillbirths of at least 20 weeks gestation or at least 400 g birth weight. Births in NSW are reported to the NSW Department of Health under the NSW Public Health Act 1991.
178 | Vol. 20(11–12) 2009 NSW Public Health Bulletin
(or discharge from care for home births) for all infants born in NSW. Infant feeding is reported via three tick-box categories: breastfeeding, expressed breastmilk and infant formula. More than one type of feeding may be reported by ticking multiple boxes. Infant feeding was classified into three categories: full breastfeeding, which included babies who were reported to be breastfed or to be receiv-ing expressed breastmilk; any breastfeedreceiv-ing, which included babies who were reported to be receiving breast-milk and infant formula; and no breastfeeding.
Information on breastfeeding was obtained from the MDC for babies who were born in 2007 and who were alive at the time of discharge from care – records of stillborn babies, babies who died in the hospital of birth, and babies for whom information on breastfeeding was not stated were excluded. Of the 96 030 births reported to the MDC in 2007, 93 505 (97.4%) were eligible for analysis. Of the 2525 excluded birth records, 1465 did not contain infor-mation about breastfeeding.
In this article, the term Aboriginal is used to encompass both Aboriginal and Torres Strait Islander mothers. Country of birth groups were created from categories defined in the Standard Australian Classification of Countries.4The enhanced Accessibility/Remoteness Index of Australia (ARIA⫹)5was used to measure remoteness. The ARIA⫹value is based on road distance to a ‘service centre’. Births were classified into five categories of remoteness, determined by the ARIA⫹ score of their Statistical Local Area (SLA) of residence in NSW, ranging from major cities to very remote areas. Socioeconomic groups were constructed using the Index of Relative Socioeconomic Disadvantage (IRSD), which is one of the Socioeconomic Indices (SEIFA) produced by the Australian Bureau of Statistics (ABS).6IRSD scores based on the 2006 Census were assigned to SLAs in NSW. The NSW population was divided into five groups based on the IRSD scores of their SLA of residence. Births were allocated to one of five groups from the lowest quintile (most disadvantaged) to the highest quintile (least disad-vantaged). Descriptive analyses were carried out using SAS version 9.1.3.7Analgesia administered during labour and/or delivery was classified into five mutually exclusive groups. These groups were: non-pharmacological only (including no pain relief); gas (nitrous oxide) with no other pharmacological analgesia; narcotics (usually pethidine), with or without gas; epidural (including epidural, caudal, spinal and combined methods), with or without narcotics or gas; and general anaesthetic, with or without epidural, narcotics or gas.
Results
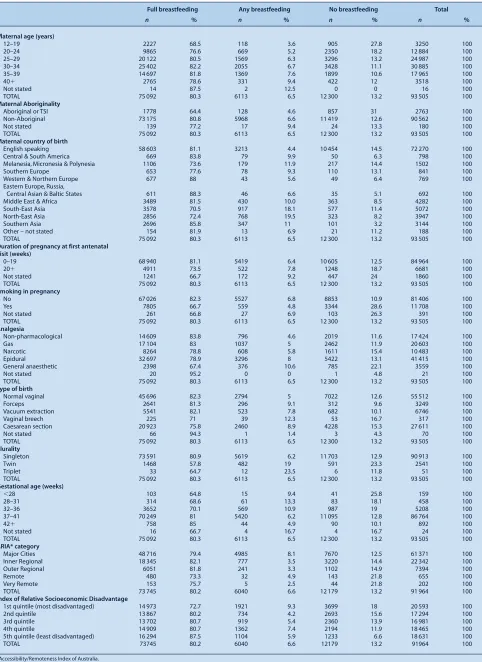
On discharge from hospital in 2007, 80% of babies were fully breastfed, 6.5% were partially breastfed and 13.2% were not breastfed.
Table 1 shows that rates of full breastfeeding were lower among babies born to the following population groups:
• mothers aged less than 20 years – the lowest rates of full breastfeeding were among teenage mothers (69%), who also had the highest rate of no
breastfeeding (28%). Rates of full breastfeeding rose with increasing maternal age to a high of 82% among mothers aged 30–34 years and then declined slightly to 79% among mothers aged 40 years and over. • Aboriginal mothers compared to non-Aboriginal
mothers – 64% of Aboriginal mothers fed their babies fully with breastmilk compared to 81% of non-Aboriginal mothers. The proportion of babies born to Aboriginal mothers who were not breastfed was more than twice that of babies born to non-Aboriginal mothers (31% versus 13%).
• mothers born in South-East Asia, North-East Asia and Melanesia, Micronesia and Polynesia – less than 75% of babies of mothers born in South-East Asia, North-East Asia and Melanesia, Micronesia and Polynesia were fully breastfed compared to 81% of mothers born in English-speaking countries and 88% of babies of mothers born in Eastern Europe, Russia and Central Asian and Baltic States.
• mothers who commenced antenatal care later (greater than 20 weeks gestation) rather than earlier – 74% of babies born to mothers who commenced antenatal care after 20 weeks gestation were fully breastfed, compared with 81% of mothers who commenced antenatal care at less than 20 weeks gestation. • mothers who smoked during pregnancy – 82% of
mothers who did not smoke during pregnancy fully breastfed their babies, compared with 67% of mothers who did smoke.
• mothers who received general anaesthetic during delivery – 67% of babies born to mothers who received a general anaesthetic during delivery were fully breastfed, lower than the 81% of babies born to mothers who received other forms of analgesia during labour or delivery, and 84% of babies born to
mothers who received non-pharmacological pain relief.
• mothers who gave birth by vaginal breech delivery or by caesarean section – the lowest rates of full breastfeeding were among mothers who gave birth by vaginal breech delivery (71%) and by caesarean section (76%).
• mothers living in remote and very remote areas – of mothers living in remote and very remote areas, 74% fully breastfed their babies, compared to over 80% of mothers in more accessible areas.
Newborn feeding practices at the time of discharge from hospital
Table 1. Maternal and infant factors associated with infant feeding practices at discharge from care after birth, NSW, 2007
Full breastfeeding Any breastfeeding No breastfeeding Total
n % n % n % n %
Maternal age (years)
12–19 2227 68.5 118 3.6 905 27.8 3250 100
20–24 9865 76.6 669 5.2 2350 18.2 12 884 100
25–29 20 122 80.5 1569 6.3 3296 13.2 24 987 100
30–34 25 402 82.2 2055 6.7 3428 11.1 30 885 100
35–39 14 697 81.8 1369 7.6 1899 10.6 17 965 100
40⫹ 2765 78.6 331 9.4 422 12 3518 100
Not stated 14 87.5 2 12.5 0 0 16 100
TOTAL 75 092 80.3 6113 6.5 12 300 13.2 93 505 100
Maternal Aboriginality
Aboriginal or TSI 1778 64.4 128 4.6 857 31 2763 100
Non-Aboriginal 73 175 80.8 5968 6.6 11 419 12.6 90 562 100
Not stated 139 77.2 17 9.4 24 13.3 180 100
TOTAL 75 092 80.3 6113 6.5 12 300 13.2 93 505 100
Maternal country of birth
English speaking 58 603 81.1 3213 4.4 10 454 14.5 72 270 100
Central & South America 669 83.8 79 9.9 50 6.3 798 100
Melanesia, Micronesia & Polynesia 1106 73.6 179 11.9 217 14.4 1502 100
Southern Europe 653 77.6 78 9.3 110 13.1 841 100
Western & Northern Europe 677 88 43 5.6 49 6.4 769 100
Eastern Europe, Russia,
Central Asian & Baltic States 611 88.3 46 6.6 35 5.1 692 100
Middle East & Africa 3489 81.5 430 10.0 363 8.5 4282 100
South-East Asia 3578 70.5 917 18.1 577 11.4 5072 100
North-East Asia 2856 72.4 768 19.5 323 8.2 3947 100
Southern Asia 2696 85.8 347 11 101 3.2 3144 100
Other – not stated 154 81.9 13 6.9 21 11.2 188 100
TOTAL 75 092 80.3 6113 6.5 12 300 13.2 93 505 100
Duration of pregnancy at first antenatal visit (weeks)
0–19 68 940 81.1 5419 6.4 10 605 12.5 84 964 100
20⫹ 4911 73.5 522 7.8 1248 18.7 6681 100
Not stated 1241 66.7 172 9.2 447 24 1860 100
TOTAL 75 092 80.3 6113 6.5 12 300 13.2 93 505 100
Smoking in pregnancy
No 67 026 82.3 5527 6.8 8853 10.9 81 406 100
Yes 7805 66.7 559 4.8 3344 28.6 11 708 100
Not stated 261 66.8 27 6.9 103 26.3 391 100
TOTAL 75 092 80.3 6113 6.5 12 300 13.2 93 505 100
Analgesia
Non-pharmacological 14 609 83.8 796 4.6 2019 11.6 17 424 100
Gas 17 104 83 1037 5 2462 11.9 20 603 100
Narcotic 8264 78.8 608 5.8 1611 15.4 10 483 100
Epidural 32 697 78.9 3296 8 5422 13.1 41 415 100
General anaesthetic 2398 67.4 376 10.6 785 22.1 3559 100
Not stated 20 95.2 0 0 1 4.8 21 100
TOTAL 75 092 80.3 6113 6.5 12 300 13.2 93 505 100
Type of birth
Normal vaginal 45 696 82.3 2794 5 7022 12.6 55 512 100
Forceps 2641 81.3 296 9.1 312 9.6 3249 100
Vacuum extraction 5541 82.1 523 7.8 682 10.1 6746 100
Vaginal breech 225 71 39 12.3 53 16.7 317 100
Caesarean section 20 923 75.8 2460 8.9 4228 15.3 27 611 100
Not stated 66 94.3 1 1.4 3 4.3 70 100
TOTAL 75 092 80.3 6113 6.5 12 300 13.2 93 505 100
Plurality
Singleton 73 591 80.9 5619 6.2 11 703 12.9 90 913 100
Twin 1468 57.8 482 19 591 23.3 2541 100
Triplet 33 64.7 12 23.5 6 11.8 51 100
TOTAL 75 092 80.3 6113 6.5 12 300 13.2 93 505 100
Gestational age (weeks)
⬍28 103 64.8 15 9.4 41 25.8 159 100
28–31 314 68.6 61 13.3 83 18.1 458 100
32–36 3652 70.1 569 10.9 987 19 5208 100
37–41 70 249 81 5420 6.2 11 095 12.8 86 764 100
42⫹ 758 85 44 4.9 90 10.1 892 100
Not stated 16 66.7 4 16.7 4 16.7 24 100
TOTAL 75 092 80.3 6113 6.5 12 300 13.2 93 505 100
ARIA* category
Major Cities 48 716 79.4 4985 8.1 7670 12.5 61 371 100
Inner Regional 18 345 82.1 777 3.5 3220 14.4 22 342 100
Outer Regional 6051 81.8 241 3.3 1102 14.9 7394 100
Remote 480 73.3 32 4.9 143 21.8 655 100
Very Remote 153 75.7 5 2.5 44 21.8 202 100
TOTAL 73 745 80.2 6040 6.6 12 179 13.2 91 964 100
Index of Relative Socioeconomic Disadvantage
1st quintile (most disadvantaged) 14 973 72.7 1921 9.3 3699 18 20 593 100
2nd quintile 13 867 80.2 734 4.2 2693 15.6 17 294 100
3rd quintile 13 702 80.7 919 5.4 2360 13.9 16 981 100
4th quintile 14 909 80.7 1362 7.4 2194 11.9 18 465 100
5th quintile (least disadvantaged) 16 294 87.5 1104 5.9 1233 6.6 18 631 100
TOTAL 73745 80.2 6040 6.6 12179 13.2 91964 100
*Accessibility/Remoteness Index of Australia.
Source: NSW Midwives Data Collection (HOIST. Centre for Epidemiology and Research, NSW Department of Health).
180 | Vol. 20(11–12) 2009 NSW Public Health Bulletin
Rates of full breastfeeding were also lower in babies born of multiple pregnancies (twins and triplets) compared to singleton babies, and babies born prematurely compared to babies born at term.
Discussion
Information on breastfeeding at discharge from care after birth was available for the first time on a population basis in NSW in 2007. While some babies may be fully breast-fed immediately after birth, and not fully breastbreast-fed by the time they are discharged from care, it is likely that the NHMRC target of at least 90% for initiation of breast-feeding is currently not being met in NSW.
The study identified groups of mothers who have rela-tively low rates of full feeding with breastmilk: teenage mothers; Aboriginal mothers; mothers who smoke; mothers born in South-east Asia, North-east Asia and Melanesia, Micronesia and Polynesia; mothers who gave birth by vaginal breech delivery or by caesarean section; mothers who received a general anaesthetic during deliv-ery; mothers living in rural and remote areas; mothers living in socially disadvantaged areas; mothers of twins and triplets; and mothers of preterm infants. However, there is little population-based information in Australia to allow comparison.
This pattern was also found in a sample of children born between 2003 and 2004 and followed up as part of the Longitudinal Study of Australian Children (LSAC).8 The LSAC measured breastfeeding initiation rather than breastfeeding at hospital discharge and therefore found higher rates of breastfeeding initiation than our study: initiation was lower for infants of 35–36 weeks’ gestation (88.2%) than 37–39 weeks’ gestation (92.0%) and ⭓40 weeks’ gestation (93.9%). Twins and triplets, and babies born by vaginal breech delivery, are more likely to be pre-mature – the relatively lower rate of full breastfeeding among premature infants is likely to explain at least some of the lower rate of breastfeeding in these groups of infants.
We found that rates of full breastfeeding were lower among mothers who received general anaesthesia during delivery compared to other forms of analgesia or no anal-gesia. A similar pattern was found by Torvaldsen et al in a cohort study of mothers from the Australian Capital Territory who gave birth in 1997, although they found 93% of mothers either fully or partially breastfed their babies in the first week postpartum, a substantially higher percentage than in this study.9
In an examination of data from the Australian National Health Surveys carried out by the ABS in 1995, 2001 and 2004–05, Amir et al found that social disadvantage was consistently associated with lower rates of initiation of breastfeeding.10They also found an increasing difference
between the highest and lowest socioeconomic groups over time, with infants in higher socioeconomic groups more likely to be breastfed in 2004–05 than previously. While we do not have data from past years for comparison, we found a substantial difference (15%) in rates of full breastfeeding between the lowest and highest socio-economic groups.
A limitation of this study is that the validity of reporting infant feeding practices on the MDC is not known, although previous validation studies of the MDC have found the validity of information collected on events occurring during birth and the immediate postpartum period are generally well reported.11,12 This study was restricted to an examination of maternal and infant factors for which information was available on the MDC. Elsewhere, other factors have been found to be associ-ated with initiation of breastfeeding. In the LSAC, lower rates of initiation of breastfeeding were found among overweight and obese mothers compared to mothers of normal weight.13 In a cohort study of mothers giving birth in four hospitals in Western Australia and Queensland, breastfeeding at hospital discharge was found to be most strongly associated with perceived paternal support of breastfeeding, followed by the infant feeding decision being made before pregnancy and the baby having a normal (as opposed to low) birth weight.14 Information on socioeconomic status was limited to eco-logical measures of SEIFA and ARIA in our study, and information on health service activities promoted as part of the joint WHO–UNICEF Baby Friendly Hospital Initiative, such as rooming-in practice and encouraging breastfeeding on demand, are not collected as part of the MDC. Furthermore, intention to breastfeed is not reported on the MDC and it may be that some mothers have already made a decision not to breastfeed prior to the birth. This study is descriptive and further work is needed to explore how factors associated with breast-feeding interact and which factors are more strongly associated with breastfeeding once the other factors are taken into account.
Despite these limitations, this study provides information on factors that can be used in the clinical setting to help identify mothers who are at risk of not breastfeeding. Conclusion
There is a need to improve rates of initiation of breast-feeding in NSW. While initiation rates need to be improved in general, particular attention should be given to the population groups identified by this study. References
2. National Health and Medical Research Council. Dietary guidelines for children and adolescents in Australia incorporating the infant feeding guidelines for health workers. Canberra: AusInfo; 2003.
3. NSW Department of Health. Breastfeeding in NSW: Promotion, Protection and Support. Policy Directive 2006/12. Available from: www.health.nsw.gov.au/policies/
pd/2006/PD2006_012.html (Cited 30 September 2009.)
4. Australian Bureau of Statistics. Standard Australian Classification of Countries (SACC), Australia. 2nd ed. Cat. No. 1269.0. ABS: Canberra; 2008.
5. GISCA. About ARIA⫹(Accessibility/Remoteness Index of Australia). Available from: http://www.gisca.adelaide.edu.au/ products_services/ariav2_about.html
6. Australian Bureau of Statistics. Information paper: 2006 Socioeconomic indexes for areas. Cat. No. 2039.0. ABS: Canberra; 2008.
7. SAS Institute Inc., Cary, NC, USA.
8. Donath SM, Amir LH. Effect of gestation on initiation and duration of breastfeeding. Arch Dis Child Fetal Neonatal Ed 2008; 93(6): F448–50. doi:10.1136/adc.2007.133215
9. Torvaldsen S, Roberts CL, Simpson JM, Thompson JF, Ellwood DA. Intrapartum epidural analgesia and breastfeeding: a prospective cohort study. Int Breastfeed J 2006; 1: 24. doi:10.1186/1746-4358-1-24
10. Amir LH, Donath SM. Socioeconomic status and rates of breastfeeding in Australia: evidence from three recent national health surveys. Med J Aust 2008; 189(5): 254–6.
11. Pym M, Taylor L. Validation Study of the New South Wales Midwives Data Collection 1990. N S W Public Health Bull Supplement. Sydney: NSW Health Department; 1993.
12. Taylor L, Pym M, Bajuk B, Sutton L, Travis S, Banks C. NSW Mothers and Babies 1998. N S W Public Health Bull Supplement. Sydney: NSW Health Department; 2000.
13. Donath SM, Amir L. Maternal obesity and initiation and duration of breastfeeding: data from the longitudinal study of Australian children. Matern Child Nutr 2008; 4(3): 163–70. doi:10.1111/j.1740-8709.2008.00134.x
14. Scott J, Landers M, Hughes R, Binns C. Factors associated with breastfeeding at discharge and duration of breastfeeding.
J Paediatr Child Health 2001; 37: 254–61. doi:10.1046/
j.1440-1754.2001.00646.x
182 | Vol. 20(11–12) 2009 NSW Public Health Bulletin
Evaluation of three population health
capacity building projects delivered
by videoconferencing in NSW
Abstract: Three population health projects in falls prevention, smoking cessation and refugee health secured funding through the NSW Telehealth Initiative. All were capacity building projects delivered through live videoconferencing sessions between April and August 2007. Video -conferencing as a mode of delivery was evaluated from the perspective of those who delivered the projects. Method: Qualitative semi-structured interviews with 12 key informants explored for each project: the organisation and delivery of the education sessions; the utility of videoconferenc-ing for delivervideoconferenc-ing trainvideoconferenc-ing programs; and the perceived potential to apply videoconferencing to other functions. Results: The projects were all delivered successfully through live videoconfer-encing. The main benefits observed were: the ability to deliver training to large numbers of people across multiple locations within a relatively short time and for reasonable costs; and the ability to improve access to high quality professional development for rural and remote workers. Technical difficulties were minor. The support required for these kinds of e-learning projects to succeed were identified. Conclusion: The evalua-tion confirmed the value of videoconferencing as a vehicle through which equity of access to learning opportunities for population health workers across NSW can be achieved.
Jacq Hackett
A, D. Lynne Madden
B,D,
Kerri A. Viney
B,Cand Carlie-Jane Naylor
C AJacq Hackett ConsultingBPublic Health Training and Development Branch,
NSW Department of Health
CNSW Public Health Officer Training Program,
NSW Department of Health
DCorresponding author. Email: [email protected]
In 2005, the NSW Telehealth Initiative called for sub -missions for innovation projects through the Telehealth Innovation Fund, and for the first time sought applications for population health interventions. Three population health projects were subsequently successful in securing funding. These projects sought to build the capacity of the health workforce to provide population health interven-tions and were delivered through live videoconferencing sessions between April and August 2007. Video -conferencing is a technology that involves the transmis-sion of images, voice and data between two or more sites using telecommunication channels; through the extensive Telehealth network hundreds of videoconference sites have been established across the eight area health services (AHSs) in New South Wales (NSW) for the delivery of clinical services and administrative and professional development activities.1,2A condition of funding was that videoconferencing as a mode of delivery was evaluated from the perspective of those who delivered the projects. This article describes the findings of the evaluation. The three projects
Preventing falls and harm from falls in older people
Fall injury is a major cause of preventable injury-related hospitalisation and loss of independence among people aged 65 years and over in NSW. The NSW Clinical Excellence Commission implemented the Falls Prevention Telehealth Project to assist hospitals in rural AHSs to implement the National Guidelines (Preventing falls and
harm from falls in older people. Best practice guidelines for Australian hospitals and residential aged care facili-ties) developed by the Australian Council for Safety and
Quality in Health Care. The project was an education program that sought to prepare health professionals to implement best practice to prevent falls in NSW hospitals and aged-care facilities. Three videoconference sessions each of 2 hours duration were conducted across eight Telehealth sites – two from each of the four rural AHSs. Between 12 and 20 people attended at each site, with approximately 105 participants per session. The sessions were interactive and were recorded; a copy of the DVD/CD was distributed to the participants.
NSW smoking cessation training program
The Centre for Chronic Disease Prevention and Health Advancement within the NSW Department of Health piloted the delivery of an accredited, competency-based
Evaluation of three population health capacity building projects
provided by an Advisory Group who initially helped to refine the evaluation questions. To allow the consultant to become familiar with the three projects and the processes associated with delivering learning sessions through videoconferencing, relevant background documentation was reviewed, preliminary discussions were held with each project manager, and one session of the refugee health project was observed.
Qualitative semi-structured interviews were conducted with key informants. Key informants were determined as being workers who were directly involved in and/or responsible for the planning and delivery of the projects. Interviews were conducted with 12 people and included:
• the project coordinators and other staff from each project
• people who acted as site facilitators at the remote sites • presenters of the sessions
• NSW Health Telehealth Initiative staff.
The views of participants in the sessions were not sought. The majority of interviews were conducted face-to-face, however those held with rural informants were undertaken by telephone. The interviews were guided by a written protocol that was provided to the informant prior to their interview. To minimise the potential for recall bias the evaluation was undertaken at the same time the projects were being delivered, and the report completed in September 2007.
The information gathered through the interviews was analysed and a summary of preliminary findings prepared. The Advisory Group reviewed the preliminary findings and reviewed a draft of the report before it was finalised.
Results
Organisation and delivery
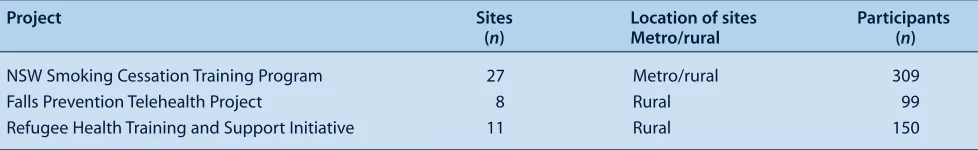
The projects were complex. Each involved the live deliv-ery of learning sessions to between eight and 11 remote sites located in rural locations across NSW, with each session drawing up to 105 participants (Table 1). Despite this complexity the projects were all delivered success-fully through live videoconferencing.
Table 1. Description of sites and number of participants for three population health capacity building projects delivered by videoconferencing in NSW in 2007
Project Sites Location of sites Participants (n) Metro/rural (n)
NSW Smoking Cessation Training Program 27 Metro/rural 309
Falls Prevention Telehealth Project 8 Rural 99
Refugee Health Training and Support Initiative 11 Rural 150
training program in the treatment of nicotine dependence using live videoconferencing as the delivery method. The training addressed two units of competency in tobacco use and evidence-based treatment of nicotine dependence within the national Vocational Education and Training accredited Population Health Training Package. Accredited trainers delivered 10 modules, each of 2 hours duration, to 27 sites and a total of 309 participants.3
Refugee Health Training and Support Initiative to enhance service delivery to rural and remote refugee populations
The NSW Refugee Health Service, located at the Sydney South West Area Health Service, used videoconferencing to deliver a series of lectures/information sessions on refugee health issues to clinicians and population health staff. Six lectures of 1 hour duration were provided on the topics of infectious disease, child health, mental health, the physical impact of torture, oral health and nutrition, and refugee women’s health. Eleven sites participated with between 30 and 70 participants for each session. In addition, a small number of networking sessions for refugee health nurses working in rural and remote areas were conducted.
To determine the utility of using live videoconferencing to deliver population health training and other potential applications, an external evaluation was commissioned by the Population Health Division, NSW Department of Health; this was undertaken in July and August 2007. Methods
A process evaluation examined the following three areas across each project: their organisation and delivery (including what worked well, what difficulties were expe-rienced and the workload involved); the utility of video-conferencing for the delivery of the sessions; and the potential for future application of the technology.
184 | Vol. 20(11–12) 2009 NSW Public Health Bulletin
Successful organisation and delivery of a session required a designated project coordinator with project management skills at the central delivery location and local facilitators at each remote site. Both these roles were found to be necessary. Box 1 summarises the core tasks undertaken by each. In all cases, the workload required, especially in the planning and organisation stages, was underestimated. The effectiveness of videoconferencing is reliant on the technology; overall, the majority of technical problems experienced were considered to be minor. However, when technical disruptions did occur it was both frustrating and stressful to those organising a session. There were varying levels of technical support available both at the host and remote sites and where there was little infrastructure support, the sessions were vulnerable to disruption. The timely availability of supporting resources, such as course materials and PowerPoint presentations, was an important aspect of providing training through vide -oconferencing, and the information technology systems in some rural locations could not manage the transfer of these large electronic files. Further, some participants did not have computer access to allow them to receive materi-als electronically.
Utility of videoconferencing
All informants were satisfied that videoconferencing had met the needs of their projects and all considered it an appropriate technology through which to deliver popula-tion health learning initiatives.
The two main benefits highlighted were: the ability to deliver training to large numbers of people across multiple locations within a relatively short time and for reasonable costs; and the ability to improve access to high quality pro-fessional development for rural and remote workers. It was considered unlikely that initiatives of similar scope and reach could be delivered in a face-to-face mode due to the associated costs.
The informants identified many other benefits of video-conferencing. Both the smoking cessation and falls pre-vention projects were modules consisting of a number of short sessions designed for staged learning over time. These modules allowed for the assimilation and applica-tion of learning between sessions and for participants to discuss their experience in subsequent sessions with their peers.
The centralised delivery of learning sessions was asso -ciated with a number of perceived benefits. It allowed learning to be delivered in a consistent manner for all par-ticipants. The informants commented that other ways of rolling out training, such as train-the-trainer modes, can be less consistent in their delivery. It also allowed the partic-ipants direct access to experts and the opportunity to inter-act with them.
The development of learning communities was facilitated in a number of ways. Firstly, as it took less time to attend these sessions it encouraged clinicians to participate, allowing for multidisciplinary learning. Secondly, it
Box 1. Roles and responsibilities fulfilled by project coordinators and site facilitators for three separate capacity building projects in population health delivered through videoconferencing in NSW in 2007
Project coordinator
• Planning and organising sessions dates/times and site bookings • Preparation of agendas
• Recruitment, briefing and supporting site facilitators • Recruitment and briefing of presenters
• Preparation and distribution of promotion and advertising material
• Preparation and distribution of written materials and resources to support the learning • Gaining the support of local managers to achieve the release of staff to attend sessions • Management of host site technology
• Chairing the sessions and ensuring appropriate follow-up.
Site facilitators
• Coordination of all aspects of local administration and support for the project • Recruitment and selection of local participants, including registration • Local promotion
• Distribution of materials and resources to participants
• Completion and return of any documentation required by the project
Evaluation of three population health capacity building projects
Western, covers 55% of the landmass of NSW.7 While the majority of the NSW population live in urban settings, 20% live in inner regional areas and 7% in outer regional and remote areas.8 The delivery of population health capacity building activities to health staff across this large geographical area was made possible by using video -conferencing as the delivery method.
Videoconferencing a learning session is different to the delivery of face-to-face sessions and requires preparation and support.9,10Combining videoconferencing with other, related learning supports ensured a good quality episode of training and the evaluation confirmed some of the other elements that need to be in place for this to occur. These are: central project coordination and local site facilitators; reliable information technology systems in rural and remote areas, including ready access to computers and printers; a supportive environment encouraged by senior staff; and an appropriate level of infrastructure support at the state and local level.
A strategic review of Telehealth in NSW Health under-taken in 2008 suggested that Telehealth could provide a vehicle for developing an e-learning environment for the NSW Health system. Indeed, a recent survey conducted by the NSW Department of Health in 2009 identified 148 e-learning programs currently delivered through Telehealth. The NSW Health Telehealth Network is a large network and consequently offers a means of providing equity of access to information and learning and development activ-ities. In addition, Telehealth is not the only telecommuni-cations network in NSW. A mapping exercise describing all the major networks that can be accessed by NSW Health staff for videoconferencing, and the potential connectivity between these systems, could expand the resources available for e-learning activities.
The evaluation has demonstrated that the invitation for submissions through the Telehealth Innovation Fund 2005–2006 provided an important stimulus for population health services to consider how they might incorporate Telehealth in their practice. Until 2005, there had been few funding submissions from the public health field. The inclusion of population health interventions in the 2005–2006 invitation has generated enthusiasm for apply-ing the technologies available through Telehealth by the public health workforce in NSW.
Conclusion
The evaluation confirmed the value of videoconferencing as one vehicle through which equity of access to learning opportunities for population health workers across NSW can be achieved. It also demonstrated how it can be used to build and sustain learning communities to support remote practitioners.
expanded the networks of the participants and led to col-laboration. These connections occurred between: partici-pants attending at a site, participartici-pants at different sites, and participants and the central or statewide service that deliv-ered the training. Some groups continued to meet after the sessions were completed.
Future applications
Videoconferencing was seen as a valuable tool for build-ing workforce capacity in population health and many ideas were offered about its future use. These included: providing access services (i.e. interpreter services) in remote areas; forming part of communication strategies for guidelines; and enabling collaboration between iso-lated practitioners, such as rural refugee health nurses. Informants expressed caution about the infrastructure required to ensure the reliability of videoconference deliv-ery. In addition, many projects use non-Telehealth sites and a better understanding of the potential interaction and connectivity across the various systems is required. Many Telehealth sites were installed for clinical use and cannot be readily adapted for other functions. Clinical services also remain the first priority for the use of these facilities. Informants noted that increasing demand for these resources from an expanding range of functions will require management.
Discussion
These three Telehealth-funded projects successfully applied videoconferencing to support professional learn-ing in population health in NSW. They were well received and together reached over 500 people in metropolitan and rural locations. Together they confirmed how increased access to training and professional development opportu-nities for a substantial number of rural and remote workers can be achieved with few resources. They demonstrated the potential of videoconferencing to deliver e-learning initiatives and how this technology can be used to build and sustain learning communities that provide support to remote practitioners.
The projects demonstrated the range of complexity in the delivery of learning that is possible; from information sessions to competency-based modules that included the assessment of participants.3The participation of experts in the sessions generated interest in these projects; previous evaluations of the delivery of Bug Breakfast in NSW has shown that remote participants especially value the opportunity to interact with experts.4,5Videoconferencing should however be viewed as only one vehicle for provid-ing capacity buildprovid-ing and the mode of delivery chosen to deliver a learning session should fit both the purpose of a session and the resources available.6
186 | Vol. 20(11–12) 2009 NSW Public Health Bulletin
Acknowledgments
We would like to thank the NSW Telehealth Initiative Strategy for the financial support for the delivery of these projects. We would also like to thank the members of the Telehealth Evaluation Advisory Committee for their assistance with the evaluation: Lou-Anne Blunden, Lorraine Lovett, Elayne Mitchell, Mitchell Smith, Kim Stewart and Sarah Thackway.
References
1. Naylor C-J, Madden DL. Communication technology supporting the public health workforce in NSW, Glossary.
NSW Public Health Bull 2009; 20(S2): 3.
2. AIDS Dementia and HIV Psychiatry Service (Adahps) and Telehealth. Available from: http://www.health.nsw.gov.au/ adahps/telehealth.asp (Cited 9 December 2009.)
3. Mitchell EN, Hawkshaw BN, Naylor CJ, Soewido D, Sanders JM. Enabling the NSW Health workforce to provide evidence-based smoking-cessation advice through competency-evidence-based training delivered via video conferencing. N S W Public Health
Bull 2008; 19(3–4): 56–9. doi:10.1071/NB07122
4. Madden DL, Naylor CJ, Simpson D. An evaluation of videoconferencing Bug Breakfast. N S W Public Health Bull 2003; 14(S2).
5. Naylor C-J, Madden DL, Oong DJ. Use of communication technology among public health professionals in New South Wales, Australia. N S W Public Health Bull 2007; 18(1–2): 13–6.
6. Naylor C-J, Madden DL. Communication technology supporting the public health workforce in NSW, Introduction.
NSW Public Health Bull 2009; 20(S2): 4–6.
7. Greater Western Area Health Service. Annual Report 2006–2007. Available from: http://www.gwahs.nsw.gov.au/ userfiles/file/gwahs%20annual%20report.pdf (Cited 23 November 2009.)
8. NSW Department of Health Population Health Division. The health of the people of New South Wales – Report of the Chief Health Officer. Available from: www.health.nsw.gov.au/ publichealth/chorep/ (Cited 23 November 2009.)
9. Birden H, Page S. Teaching by videoconference: a commentary on best practice for rural education in health professions.
Rural Remote Health 2005; 5(2). Available from:
http://www.rrh.org.au (Cited 23 November 2009.)
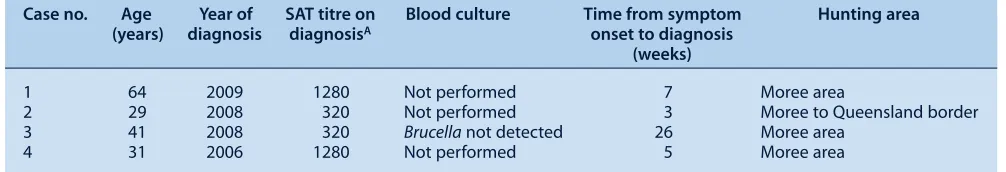
Campylobacteriosis is a bacterial infection that predomi-nantly causes gastrointestinal illness within 2–5 days (range 1–10 days) of exposure to Campylobacter. Symptoms, which include diarrhoea (frequently with bloody stools), abdominal pain, fever, nausea and vomiting, generally persist for up to 7 days. Symptoms can be prolonged or recurrent and the sequelae of infection may include rheuma-tological disorders, peripheral neuropathies and Guillain-Barre Syndrome.1,2Without antibiotic treatment, infected individuals can excrete bacteria for up to 7 weeks.1
The reservoir for Campylobacter is domesticated and wild animals and the environment. Campylobacter jejuni causes the majority of human infections and most com-monly occurs after ingestion of, or contact with, infected
Estimate of the number of
Campylobacter
infections in the Hunter region, NSW,
2004–2007
Abstract: Objectives: Campylobacteriosis is not notifiable in NSW and the number of cases of
Campylobacter disease is thus not well described.
Methods: De-identified campylobacteriosis records for 2004–2007 were requested from labo-ratories in the Hunter region of NSW. Based on notifying laboratory, a Salmonella notification weighting was applied to laboratory-confirmed campylobacteriosis cases to provide an overall estimate of Campylobacter disease in the area. Results: The estimated median of the annual number of laboratory-confirmed campylobacterio-sis cases was 788 (range 700–1022). The ratio of estimated Campylobacter cases to Salmonella noti-fications was 5.5 : 1. Conclusion: Campylobacter infection causes considerable disease in the Hunter, and likely in NSW. Regular review of Campylobacter laboratory results may be valuable.
April R. Roberts-Witteveen
A,C, David
N. Durrheim
B, Tony D. Merritt
Band Sally A. Munnoch
AAOzFoodNet, Hunter New England Area Health Service BHealth Protection, Hunter New England Area Health Service CCorresponding author. Email: [email protected]
foods of animal origin, particularly poultry.1,3–5Ingestion of as few as 500–600 Campylobacter bacteria may cause illness.3In Australia, an estimated 75% of campylobacte-riosis is thought to be foodborne.6 Cases of foodborne
Campylobacter infection are usually sporadic in nature
and point-source foodborne outbreaks are not commonly identified.7,8Phenotypic methods currently used for dis-tinguishing Campylobacter pathogens are of limited use so public health investigation or control activities occur rarely. In New South Wales (NSW), the inability to detect and control or prevent outbreaks of Campylobacter because of limitations in strain typing is the reason it is not a notifiable disease.8DNA methods for typing strains, including multi-locus sequence typing and polymerase chain reaction, are under development.9
In all Australian jurisdictions except NSW, confirmed
Campylobacter infections are required to be notified to
health departments under public health legislation. Campylobacteriosis is the most commonly notified enteric condition in Australia with 17 020 notifications in 2007. Between 2004 and 2007, the overall notification rate reached 120.5 per 100 000 population.10 After campylo -bacteriosis, salmonellosis is the next most notified enteric disease in Australia. In 2007, there were 9546 notifica-tions of Salmonella infecnotifica-tions from all states and territo-ries, with an overall notification rate of 45.4 per 100 000 population. All states and territories that notify both infections had more Campylobacter than Salmonella noti-fications annually between 2004 and 2007, except for the Northern Territory.11After accounting for underreporting, it has been estimated that approximately 227 000
Campylobacter infections occur annually in Australia.12
188 | Vol. 20(11–12) 2009 NSW Public Health Bulletin
system and some private medical practices. In 2005, the estimated resident population of the Hunter region was 8.4% of NSW’s population (i.e. 573 525 people).13 Methods
The three laboratories in the Hunter region were approached to participate in the study: the public laboratory and one large private laboratory agreed to participate by providing de-identified records of people whose Campylobacter infection was detected between 1 January 2004 and 31 December 2007. For each positive sample, a laboratory identifier, the person’s date of birth, age, sex, residential postcode and specimen collection date were provided. The data from both laboratories were merged into a single dataset, which was cleaned and checked for duplicates. A specimen was identified as a duplicate if it was collected from an individual up to 8 weeks after a previous speci-men. Only infections in residents of the Hunter region were included in the analyses.
One private laboratory did not participate in the study so the total number of laboratory-confirmed Campylobacter infections diagnosed in the Hunter region for 2004–2007 was estimated. As salmonellosis is notifiable to the NSW Department of Health by all laboratories, internal quality assurance data were used to identify the notifying labora-tory for each case of salmonellosis notified in the Hunter between 2004 and 2007. The proportion of salmonellosis notifications received from all laboratories in the region, and the annual median proportion of salmonellosis notifi-cations (2004–2007 data) from the two participating laboratories were determined. The annual median propor-tion of salmonellosis notificapropor-tions was applied to the
Campylobacter diagnoses to permit an estimate of the total
number of cases diagnosed from all laboratories in the area. We assumed that the proportional distribution of
Campylobacter infections and salmonellosis notifications
across the three Hunter area laboratories was similar because:
• both bacteria are detected using stool culture by local laboratories
• salmonellosis and campylobacteriosis generally have similar transmission modes.1
We further assumed that the proportional distribution was stable throughout the study period.
Hunter region campylobacteriosis cases were described and compared to national descriptive notification data. Results
There were 2010 isolates of Campylobacter detected by the two participating laboratories between 2004 and 2007. Of these, 357 (18%) were excluded as duplicate records and 91 (4.5%) were excluded as isolates from people who were not resident in the study area. Sixty percent of the
remaining 1562 isolates were detected by the public laboratory (n⫽944).
The least number of laboratory-confirmed cases of campy-lobacteriosis occurred in 2004 (n⫽346) and the greatest in 2007 (n⫽460). The pattern of a yearly increase in the number of cases in the Hunter (except 2006) was also observed in the national data (Figure 1). In the Hunter and nationally, the number of laboratory-confirmed cases peaked between November and January (Figure 2).
0 50 100 150 200 250 300 350 400 450 500
2004 2005 2006 2007
Year
Number of campylobacteriosis diagnoses from participating Hunter laboratories 0
2000 4000 6000 8000 10 000 12 000 14 000 16 000 18 000
Number of notified cases nationally
Participating Hunter laboratories National notifications
Figure 1. Number of laboratory-confirmed
campylobacteriosis cases diagnosed by participating laboratories in the Hunter region of NSW, and the number of campylobacteriosis notifications in Australia*, for the period 2004–2007. *Excludes NSW where campylobacteriosis infection is not notifiable.
Source: Campylobacteriosis diagnosis data of laboratories participating in the study and the National Notifiable Diseases Surveillance System.
0 20 40 60 80 100 120 140 160 180 200
Jan Feb Mar Apr May Jun Jul Aug Sep Oct Nov Dec
Month
Number of campylobacteriosis diagnoses from participating Hunter
laboratories
0 1000 2000 3000 4000 5000 6000 7000
Number of notified cases nationally
Participating Hunter laboratories National notifications
Figure 2. Number of laboratory-confirmed
campylobacteriosis cases from participating laboratories in the Hunter region of NSW, and the number of
campylobacteriosis notifications in Australia*, by month, for the period 2004–2007. *Excludes NSW where campylobacteriosis is not notifiable.
Evidence-based practice and breastfeeding policy
0 2 4 6 8 10 12
0–4 5–9
10–14 15–19 20–24 25–29 30–34 35–39 40–44 45–49 50–54 55–59 60–64 65–69 70–74 75–79 80–84 85
⫹
Age group (years)
Proportion of total number of cases (%)
National notifications
Participating Hunter laboratories
Figure 3. Proportional age distribution of laboratory-confirmed cases of campylobacteriosis from participating laboratories in the Hunter region of NSW, and notified nationally in Australia*, by 5-year age group, for the period 2004–2007. *Excludes NSW where campylobacteriosis is not notifiable.
Source: Campylobacteriosis diagnosis data of laboratories participating in the study and the National Notifiable Diseases Surveillance System.
Between 2004 and 2007, 54% (844/1562) of laboratory-confirmed Campylobacter infections in the Hunter region were diagnosed in males. For the same period nationally, males comprised 55% of notifications. In the Hunter region, there was a predominance of males in all age groups up to 50 years, after which age case counts in males and females were similar. The median age of diagnosis for males was 31 years (inter-quartile range 16–50 years) compared with 35 years (inter-quartile range 21–58 years) in females. In children aged under 5 years in the Hunter, 99 Campylobacter infections were diagnosed in boys com-pared with 48 in girls. This gives a boy to girl ratio of 2.1 : 1, compared with a national notification ratio in this age group of 1.5 : 1.
The age distribution of laboratory-confirmed cases of campylobacterosis in the Hunter was similar to that of nationally notified cases (Figure 3), with a high proportion of cases in children aged under 5 years. Secondary peaks in the number of cases occurred in the 15–19-year age group in the Hunter region (10.8%) and 20–24-year age group nationally (9.6%).
The local quality assurance data contained 584 salmonel-losis notifications for residents of the Hunter between 2004 and 2007. The median annual proportion of Salmonella notifications processed by the participating laboratories was 48% (range 37–54%). Applying this pro-portion and range to the number of laboratory-confirmed
Campylobacter infections identified by participating
laboratories, the estimated median of the annual number of laboratory-confirmed cases of campylobacteriosis in the Hunter region was 788 (range 700–1022) between 2004 and 2007 (Table 1). The ratio of the estimated annual number of Campylobacter infections to salmonellosis notifications in the Hunter ranged between 5.3 and 6.0:1, with a median of 5.5:1 (Table 2). The lower and upper esti-mates of the median annual number of Campylobacter diagnoses produced ratios ranging from 4.9 to 7.1:1.
Discussion
This study estimated that in the Hunter region of NSW, campylobacteriosis is approximately five times more common than salmonellosis. The epidemiology of
Campylobacter infection in the Hunter appears to be
similar to other temperate areas of Australia in terms of trends in gender distribution, the number of cases occur-ring each year and seasonality. These similarities in demo-graphics support the validity of this estimation process. The ratios of annual counts of Campylobacter infection to
Salmonella notifications in other Australian jurisdictions
range from 5.7 : 1 in Victoria to 0.6 : 1 in the Northern Territory. If the assumptions in the Hunter are valid, the lower estimate of the Campylobacter to Salmonella infec-tion ratio in Hunter residents is similar to that of Victorian residents.
Using Salmonella notification data to help estimate the total number of laboratoryconfirmed cases of campylo -bacterosis is logical given the similarities in laboratory diagnostic methods and the nature of the bacteria. The use of this methodology and the assumptions made are sup-ported by the ratio of Campylobacter to Salmonella cases in other jurisdictions, which has a limited range. We are not aware of any reasons why this should differ in the Hunter region.
190 | Vol. 20(11–12) 2009 NSW Public Health Bulletin
the population of Hunter residents serviced by the two par-ticipating laboratories is unknown.
Campylobacterosis causes a considerable morbidity and has potentially serious sequelae, so there is value in mon-itoring the longer-term trends in infection, particularly to determine the impact of measures implemented to reduce infection rates in humans. Measures have included initia-tives in domestic and food production settings, especially in the poultry industry.5,14 Regular review of the demo-graphic details of people in NSW with diagnosed Campylobacter infection would provide baseline data against which the effectiveness of control measures could be determined.
Conclusions
This study provides evidence that the number of cases of laboratory-confirmed campylobacteriosi