Student Performance Classification using
Adaptive DNN with SVM Approach
Soni Darshan Kumar Babulal
1, Prof. Dr. Binod Agrawal
21
Research Scholar at Calorx Teachers' University, Gujrat 2
Calorx Teachers' University, Ph.D Guide at Calorx Teachers' University, Gujrat
ABSTRACT
Predicting student performance based on their academic score is critical for any academic organization; a number of strategies can be used to improve or maintain student performance during their studies. The academic performance in this research is measured based on marks obtained by students of different colleges. This research aims to examine the accuracy rate of the student performance prediction system, which is designed using the concept of data mining with a machine learning approach. The foremost step of this research is to collect data from the database and then cleaned unstructured data into stricture form by using the concept of Cosine similarity with the K-mean clustering approach. After that, the clustered data is used to train the Deep Learning Neural network (DNN), and also, the cross-validation of the result has been performed using a Support Vector Machine (SVM) approach. At last, the performance parameters are measured. The results indicate that the SVM with the DNN approach performs well and provides better prediction accuracy to analyze the performance of students.
Keywords: Data mining, Cosine Similarity, K-mean, DNN, SVM.
I. INTRODUCTION
The success of human capital creation for higher education institutions whose aim is to enhance the quality of higher education becomes a research topic of ongoing analysis [1]. Therefore, student success prediction is essential for higher education organizations as the quality of the learning process defines the capability to meet the needs of students [2]. Therefore, to achieve this goal, it is essential to collect data regularly and must be considered as an appropriate data, which are reviewed by the relevant authorities and standards for quality assurance are established [3].The quality of any educational organization is judged based on different factors such as teaching staff, student's needs, and the other members of the organization [4]. Participants in the learning process need to collect and integrate and then use a large amount of information to fulfill their responsibilities through appropriate activities. The collected data is available in the raw or in the unstructured form [5].
Therefore, it is necessary to process the data so that the performance of the designed student prediction model can be improved. This is done by using a data mining approach on the available dataset. The basic participant of the higher education system by using the data mining approach is shown in Figure 1. The data mining helps to extract useful information as per the user's interest and hence tends to enhance the understanding capability of the teaching model. In this research, clustering using K-mean approach is used as a data mining approach [7].
II. RELATED WORK
This section deals with the contribution of various researchers using SVM and ANN as a classification approach used for the prediction of students' academic performance.
As per the Asogbon et al. []8 points of view, the quality of education can be maintained by properly analyzing the performance of entrant students and the organize faculty programs as per the student performance. The prediction of student performance has been analyzed by using a multi-class SVM approach. Also, the researcher Pratiyush and Manu [9] have said that the data size in the education field has increased with the rise in technology. Therefore, the data mining approach helps to extract useful information from the huge data, which is related to the performance of the student for an example, in this case, the data is available in terms of student placement.
The classification has been performed using the SVM approach, which helps to enhance the performance in the competitive field. In the modern era, the education sector is very crucial; therefore, Kadambande et al. [10] have designed an education performance system by utilizing the data mining approach in addition to SVM as a classification technique. In this research, the SVM is used for the prediction, and the analysis of data has been performed using regression and classification approaches. SVM approach helps students to find outhow much they have developed themselves to be suitable for placement.
Raihana and Farah Nabilah [11] have presented a student performance analysis based on life quality as well as their academic performance with the help of the SVM approach. In the same field, work using Pattern Net has been performed by Zaldivar-Colado et al. [12]. The model is used to predict the career in university based on the performance category. The shortcoming occurs during the entire course has been analyzed, as well as the solution to avoid that shortcomings are avoided. Binh and Duy [13] have presented student performance prediction model based on the style of student’s learning capabilities. The researchers have stated that the learning of students also depends upon the student’s style or different types of personalities.
The main aim of this research is to design a student performance prediction model by integrating the data mining approach using ANN with SVM classifiers.
III. PROPOSED WORK
The entire research work that involves different steps for the prediction of student performance using cosine similarity, clustering, and classification approach is depicted in Figure 2. Each phase of the work is explained below;
Step 1. The foremost step is to gather data from https://inventory.data.gov/dataset/4165d446-3bdf-4b8e-9310-ffe34737c19e/resource/89fec729-9ab9-43d5-8dcd-e65dfab2a17c.
Figure 2: proposed Flow Work
Step 3. Now the features such as based on the obtained marks by the students of college 1 are compared to another college by using the concept of cosine similarity. It is a technique, which is used to measure the resemblance among the students by comparing their features.
Step 4. Now, the clustering approach (K-mean) has been applied as a data mining approach. This grouped the students based on their marks into groups. The algorithm used is defined below.
Algorithm: K-means
Input: Data Data for clustering
Output: C-Data and C Clustered Data and their centroids Initialize an estimated group (G)
Start
Student Data collection
Pre-Processing
College Features
College 1 College 2
Cosine Similarity
Clustering
Recognition of student performance based on Training
Calculate Performance Parameters like Precision, recall, F-measure, and Accuracy
End Training using ANN
& SVM
Testing using ANN
Save Training Database using
Calculate the size of Data in terms of [Row, Col.]
Define initial C-Data and random Centroid C = C1, C2, C3…Cn For i1 to all Row
For j1 to all column IfData (i,j)==C1
C-Data 1=Data (i,j) Else if Data (i,j)==C2 C-Data 2=Data (i,j) Else if Data (i,j)==C3 C-Data 3=Data (i,j) .
. .
Else Data (i,j)==Cn C-Data n=Data (i,j) End
AdjustCentroid C using their mean
C = Average (C-Data 1, C-Data 2, C-Data 3…. C-Data n) End
End
Return: C-Data and C as a Clustered Data and their centroids respectively End
Step 5. Based on the clustered data, the pattern net is trained, and the training structure of the pattern net is shown in Figure 3.
Figure 3: ANN structure with MSE
Algorithm: Pattern Net
Input: C-Data and C Clustered Data as training data and their centroids as a target or category Output: Pattern-Net-Structure Trained structure
Initialize the Pattern net with training data C-Data: – Number of Epochs (E) // Iterations used by pattern net – Number of Neurons (N) // Used as a carrier in pattern net – Performance: MSE, Gradient, Error Histogram and Validation – Data Division: Random
For i = 1 C-Data
If C-Data belongs to Cluster 1
Group (1) = Feature from the C-Data 1 Else if C-Data belongs to Cluster 2
Group (2) = Feature from the C-Data 3 Else if C-Data belongs to Cluster 3 Group (3) = Feature from the C-Data 3 .
. . Else
Group (n) = Feature from the C-Data n End
End
Initialized the pattern net using C-Data and Group Pattern-Net-Structure = Patternnet (N)
Set the training parameters according to the requirements and train the system Pattern-Net-Structure = Train (Pattern-Net-Structure, C-Data, Group)
Return: Pattern-Net-Structure as a Trained structure End
Step 6. For cross-validation or to enhance the quality of the designed student performance model, the Support Vector Machine is used.
Figure 4SVM plot
Algorithm: Support Vector Machine
Input: C-Data and C Clustered Data as training data and their centroids as a target or category Output: SVM-Structure Trained SVM structure
Initialize the SVM with training data C-Data with RBF as Kernel function For I = 1 Length (C-Data)
If Cluster of C-Data (I) == C1
Defined the Cat as a category of training data Cat (1) = C-Data (I)
Else
Cat (2) = C-Data (I) End
End
SVM-Structure =SVMTRAIN (T, Cat, Kernel function) Return: SVM-Structure as a Trained SVM structure End
Step 7. After following the above-mentioned steps, the performance of the designed student performance system has been measured based on different parameters such as precision, recall, F-measure, and Accuracy.
IV. RESULTS AND DISCUSSIONS
The entire model has been designed using MATLAB as a simulator, and the performance has been measured for different student’s records ranges from 100 to 700 numbers of students. The computed results are shown in the following section.
Figure 5: precision
Figure 5 represents the precision parameters, which show the correctly classified student data compared to the total number of data that is (misclassified and accurately classified). From the graph, it is clear that using SVM with a Deep neural network, the classification rate of accurately classified student cases is high compared to an individual SVM and Deep Learning Network. This is because cross-validation has been performed using an SVM classifier.
0.7 0.72 0.74 0.76 0.78 0.8 0.82 0.84 0.86 0.88 0.9
100 200 300 400 500 600 700
P
r
e
c
is
io
n
Total Number of Supplied Student Records
SVM
Deep Neural Network
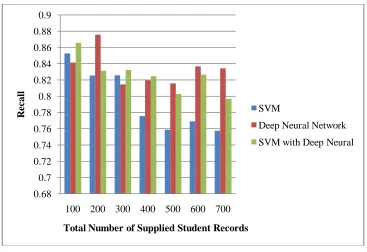
Figure 6: Recall
Figure 6 illustrated the recall values analyzed by varying the total number of student’s records as represented along the x-axis. The recall represents the rate of correctly classified student cases with respect to the total number of correctly and unclassified students records. The average value of recalls measured for SVM, DNN, SVM with DNN approaches is 0.7950, 0.834, and 0.825, respectively.
Figure 7: F-measure
F- Measure is used to show the relationship between the observed precision and recall values. The average value of F-measured analyzed for SVM, DNN, SVM with DNN approaches0.798, 0.827, and 0.8321, respectively.
0.68 0.7 0.72 0.74 0.76 0.78 0.8 0.82 0.84 0.86 0.88 0.9
100 200 300 400 500 600 700
R
e
c
al
l
Total Number of Supplied Student Records SVM
Deep Neural Network
SVM with Deep Neural
0.7 0.72 0.74 0.76 0.78 0.8 0.82 0.84 0.86 0.88 0.9
100 200 300 400 500 600 700
F
-m
e
as
u
r
e
Total Number of Supplied Student Records
SVM
Deep Neural Network
Figure 8: Accuracy
In the end, the classification accuracy of the prediction model has been examined, as shown in Figure 8. The average accuracy computed for the designed student performance prediction model using SVM, DNN, and SVM with DNN is 73.44 %, 75.80%, and 89.48 %, respectively.
CONCLUSION
In this paper, a student performance prediction model has been designed by integrating two classification approaches, namely Support Vector Machine with Deep Neural Network. A machine learning process for evaluation is proposed. It is done to help in consuming time and to generate accurate data. Machine learning makes the assessment process better and faster, but also allows you to get feedback from the study. Initially, simple clustering has been performed in order to understand the behavior of students based on their marks obtained. Also, DNN is used to train the system based on the clustered student data, and SVM is used for validation. The cross-validation process enhanced the prediction accuracy, and hence about 89.48 % of accuracy has been attained.
REFERENCES
[1]. Bansal, A., Sharma, M., & Goel, S. (2017). Improved k-means clustering algorithm for prediction analysis using classification techniques in data mining. International Journal of Computer Applications, 157(6), 0975-8887.
[2]. Almarabeh, H. (2017). Analysis of students' performance by using different data mining classifiers. International Journal of Modern Education and Computer Science, 9(8), 9.
[3]. Hussain, S., Dahan, N. A., Ba-Alwib, F. M., & Ribata, N. (2018). Educational data mining and analysis of students’ academic performance using WEKA. Indonesian Journal of Electrical Engineering and Computer Science, 9(2), 447-459. [4]. Fernandes, E., Holanda, M., Victorino, M., Borges, V., Carvalho, R., & Van Erven, G. (2019). Educational data mining:
Predictive analysis of academic performance of public school students in the capital of Brazil. Journal of Business Research, 94, 335-343.
[5]. Asif, R., Merceron, A., Ali, S. A., & Haider, N. G. (2017). Analyzing undergraduate students' performance using educational data mining. Computers & Education, 113, 177-194.
[6]. Soni, A., Kumar, V., Kaur, R., & Hemavath, D. (2018). Predicting student performance using data mining techniques. International Journal of Pure and applied Mathematics, 119(12), 221-227.
[7]. Yang, F., & Li, F. W. (2018). Study on student performance estimation, student progress analysis, and student potential prediction based on data mining. Computers & Education, 123, 97-108.
[8]. Asogbon, M. G., Samuel, O. W., Omisore, M. O., and Ojokoh, B., A multi-class support vector machine approach for students academic performance prediction. International Journal of Multidiscplinary and Current Research 4:210–215, 2016.
[9]. Pratiyush, G., and Manu, S., Classifying educational data using support vector machines: A supervised data mining technique. Indian J. Sci. Technol. 9(34), 2016.
0 10 20 30 40 50 60 70 80 90 100
100 200 300 400 500 600 700
A c c u r ac y
Total Number of Supplied Student Records SVM
Deep Neural Network
[10]. Kadambande, A., Thakur, S., Mohol, A., and Ingole, A. M., Predicting students performance system. International Research Journal of Engineering and Technology 4(5):2814–2816, 2017.
[11]. Raihana, Z., and Farah Nabilah, A. M., Classification of students based on the quality of life and academic performance by using a support vector machine. Journal of Academia UiTM Negeri Sembilan 6(1): 45–52, 2018.
[12]. Zaldivar-Colado, A., Aguilar-Calderon, J. A., Garcia-Sanchez, O. V., Zurita-Cruz, C. E., Moncada Estrada, M., and Bernal-Guadiana, R., Artificial neural networks for the prediction of students academic performance, 8th International Technology, Education and Development Conference, 2014.