Division V
CENTRIFUGE TESTING AND SEISMIC RESPONSE ANALYSIS FOR
UPLIFT BEHAVIOR OF SPREAD FOUNDATION STRUCTURES ON ROCK
Yuki Ogase1, Takada Akinobu2, Tsuyoshi Honda2, Shodo Akita1, Naoto Yabushita3, Takuya Suzuki2, and Naohiro Nakamura4
1
Civil Engineering & Architectural Dept., Japan Nuclear Fuel Ltd., Aomori, Japan
2
R&D Institute, Takenaka Corporation, Chiba, Japan
3
Power Engineering Dept., Takenaka Corporation, Tokyo, Japan
4
Graduate School of Engineering, Hiroshima University, Hiroshima, Japan
ABSTRACT
This paper presents the results of simulation analyses of centrifugal load testing, undertaken to verify the analytical accuracy of uplift behavior evaluation using a three-dimensional FE model of a spread foundation structure built on bedrock. The analytical results of the simulation are compared with experimental results to clarify differences and to determine modeling requirements for maintaining analytical accuracy in three-dimensional FE models using joint elements.
INTRODUCTION
When spread foundation structures on rock are subjected to large seismic motions, significant uplift might occur. Uplift behavior during an earthquake is an important consideration in the seismic design of a building for ensuring safety (e.g., nuclear-power-related facilities).
Many experimental or analytical studies on this problem have been conducted previously. For the seismic design of a nuclear power plant, analytical studies on nonlinear rocking behavior have been conducted (e.g., Muto et al. 1979). Moreover, experimental studies using shaking tables or centrifugal tests have been conducted (e.g., Yano et al. 1983). Analytical and experimental studies have also been performed on other types of building (e.g., Midorikawa et al. 2009).
Few previous studies have investigated significant uplift behavior. Thus, in this work, experimental and analytical studies were conducted to improve the understanding of the uplift behavior of spread foundation structures on bedrock. A simulation analysis of centrifugal load testing was undertaken to verify, the analytical accuracy of uplift behavior evaluation using a three-dimensional FE model of a spread foundation structure built on bedrock. To investigate the differences and to establish the modeling requirements for maintain analytical accuracy in three-dimensional FE modes using joint elements, this paper presents a comparison of the simulated and experimental results.
CENTRIFUGAL TEST
Centrifugal Model
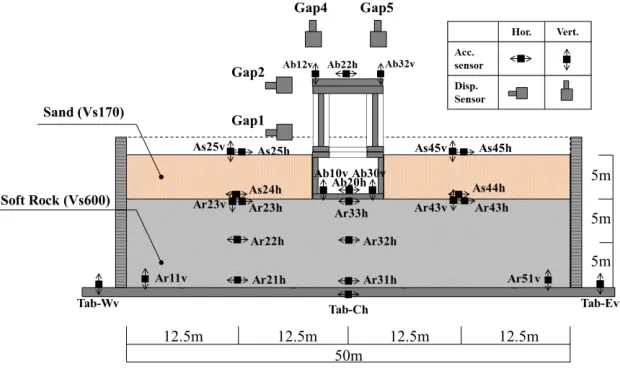
Centrifugal testing was undertaken using a centrifugal acceleration field of 50 G and a laminar shear container to consider two separate cases. Case 1 involved the model shown in Fig. 1 in a “non-embedded condition”; i.e., after the subsurface layer (labeled “sand”) had been removed. In Case 2, the prototype scale model was maintained in the “embedded” condition depicted in Fig. 1. A diagram and photograph of the model structure are shown in Fig. 2(a) and 2(b), respectively.
400 kN/m2. The structure consisted of an underground portion (1F), aboveground portion (2F), and deadweight tonnage (RF), each manufactured from welding steel (SS400, SM490) and connected by bolts. The original model was planned as a rigid body with a center of gravity 6.7 m from the base of the foundation and a primary natural frequency of 25 Hz (real conversion).
The soil comprised a rock-bearing stratum of cement-treated soil and a subsurface layer of Iide silica sand 4-7 (i.e., dry, well-graded sand). To manufacture the load-bearing stratum, cement-treated soil was produced by mixing Iide silica sand 6 with Kaolin clay to a 4:1 ratio by weight. To this was added an amount of blast furnace B-type cement equivalent to 6.125% of the dry weight of the mixture and water amounting to 28.7% of the dry weight. The resulting cement-treated soil had a wet weight of t = 1.967
g/cm3 and an unconfined compression strength of qf = 830 kN/m
2
. The constants for its elastic wave speed (P wave, S wave) were Vp = 1,259 m/s and Vs = 608 m/s, or Poisson ratio was = 0.340.
Fig. 1 Model foundation outline (centrifuge acceleration: 50 G, real conversion, embedded).
(a) Diagram of structure (b) Top-down view of structure
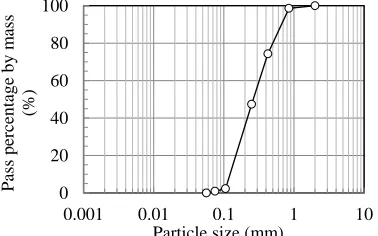
The same load-bearing stratum was used for Cases 1 and 2. The subsurface layer was developed using a dehydrated sand mixture of Iide 4-7, the particle size distribution of which is shown in Fig. 3 (s =
2.646 g/cm3; emax = 0.845; emin = 0.485; relative density, Dr = 100%; d = 1.782 g/cm
3
). For the confining pressure of the subsurface layer under the assumed centrifugal field (K0 = 0.5), the wave speed (S) results
derived from bender elements using triaxial test equipment were around Vs = 135-205 m/s. Using the
confining pressure at the average depth of the surface foundation (GL - 2.5 m), this increased to about 170 m/s.
Profile Side Contact Conditions
The 1F outer wall in Case 2 was in contact with the subsurface layer; this test assumed the outer wall was not subject to any shear resistance. To create these “frictionless” conditions, silicon grease (Shinetsu KS-63G) was applied to the 1F outer wall, and 0.3-mm-thick membrane sheets were pasted onto the four walls. According to Tatsuoka et al. (1984), this treatment reduces the coefficient of friction to μ < 0.02. The area to which the boundary condition was applied is shown in Fig. 2(b).
Measurement Plan
The measuring instruments used in the testing (Fig. 1) were accelerometers and earth pressure gauges installed at the base of the foundation, and contactless gap sensors for determining displacement. A sampling speed of 100 Hz was used with real conversion. Fig. 4 shows the position of the earth pressure gauges that were installed at the base of the foundation to measure the ground contact ratio.
0 20 40 60 80 100
0.001 0.01 0.1 1 10
Pass
percentag
e
b
y
m
ass
(%)
Particle size (mm)
Fig. 3 Particle size distribution of subsurface layer (Iide silica sand 4-7).
Fig. 4 Configuration of earth pressure gauges on underside of model structure.
-4 0 4
0 10 20 30 40 50 60
2E
EF
Time(s) Acc.(m/s2)
0 2 4 6 8
0.01 0.1 1 10
2E
EF
Period(s) Acc.(m/s2)
Controllable Range
(a) Time history waveform. (b) Acceleration response spectra (h = 5%).
Input Seismic Motion
To generate seismic motion, an L2 earthquake wave-in notification (Kobe register) was used as an input wave (2E). As with any shaking table experiment using a centrifugal field, it was necessary to stipulate a compound wave (E + F) comprising the input wave and rebound waves at the bottom of the laminar shear container. To achieve this, an earthquake response analysis was implemented, according to a one-dimensional wave motion theory that does not consider the model structure, from which compound waves in the laminar shear container were drawn up. Once the input signal was adjusted to reproduce this
compound wave, the maximum acceleration of input motion was set to 300 cm/s2.
Fig. 5 shows the history of the input wave (2E) and compound wave (E + F) at the bottom of the laminar shear container over time. The acceleration response spectrum of the input wave and compound wave at the base of the foundation are also shown. The period of controlled excitation (0.25–2.00 s) is indicated by arrows.
ANALYSIS CONDITIONS
Model Overview
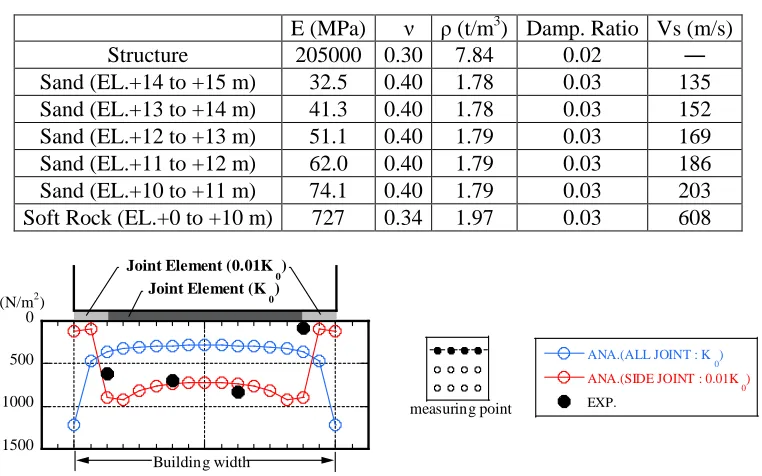
Fig. 6 shows a top-down view of the embedded analysis model used in Case 2 drawn at prototype scale. The soil was modeled as eight solid elements (integral points: 2 × 2 × 2), while the structure was modeled as four node-plate elements (integral points: 2 × 2). Each was treated as a linear element using the physical properties corresponding to the test results shown in Table 1. Proportional stiffness damping was used in conjunction with a reference frequency of 1 Hz.
The foundation was modeled at horizontal intervals of 50 m relative to the laminar shear container, and at vertical intervals of 10 m from the bottom of the foundation. The mesh partition was maintained at no more than 1/5 of the 20 Hz wavelength of the Vs (160 m/s) for the subsurface layer (i.e., no more than
160/20/5 = 1.6 m), and it was established to partition the foundation of the structure into 16 separate sections (0.5 m pitch). This same mesh partition was used for the mesh partitions of the structure, the details of which were modeled after adding modifications of ±0.25 m. The embedded model had the largest number of nodes and elements, i.e., 90,000 of each.
A repeat boundary condition was used at the side of the soil, while a fixed boundary was used at the bottom of the soil. The weight of the frame of the laminar shear container was not taken into account.
Boundary Conditions Between The Foundation And The Structure
The foundation uplift behavior was evaluated by setting up a joint element between the underside of the structure and the soil. Joint elements are almost “rigid” in response to compression, but have no stiffness in response to tension (Nakamura et al. 2007). These need to be implemented such that during contact they have sufficient rigidity in the shear direction, but no rigidity during separation in the tensile direction. The validity of using a joint element has been verified through comparison with the Green Function Method in Nakamura et al. (2016). An almost “rigid” joint element is one with a stiffness 100× that calculated by vibration admittance theory.
Fig. 7 shows one example of the comparison between the experimental measurements of the initial stress distribution in the foundation underside and the analysis values. Note that the end stress in the experimental measurements tended to be smaller in comparison with the contact pressure occurring at the end of the analytical results, which used a basic value for the rigidity of all joint components.
the load-bearing stratum (the cement-treated soil) due to the large initial stress occurring at the edge of the foundation.
The joint elements in the embedded model were also implemented on the sides, but because the experimental conditions were designed to make the coefficient of friction on the sides close to zero, rigidity in the shear direction was set close to zero. The rigidity in the normal direction was set to the same value as the joint element below the structure, and detachment in the normal vector direction was not considered.
Input Seismic Motion
The acceleration history of the seismic motion input was measured in both the horizontal and the vertical directions. The horizontal acceleration was input as Tab-Ch in Fig. 1, while the vertical acceleration was input through the average acceleration of Tab-Wv and Tab-Ev. The seismic motion input for the experimental results was passed through a high-cut filter process (8–14 Hz), because high peaks were observed in the high oscillation range that fell outside of the guaranteed performance frequency range of the centrifugal load equipment. Analysis was performed from the start of the earthquake until 20 s had elapsed.
Fig. 6 Top-down view of analytical model (embedded).
Table 1: Components of foundation and structure.
E (MPa) ν ρ (t/m3) Damp. Ratio Vs (m/s)
Structure 205000 0.30 7.84 0.02 ―
Sand (EL.+14 to +15 m) 32.5 0.40 1.78 0.03 135
Sand (EL.+13 to +14 m) 41.3 0.40 1.78 0.03 152
Sand (EL.+12 to +13 m) 51.1 0.40 1.79 0.03 169
Sand (EL.+11 to +12 m) 62.0 0.40 1.79 0.03 186
Sand (EL.+10 to +11 m) 74.1 0.40 1.79 0.03 203
Soft Rock (EL.+0 to +10 m) 727 0.34 1.97 0.03 608
0
500
1000
1500
ANA.(ALL JOINT : K 0) ANA.(SIDE JOINT : 0.01K
0)
EXP.
Joint Element (0.01K
0)
Joint Element (K
0)
measuring point (N/m2)
Building width
0
500
1000
1500
ANA.(ALL JOINT : K 0) ANA.(SIDE JOINT : 0.01K
0)
EXP.
Joint Element (0.01K
0)
Joint Element (K
0)
measuring point (N/m2)
Building width
Other Analytical Conditions
The Newmark-β method was used in the integral method, and to maintain analytical stability in the nonlinear areas, such as resettling after uplift, a value attenuation of β = 0.6, y = 0.3025 was used. The time increment used for analysis was set at 0.002 s, while the output time increment was set at 0.01 s.
VERIFYING SIMULATION ACCURACY
This section verifies the analytical accuracy of the simulation analysis implemented using the analytical conditions described in Section “ANALYSIS CONDITIONS”, and it also considers the limits of its analytical accuracy. As described in Section “Input Seismic Motion”, strong peaks were observed in the high-oscillation component of the experimental results; therefore, a high-cut filter process (8–14 Hz) was undertaken to allow for direct comparison.
Non-Embedded Condition
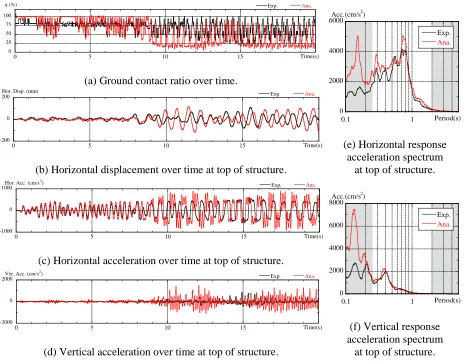
A comparison of the experimental and analytical results for the non-embedded condition is shown in Fig. 8. The items compared over time were the ground contact ratio, horizontal displacement for the top of the structure, horizontal acceleration, vertical acceleration, and acceleration response spectrum for the top of the structure (h = 5%).
The ground contact ratio values were calculated as the contact area divided by the total foundation area, based on the values obtained from the earth pressure gauges installed on the underside of the structure. In the analysis, it was calculated based on the vertical stress of the joint elements installed between the structure and the soil. The acceleration response spectrum was completed, as shown in Fig 5, except for the frequency bands for which the credibility of the equipment load could be maintained.
In verifying the history of the ground contact ratio with time shown in Fig. 8(a), it was found that the experiments and analysis corresponded favorably to each other until 9 s had elapsed. However, disparities arose beyond this point and the analysis tended to provide smaller values than the experiments (i.e., the uplift was higher in the analysis values). The ground contact ratio in the analysis results was generally 25% lower, but even when the analysis produced values of less than 25%, the experimental results did not produce equally low ground contact ratios.
Divergence between the experimental and analytical results also occurred with the time histories of horizontal displacement, horizontal acceleration, and vertical acceleration (Fig. 8(b)–(d), respectively). In each of these cases, the results matched until about 9 s had elapsed, after which the analysis results tended to overestimate both the extent and the period of response. The analysis results therefore tended to overestimate uplift behavior, matching the trend seen in Fig. 8(a) for ground contact ratio. Regarding horizontal acceleration (Fig. 8(c)), although high-oscillation waves were confirmed to have occurred at the peak time for acceleration, this might simply reflect secondary-mode excitation that occurs during major uplift, as highlighted by Ishihara et al. (2009).
The acceleration response spectra shown in Fig. 8(e) and 8(f) (drawn from waveforms of h = 5%, 0–20 s) confirm that the analytical and experimental results corresponded well at the frequency ranges guaranteed by the centrifuge equipment. The differences in the both response and the period in the time histories of the waves did not have a major effect on the spectrum values, but the analysis results were found to exceed some of the experimental results.
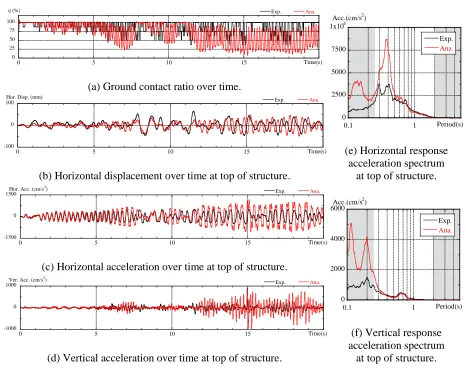
Embedded Condition
Comparisons of the experimental and analysis results for the embedded condition are shown in Fig. 9. Note that the items compared are the same as for the non-embedded condition.
point, the two sets of results diverged in a similar manner to that seen in the non-embedded condition, with the analysis results tending to be lower. However, the results in this case generally matched until reaching 25%. For the horizontal displacement, horizontal acceleration, and vertical acceleration at the top of the structure (Fig. 9(b)–(d)), discrepancies again arose when the ground contact ratio fell below 25%. Thus, although the results matched until around 8 s had elapsed, the disparities that started to arise beyond this resulted in the analysis results tending to overestimate the both the extent and the period of response (in other words, to overestimate the uplift). With the acceleration waveform for the embedded condition (Fig. 9(c)), high-oscillation waveforms were confirmed to have occurred during uplift when the ground contact ratio fell below 25%.
The comparison between the acceleration response spectra in Fig. 9(e) and 9(f), (drawn from a waveform h = 5%, 0–20 s) revealed a relatively large variation between the analytical and experimental results, with the analytical results producing overestimations. This also had an effect on the acceleration response spectra when evaluating uplift in the embedded condition. However, as shown in Fig. 10, the discrepancy in the spectra was small in the first 0–8 s, during which time the disparity in ground contact ratio was also small. The analysis spectrum values, on the other hand, had high accuracy in the region in which the ground contact ratio was above 25%.
0 25 50 75 100
0 5 10 15 20
Exp. Ana.
Time(s) (%)
0 2000 4000 6000
0.1 1
Exp.
Ana.
Period(s) Acc.(cm/s2)
(e) Horizontal response acceleration spectrum
at top of structure. (a) Ground contact ratio over time.
-200 0 200
0 5 10 15 20
Exp. Ana.
Time(s)
Hor. Disp. (mm)
(b) Horizontal displacement over time at top of structure.
-1000 0 1000
0 5 10 15 20
Exp. Ana.
Time(s)
Hor. Acc. (cm/s2)
0 2000 4000 6000 8000
0.1 1
Exp.
Ana.
Period(s) Acc.(cm/s2
)
(f) Vertical response acceleration spectrum
at top of structure. (c) Horizontal acceleration over time at top of structure.
-2000 0 2000
0 5 10 15 20
Exp. Ana.
Time(s) Ver. Acc. (cm/s2)
(d) Vertical acceleration over time at top of structure.
0 25 50 75 100
0 5 10 15 20
Exp. Ana. Time(s) (%) 0 2500 5000 7500 1x10⁴ 0.1 1 Exp. Ana. Period(s) Acc.(cm/s2)
(e) Horizontal response acceleration spectrum
at top of structure. (a) Ground contact ratio over time.
-100 0 100
0 5 10 15 20
Exp. Ana.
Time(s)
Hor. Disp. (mm)
(b) Horizontal displacement over time at top of structure.
-1500 0 1500
0 5 10 15 20
Exp. Ana.
Time(s)
Hor. Acc. (cm/s2)
0 2000 4000 6000 0.1 1 Exp. Ana. Period(s) Acc.(cm/s2)
(f) Vertical response acceleration spectrum
at top of structure. (c) Horizontal acceleration over time at top of structure.
-1000 0 1000
0 5 10 15 20
Exp. Ana.
Time(s) Ver. Acc. (cm/s2)
(d) Vertical acceleration over time at top of structure.
Fig. 9 Comparison of experimental and analysis results (embedded).
0 2000 4000 6000 0.1 1 Exp. Ana. Period(s) Acc.(cm/s2)
0 500 1000 1500 2000 0.1 1 Exp. Ana. Period(s) Acc.(cm/s2)
(a) Horizontal. (b) Vertical.
Limits of Analysis Model
This section considers the reason why the ground contact ratio determined by the FE model established in this paper gets smaller in comparison with the experimental values as the uplift increases.
As reported in the literature (Nakamura et al. 2014), the discrepancy between the analysis and experimental results might be attributable to local nonlinear transformations in the ground. That is, although the contact pressure in the experiment increases inversely when the area of the ground occupied by the building is smaller, local nonlinear transformations in the soil might occur. Fig. 11 shows the values recorded by the earth pressure gauges in an embedded condition, which clearly suggest that initial stress is released and residual deformations remain in the ground. However, visual inspection after the experiment failed to confirm that any such residual deformation actually occurred. Any local nonlinearity in the ground during the experiment is therefore considered small, as any local nonlinear transformations should be accompanied by a sinking of the structure, as shown in Fig. 12. If this produced the same rotational deformation, it would lead to an increase in the ground contact area. This type of phenomenon did occur in the experiments; thus, in might have led to the ground contact ratio being smaller in the analysis results because of the use of the linear soil model
.
As reference, a comparison of the experiment and the analysis results for the non-embedded condition with the nonlinear soil condition of Fig. 13 is presented. The analytical condition is similar to that of Nakamura et al. (2014).
0 500
0 1 2 3 4 5 55 56 57 58Time (sec)59 60
(kPa)
Initial Start
Measuring Point End
Measured
(a) Linear foundation (b) Nonlinear foundation
Fig. 11 Comparison of earth pressure gauge readings during excitation.
Fig. 12 Effects of foundation nonlinearity on uplift behavior.
0 25 50 75 100
0 5 10 15 20
Exp. Ana.
Time(s) (%)
0 2000 4000 6000
0.1 1
Exp.
Ana.
Period(s) Acc.(cm/s2)
(c) Horizontal response acceleration spectrum
at top of structure. (a) Ground contact ratio over time.
-1000 0 1000
0 5 10 15 20
Exp. Ana.
Time(s)
Hor. Acc. (cm/s2)
(b) Horizontal acceleration over time at top of structure.
In verifying the history of the ground contact ratio (Fig. 13(a)) and the horizontal acceleration for the top of the structure (Fig. 13 (b)), it was found that the experiments and analysis corresponded favorably to each other except between 9 and 13 s. The horizontal acceleration response spectra shown in Fig. 13(c) confirm that the analytical and experimental results corresponded well at all frequency ranges.
If the ground contact ratio were small, it might be necessary to use a nonlinear soil condition for analysis.
CONCLUSIONS
In this work, experimental and analytical studies were conducted to clarify the significant uplift behavior of spread foundation structures built on bedrock. Based on the results of this study, the following insights were obtained:
1) If established analytical conditions are used, then regardless of whether the structure is embedded, the experimental and analytical results match if the ground contact ratio is no less than 25%.
2) Disparities occur between the experimental and analytical results if the ground contact ratio is less than 25%. Moreover, in this region, an analysis will tend to indicate higher displacement and acceleration responses than the experimental results.
3) If the ground contact ratio is small, using a nonlinear soil condition might improve the accuracy of the analysis results compared with a linear condition.
References
Ishihara T., Midorikawa M., Azuhata T. (2009). “Model properties and free vibration of uplifting behavior of multistory buildings modeled as uniform shear-beam,” Architectural Institute of Japan,
Journal of Structural and Construction Engineering, No. 640, pp. 1055–1061, JP
Midorikawa M., Sudo T., Asari T., Azuhata T., Ishihara T. (2009). “Three-dimensional seismic response of ten-story steel frames with yielding base plates allowed to uplift,” Journal of Structural and Construction Engineering, No. 637, pp. 495-502, JP
Muto K., Kobayashi T. (1979). “Nonlinear rocking analysis of nuclear reactor buildings: simultaneous horizontal and vertical earthquake inputs,” Architectural Institute of Japan, Journal of Structural and Construction Engineering, No. 276, pp. 69–77, JP
Nakamura N., Ino S., Kurimoto O., and Miake M. (2007). “An estimation method for basemat uplift
behavior of NPP building,” Nuclear Engineering and Design, Vol. 237, pp. 1275–1287
Nakamura N., Kashima K., Ikeda S., Suzuki T., Kamoshita N., Mizobuchi T., Inukai M., Iiba M. (2014). “Horizontal load capacity of middle-high rise RC building with multi-story shear wall considering uplift behaviour: Part 16 Earthquake response analysis considering soil nonlinearity,” Architectural Institute of Japan Summaries of Technical Papers of Annual Meeting, Structural II, pp. 1031–1032, JP
Nakamura N., Inoda K., Suzuki T., Matsumoto K. (2016). “Study on induced vertical motion due to basemat uplift of building during severe earthquake,” Architectural Institute of Japan, Journal of Structural and Construction Engineering, No. 721, pp. 525–535, JP
Tatsuoka F., Molenkamp F., Torii T., Hino T. (1984). “Behavior of lubrication layers of platens in element tests,” Soils and Foundations, Vol. 24, No. 1, pp. 113–128