ABSTRACT
DAVIS, XIN YANG. Computational Modeling of Cell Signaling Network Using Hill
Function and Markov Chain Monte Carlo Methods. (Under the direction of M. Todd See and Roger L. McCraw).
Computational models have been successfully used by mathematicians, chemists and
physicists, but rarely used by biologists. The reasons are probably related to the dynamics in biological systems and the uncertainty in a surrounding environment. Computational models can be very useful tools when they provide experimentally testable predictions. In this study, we developed a new mathematical modeling method using the Hill function (see glossary) and the Markov Chain Monte Carlo (MCMC) methods (see glossary). We modeled the epidermal growth factor receptor (EGFR) signaling transduction network with no experimental data available for the biochemical reactions. The model is based on the
signaling directions and activation or inhibition information in the network. We also used this mathematical modeling method to model epidermal growth factor (EGF)-stimulated
signaling network model that indicate that cell signaling is mainly enzymatic regulation. Second, we developed a model EGF-stimulated PITP in EGFR signaling network with four different structures. From statistical data analysis and by comparing the simulation results, we observed some common properties among these models. Ras GDP and GTP conversion, and phosphatidylinositol (PI) and phosphatidylinositol 3, 4-biphosphate (PIP2) conversion are more stable and balanced in the network for all four models. We simulated Ras, PI3K
Computational Modeling of Cell Signaling Network Using Hill Function and Markov Chain Monte Carlo Methods
by Xin Yang Davis
A dissertation submitted to the Graduate Faculty of North Carolina State University
in partial fulfillment of the requirements for the degree of
Doctor of Philosophy
Quantitative Genetics
Raleigh, North Carolina July 6, 2010
APPROVED BY:
_______________________________ ______________________________
M. Todd See Roger L. McCraw
Committee Chair Committee co-Chair
________________________________ ________________________________
DEDICATION
BIOGRAPHY
ACKNOWLEDGMENTS
I want to thank my mentors and committee members for your valuable advices and training. All of you are my role models for your dedication to research and training students. Thanks for your kindness that you always had time for my research project despite you all have a very busy schedule.
Dr. Roger McCraw introduced me to quantitative genetics, accepted me as his student even though the time was close to his retirement. As my mentor he encouraged me to find research projects interest me the most. He provided funding for my research and the international conferences I attended during my graduate school study.
Dr. Todd See was my committee chair when he had many responsibilities as the department head and professor at the same time. I benefited from his advices on how to improve my presentation skills.
Dr. Vytas Bankaitis allowed me to do research project in his lab despite his many responsibilities and very busy schedule. He mentored me on cell biology and advised me on research project on weekly basis. Because of working for him, I had the privilege to sit in many courses in UNC medical school and gained knowledge useful for my research project.
Dr. Jason Haugh taught me cell signaling modeling and spent many hours to advise me on my research project.
Dr. Charles Smith offered his office hours to me for asking questions and suggested many good modeling books for me to read.
Thanks to Dr. Gabriel Weinreb, Dr. Ken Jacobson, Dr. Tim Elston and Dr. Ju Youn Beak for their valuable discussions.
I want to thank professors at NCSU and UNC who allowed me to sit in their lectures and let me access their Blackboard for course materials. Their generosity provided me the opportunity to learn more knowledge that has greatly helped my research project and beyond.
Dr. Jeffrey Thorne introduced me to systems biology, which led me to do this research project at UNC medical school.
Dr. Miles Engell helped me to get into her Biology class. Her class was a good foundation in biology for me and enabled me to continue on learning Cell Biology, Neurobiology, and completing this research project in cell signaling.
The administrative personnel in the UNC Department of Cell and Developmental Biology were very helpful in arranging project meetings, and providing parking coupons.
TABLE OF CONTENTS
LIST OF TABLES ... viii
LIST OF FIGURES ... ix
GLOSSARY ... 1
References ... 5
Chapter One BACKGROUND AND MOTIVATION ... 9
Introduction ... 9
Intracellular Signal Transduction Network ... 11
Epidermal Growth Factor and Receptor ... 14
PI-3-Kinase Pathway ... 15
MAP-Kinase Pathway ... 16
Phospholipids Cr Pathway ... 17
Systems Biology ... 18
Outline of Research ... 20
References ... 21
Chapter Two COMPUTATIONAL MODELING METHODS ... 25
Introduction ... 25
Boolean Method ... 26
Coarse-grained Method ... 27
Ordinary Differential Equation Method ... 28
Other Related Methods ... 30
Conclusion ... 30
References ... 31
Chapter Three PARAMETER SELECTION METHODS ... 33
Introduction ... 33
Least Squares Method ... 33
Markov Chain Monte Carlo Methods ... 34
The Metropolis-Hastings Algorithm ... 36
Convergence Diagnostics ... 38
Conclusion ... 39
References ... 40
Chapter Four MODELING CELL SIGNALING NETWORK USING HILL FUNCTION AND MARKOV CHAIN MONTE CARLO METHODS ... 41
Introduction ... 41
Modeling EGFR Signal Transduction Network ... 41
Results and Discussion ... 45
Model Formulation ... 45
Model Equations ... 46
Model Fitting ... 48
Statistical Data Analysis of Parameter Convergence ... 50
Model Limitation ... 53
Conclusion ... 53
Materials and Methods ... 55
Model Development ... 55
Governing Equations ... 55
Parameter Selection Using Markov Chain Monte Carlo Methods ... 56
Markov Chain Monte Carlo Simulation ... 57
Acknowledgements ... 60
References ... 61
Chapter Five MODELING PITP USING HILL FUNCTION AND MARKOV CHAIN MONTE CARLO METHODS ... 64
Introduction ... 64
Modeling PITP in EGFR Signal Transduction Network ... 65
Results and Discussion ... 73
Model Formulation ... 73
Model Equations ... 76
Model Fitting ... 80
Statistical Data Analysis of Parameter Convergence ... 83
Statistical Data Analysis of Weights in Relation to Signaling Regulation .... 87
Simulation of Mutated Oncogenes and Tumor Suppressors in Cancer Research ... 93
Perturbation of PITP ... 98
Model Prediction and Limitation ... 99
Conclusion ... 99
Model Development ... 101
Governing Equations . ... 101
Parameter Selection Using Markov Chain Monte Carlo Methods ... 102
Markov Chain Monte Carlo Simulation ... 103
Supplement ... 106
Acknowledgements ... 118
References ... 119
Chapter Six FUTURE DIRECTION ... 125
LIST OF TABLES
Chapter Four
Table 1. Protein initial values ... 43
Table 2. Circuits of the EGFR signaling network ... 46
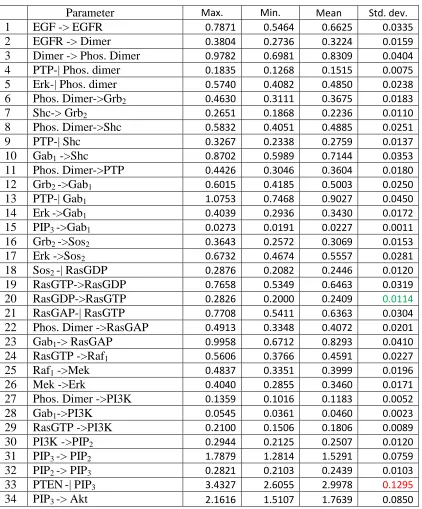
Table 3. Weight parameter sets selected from simulations ... 52
Chapter Five Table 1. Model B, Circuits of the EGFR signaling network ... 74
Table 2. Model D, Circuits of the EGFR signaling network ... 75
Table 3. Protein initial values ... 80
Table 4. Model B, Weight parameter sets selected from simulations ... 88
Table 5. Model D. Weight parameter sets selected from simulations ... 89
Supplement Table 1. Model A, Circuits of the EGFR signaling network ... 106
Table 2. Model C, Circuits of the EGFR signaling network ... 107
Table 3. Model A, Weight parameter sets selected from simulations ... 114
LIST OF FIGURES
Chapter One
Figure 1. Schematic diagram of EGFR signal transduction network ... 13
Chapter Three Figure 1. Measuring the depth of the Nile ... 33
Figure 2. The MCMC chain of 9000 draws from the posterior distribution 38
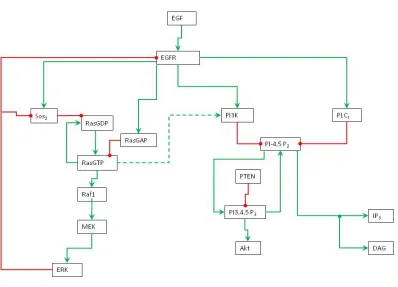
Chapter Four Figure 1. Schematic representation of EGFR signal transduction network .. 40
Figure 2. EGF-stimulated response averaged from selected parameter sets 49
Figure 3. Histograms of posterior distribution ... 50
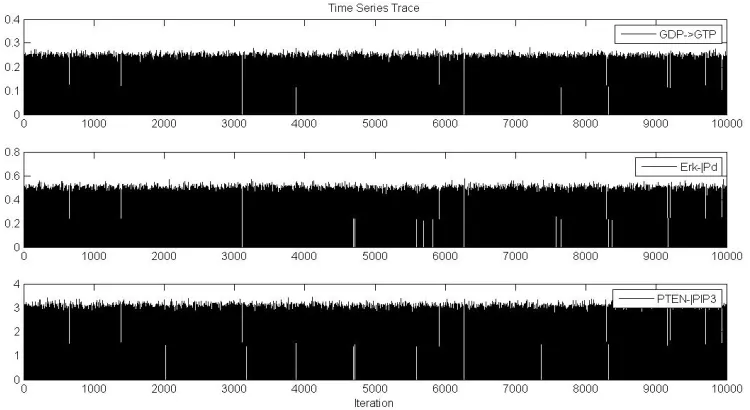
Figure 4. Time series trace of posterior distribution ... 51
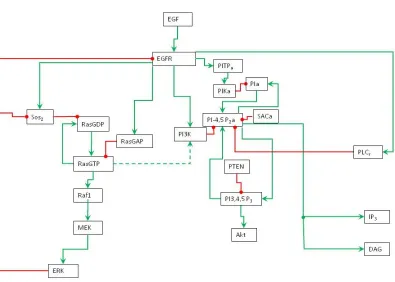
Chapter Five Figure 1. PITP Model A, schematic representation of EGFR signaling Transduction network ... 69
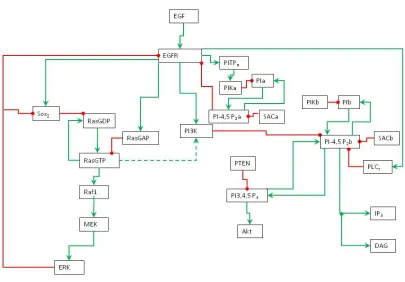
Figure 2. PITP Model B, schematic representation of EGFR signaling Transduction Network ... 70
Figure 3. PITP Model C, schematic representation of EGFR signaling Transduction network ... 71
Figure 4. PITP Model D, schematic representation of EGFR signaling Transduction network ... 72
Figure 5. Model B, EGF-stimulated response from Erk and Akt ... 81
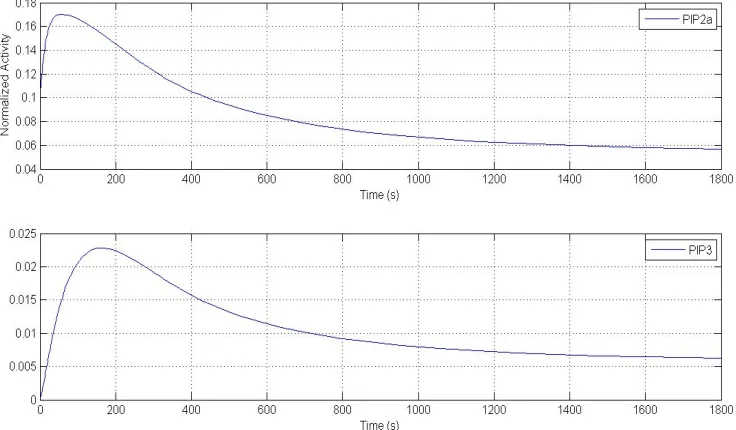
Figure 6. Model B, EGF-stimulated response from PIP2 and PIP3 ... 82
Figure 7. Model D, EGF-stimulated response from Erk and Akt ... 83
Figure 8. Model D, EGF-stimulated response from PIP2 and PIP3 ... 83
Figure 9. Model B, Histograms of posterior distribution ... 84
Figure 10. Model B, Histograms of posterior distribution ... 85
Figure 11. Model B, Time series trace of posterior ... 86
Figure 12. Model D, Time series trace of posterior ... 86
Figure 13. Model B, colored EGFR signaling network ... 92
Figure 14. Model D, colored EGFR signaling network ... 93
Figure 15. Model B, simulation of mutated oncogene Ras ... 94
Figure 16. Model D, simulation of mutated oncogene Ras ... 95
Figure 17. Model B, simulated mutated oncogene PI3K ... 96
Figure 18. Model D, simulated mutated oncogene PI3K ... 96
Figure 19. Model B, simulate PTEN as a tumor suppressor ... 97
Supplement
Figure 1. Model A, EGF-stimulated response ... 110
Figure 2. Model C, EGF-stimulated response ... 111
Figure 3. Model A, Histograms of posterior distribution ... 111
Figure 4. Model C, Histograms of posterior distribution . ... 112
Figure 5. Model A, Time series trace of posterior distribution ... 112
Figure 6. Model C, Time series trace of posterior distribution ... 113
Figure 7. Model A, colored EGFR signaling network ... 116
GLOSSARY
Markov Chain Monte Carlo method - simulate direct draws from some complex, nonstandard multivariate distributions of interest [Chib et al. 1995].
Markov Chain - a sequence of random variables generated by the Markov process which is defined by its transition probabilities. The transition probability is a conditional distribution function that represents the probability of moving from the current point to a future point for the same parameter [Walsh 2004].
Monte Carlo - sampling uses Bayesian inference that is based on random sampling. It was introduced by Metropolis [Metropolis et al. 1953] at Los Alamos National Laboratory. Hill function - in 1910, British physiologist Archibald Vivian Hill formulated the Hill function to describe the sigmoidal O2 binding curve of hemoglobin [Hill 1910].
Hill coefficient - the Hill coefficient n quantifies the binding cooperativeness resulted from the interactions between binding sites. A coefficient of 1 indicates non-cooperative; a coefficient greater than 1 indicates positive cooperative binding; a coefficient less than 1 indicates negative cooperative binding [Hill 1910].
EGFR - epidermal growth factor receptor (EGFR) is a plasma membrane receptor protein, binds to EGF extracellular signaling molecule. The binding activates the receptor, and activates the intracellular signaling pathway.
EGFR dimer - two activated EGFR form an EGFR dimer.
and Gab1 are recruited by binding directly to tyrosine-phophorylated receptors [Birtwistle et al. 2007].
Grb2 - an adaptor protein and links receptor with the Ras-MAPK signaling pathway. It is
recruited by binding directly to tyrosine phosphorylated EGFR dimer.
Shc - an adaptor protein that contains both PTB and SH2 domains and becomes
phosphorylated on tyrosine in response to many different extracellular stimuli. It is recruited by binding directly to tyrosine phosphorylated EGFR dimer, and inhibited by PTP-1B. PTP-1B - protein tyrosine phosphatase-1B (PTP-1B) is a negative regulator of insulin signaling. It is activated by tyrosine phosphorylated EGFR dimer, and inhibits Shc, tyrosine phosphorylated EGFR dimer, and Gab1.
Gab1 - Grb2 associated binding protein 1 (Gab1), is secondary recruit and binding to Shc SH3
domains of Grb2. It is also activated by Grb2. Gab1 can also be recruited to the membrane via its PH domain binding to PIP3 [Holgado-Madruga et al. 2003].
Sos2 - son-of-sevenless (also called Ras-GEF, guanine nucleotide exchange factor) is an
exchange factor, stimulates the inactive Ras protein to replace its bound GDP by GTP, which activates RasGDP to relay the signal downstream. SOS2 is secondary recruit, and binds to Src SH3 domains of Grb2.
RasGDP - Ras protein in GDP-bond form and inactive. It becomes active when exchanges GDP for a GTP molecule in response to extracellular signals.
when bound with GDP. RasGTP is converted back to RasGDP by RasGAP. RasGTP activates Raf1, and has link to PI3K.
RasGAP - Ras GTPase-activating protein is a regulatory protein and controls GTP-binding proteins. It deactivates the proteins by hydrolysis of bound GTP. RasGAP is activated by tyrosine phosphorylated EGFR dimer and Gab1.
Raf1 - (also called MAPKKK), a protein kinase, and receiving an activating signal directly from Ras, it phosphorylates and activates MEK (MAPKK).
MEK - (also called MAPKK), a protein kinase. It is phosphorylated and activated by Raf1, and in turn activates MAPK.
Erk - extracellular-signal-regulated kinase, (also called MAPK), a protein kinase, activated by Raf1 through MEK. Since the activation of Erk by MEK follows a distributed mechanism [Zha and Zhang, 2001] therefore use a full, mass action description for Erk activation. In the distributed mechanism, the substrate dissociates and rebinds the enzyme between catalysis steps and can lead to potential ultrasensitivity and bistability [Markvich et al. 2004, Ferrel et al. 1998].
PI 3-Kinase - phosphoinositide 3-kinase is plasma-membrane-bound enzyme. Gab1 binds to PI3K as a crosstalk in two different pathways.
PIP2 - phosphatidylinositol 4,5-biphosphate is a phosphorylated inositol phospholipid. It is a
substrate and binds to PI3K to produce PIP3. It is cleaved by PLCr to make IP3 and DAG. PI 3,4,5 P3 - phosphatidylinositol (3,4,5) P3 is a phosphoinositide produced by PIP2 when
PTEN - phosphatase and tensin homolog is a tumor suppressor. It is a negative regulator to regulate PIP3 and prevent PIP3 accumulation in the plasma membrane, therefore inhibiting PI3K signaling.
Akt - (also called PKB) is a protein, converted by PIP3 from inactive form to active form. PITP - phosphoinositide transfer protein can bind and exchange one molecule of
phosphatidylinositol (PI) and facilitate the transfer of these lipids between different membrane compartments. PITP is critical regulator of phosphoinositides in cellular
compartments, and participate in signal transduction and in membrane traffic. Dysfunction of PITP may lead to neurodegeneration diseases.
PI4K - PtdIns 4-OH kinase is an enzyme, activated by PITPa and converts PI to PIP2. PI – phosphatidylinositol is a lipid at cell membrane and in metabolic process. It is phosphorylated to form PIP.
Sac - suppressor of actin is an enzyme, and converts PIP2 back to PI.
PLCr - phospholipase C is a plasma-membrane-bound enzyme that cleaves PIP2 to produce IP3 and DAG.
IP3 - inositol 1,4,5-trisphosphate is a small intracellular mediator. It diffuses through the
cytosol and release Ca2+ from the endoplasmic reticulum (ER) by binding to and opens IP3 - gated Ca2+ - release channels (IP3 receptors) in the ER membrane.
REFERENCES
Alberts, B. et al. (2008) Molecular Biology of THE CELL, Fifth Edition.
Ben-Shlomo I, Yu Hsu S, Rauch R et al. (2003) Signaling receptome: a genomic and evolutionary perspective of plasma membrane receptors involved in signal transduction. Sci STKE 187:RE9.
Berridge MJ, Bootman MD & Roderick HL (2003) Calcium signaling dynamics, homeostasis and remodeling. Nature Rev Mol Cell Biol 4:517-529.
Birtwistle, MR et al. 2007. Ligand-dependet responses of the ErbB signaling network: experimental and modeling analyses. Mol Systems Biol 3:144.
Bourne HR (1995) GTPases: a family of molecular switches and clocks. Philos Trans R Soc. Lond B Biol Sci 349:283-289.
Bradshaw RA & Dennis EA (eds) (2003) Handbook of Cell Signaling. Elsevier: St. Louis. Bretscher, Otto (2005). Linear Algebra with Applications, 3rd ed. Upper Saddle River NJ: Prentice Hall.
Burns ME & Baylor DA (2001) Activation, deactivation, and adaptation in vertebrate photoreceptor cells. Annu Rev Neurosci 24:779-805.
Chen, S., Cowen, C.F.N, and Grant, P.M. (1991). IEEE TRANSACTIONS ON NEURAL
NETWORKS, Vol. 2, No. 2.
Chib, S. and Greenberg, E. (1995) Understanding the Metropolis-Hastings Algorithm. The American Statistician, Vol. 49, No. 4, 327-335.
Dard N & Peter M (2006) Scaffold proteins in MAP kinase signaling: more than simple passive activating platforms. BioEssays 28:146-156.
Dong, C. et al. (2002) MAP kinases in the immune response. Annu Rev Immunol 20:55. Downward J (2004) PI 3-kinase, Akt and cell survival. Semin Cell Dev Biol 15:177-182.
Ferrell JE. Jr. (2002) Self-perpetuating states in signal transduction: positive feedback, double-negative feedback and bistability. Curr Opin Cell Biol 14:140-148.
Gelman, A., and D. B. Rubin. (1992). Inferences from iterative simulation using multiple sequences (with discussion). Statistical Science 7: 457 - 511.
Geyer, C. J. 1992. Practical Markov chain Monte Carlo (with discussion). Stat. Sci.
7: 473–511.
Hastings, W.K. (1970) Monte Carlo sampling methods using Markov Chains and their applications. Biometrika 57:97-109.
Metropolis, N. et al (1953) Equations of state calculations by fast computing machines. J. of
Chemical Physics 21:1087-1091.
Hill AV (1910) The possible effects of the aggregation of the molecules of hemoglobin on its dissociation curves. Proc Of The Phys Society.
Holgado-Madruga et al. (2003), Gab1 is an integrator of cell death versus cell survival signals in oxidative stress, Mol Cell Biol 13 (23) : 4471-84.
Hudmon A & Schulman H (2002) Structure-function of the multifunctional Ca2+ /calmodulin-dependent protein kinase II. Biochem J 364:593-611.
Kolch, W. et al. (2005) When kinases meet mathematics: the systems biology of MAPK signalling. FEBS Letters 579: 1891–1895.
Liu, Y. and Bankaitis, V.A. (2010) Phosphoinositide phosphatases in cell biology and disease. Progress in Lipid Research
49:201-217.
Luttrell LM (2006) Transmembrane signaling by Gprotein-coupled receptors. Methods Mol Bio 332:3-49.
Mitin N, Rossman KL & Der CJ (2005) Signaling interplay in Ras superfamily function.
Curr Biol 15:R563-574.
Moghal, N. and Sternberg, P.W. (1999) Multiple positive and negative regulators of signaling by the EGF-receptor. Curr. Opin. Cell Biol. 11, 190-196.
Mullschleger S, Leowith R & Hall MN (2006) OR signaling in growth and metabolism. Cell
124:471-484.
Pawson T (2004) Specificity in signal transduction: from phosphotyrosine-SH2 domain interactions to complex cellular systems. Cell 116:191-203.
Raftery, A. E., and S. Lewis. 1992b. Comment: One long run with diagnostics: Implementation strategies for Markov Chain Monte Carlo. Stat. Sci. 7: 493–497.
Reddy, C.C. et al. (1994) Proliferative response of fibroblasts expressing internalization-deficient epidermal growth factor (EGF) receptors is altered via differential EGF depletion effect. Biotechnol. Prog. 10, 377-384.
Rhee SG (2001) Regulation of phosphoinositide-specific phospholipase C. Annu Rev
Biochem 70:281-312.
Roberts, G.O. et al (1994) Weak Convergence and Optimal Scaling of Random Walk Metropolis Algorithms. Technical Report, University of Cambridge.
Robishaw JD & Berlot CH (2004) Translating G protein subunit diversiy into functional specificity. Curr Opin Cell Biol 16:206-209.
Roskoski R Jr (2004) Src protein-tyrosine kinase structure and regulation. Biochem Biophys
Res Commun 324:1155-1164.
Qi M & Elion EA (2005) MAP kinase pathways. J Cell Sci 118:3569-3572.
Schlessinger J (2000) Cell signaling by receptor tyrosine kinases. Cell 103:211-225. Schwartz MA & Madhani HD (2004) Principles of MAP kinase signaling specificity in Saccharomyces cerevisiae. Annu Rev Genet 38:725-748.
Science’s Signal Transduction Knowledge Environment (Stke): Seet BT, Kikic I, Zhou MM & Pawson T (2006) Reading protein modifications with interaction domains. Nature Rev Mol Cell Biol 7:473-483.
Shaw RJ & Cantley IC (2006) Ras, PI(3)K and mTOR signaling controls tumour cell growth.
Nature 44:424-430.
Shaywitz AJ & Greenberg ME (1999) CREB: a stimulus-induced transcription factor activated by a diverse array of extracellular signals. Annu Rev Biochem 68:821-861.
van der Geer, P. et al. (1994) Receptor proteintyrosine kinases and their signal transduction pathways. Annu. Rev. Cell Biol. 10, 251–337.
Wassarman DA, Therrien M & Rubin GM (1995) The ras signaling pathway in Drosophila.
Curr Opin Genet Dev 5:44-50.
Wells, A. (1999) EGF receptor. Int. J. Biochem. Chell Biol. 31, 637-643.
Chapter One Background and Motivation INTRODUCTION
Computational models have been successfully used by mathematicians, chemists and physicists, but are rarely used by biologists. The reason is probably due to the uncertainty of dynamic biological systems interacting with the surrounding environment. Computational models can be very useful tools when they provide experimentally testable predictions. Modeling complex intracellular signal transduction networks presents challenges. Models based on kinetics of chemical reactions most likely contain a large number of parameters, and rate constants for many parameters are unknown because of the difficulty of
experimentally determining the rate constants for individual steps in these networks. [Brown et al. 2004]. It would be even more difficult when the signaling network involves a large number of protein-protein interactions.
Our research objective was to model a signal transduction network using coarse-grained computational modeling methodology. We believe that our research is the first attempt to study the Epidermal Growth Factor (EGF) receptor signal transduction network including all three major signaling pathways [von der Geer, P., 1994, Schlessinger, J., 2000] in the intracellular signal transduction network. The pathways involved are the
receptor (EGFR) is a useful test case for modeling cell signaling networks because EGF is in different cell types, and antibodies and reagents are available for testing [Wiley et al. 2003]. The most intensively studied signaling pathway is the MAPK pathway.
We developed a new mathematical modeling method, a coarse-grained systems biology modeling method, using the Hill function (see glossary) and the Markov Chain Monte Carlo (MCMC) methods (see glossary). We modeled the epidermal growth factor receptor (EGFR) signaling transduction network with no experimental data available for the biochemical reactions. The model is based on the signaling directions and activation or inhibition information in the network. We also used this mathematical modeling method to model EGF-stimulated phosphoinositide transfer protein (PITP) to predict the structure of the signal transduction network at a systems level. The limitation is that some detailed
information is not captured by the model.
Concerning the constraints speed of simulations and the difficulty of experimentally testing the predictions from the model, building a simple model that can explain complex biological processes is our ultimate goal. Our models made perturbations on phosphorylates PI (4,5) P2 to simulate a mutational study and explain the outcome of novel experimental data. Our focus is to investigate protein-protein interactions in the EGFR signal transduction network at the system level.
In this chapter, the intracellular signal transduction network and systems biology are reviewed. Both intracellular signal transduction network and systems biology provide
systems level. Next, the outline of research is highlighted, and finally the major results of this research are summarized.
INTRACELLULAR SIGNAL TRANSDUCTION NETWORK
Cell communication is mediated by extracellular signal molecules through cell signaling pathways or cell signal transduction network. Some signals travel over long distances to cells far away via axons, and some signals are shared by immediate neighbors through gap junctions. Signal molecules can be proteins, small peptides, amino acids, or many other kinds of molecules. Most extracellular signal molecules are hydrophilic and, therefore, are not able to enter the plasma membrane of the target cell. They bind to specific cell-surface receptors in the cell membrane and the activated receptors generate signals inside the target cell [Bradshaw et al. 2003].
Each cell is programmed to respond to specific combinations of extracellular signal molecules. They respond differently at different times and locations. Apoptosis is
programmed cell death that is caused by deprived signals. Different cells respond to different extracellular signal molecules, and different types of cells respond differently to the same extracellular signal molecule. The response to extracellular signals from cells can be transient with duration of seconds to minutes or even hours, or oscillating, or remaining at steady state. How does a cell interpret a specific combination of signals and make the decision to divide, to grow, or to differentiate? Answering this question poses a great challenge in cell biology, signaling modeling, and simulation.
When extracellular signal molecules bind to specific cell-surface receptors in the cell membrane, the receptors activate downstream signals inside the target cell. The intracellular signal molecules relay signals to their effectors in the cell interior, thereby changing the behavior of the cell. Consider epidermal growth factor and its receptor, and three major signaling pathways in the intracellular signal transduction network, namely PI3K pathway, MAPK pathway and PLCr pathway. Each pathway may follow many different branches, depending on cell type and stimuli. Different branches may form different pathways that lead to the same effectors due to cross links between pathways. Signaling and regulatory
Epidermal Growth Factor and Receptor
Epidermal growth factor is present in various cell types and stimulates cell growth, proliferation, survival, or differentiation, and functions as an inductive signal in
development. EGF is an extracellular signaling molecule and is hydrophilic, therefore, it is not able to enter the plasma membrane of the target cell. It binds to EGF receptor and the activated EGF receptor generates signals inside the target cell.
The EGF receptor is an enzyme-coupled membrane receptor and it is activated by binding to EGF or other homologous ligands. The EGFR family consists of four receptors: ErbB1/EGFR/HER1, ErbB2/Neu/HER2, ErbB3/HER3, and ErbB4/HER4. EGFR has an important role in human diseases. An excess of ErbB1 and ErbB2 can cause cancer in humans. EGF receptors also play crucial roles in propagating signals that regulate cell proliferation, differentiation, motility, and apoptosis [Holbro, 2004 ]. EGF receptors are pursued as therapeutic targets. The EGFR system has been used in studies of oncogenesis, mitogen-activated-protein-kinase signaling pathways, and many others [Carpenter et al. 2000]. It will continue to be the source of cell signaling studies involved in development and disease [Wells et al. 1999, Moghal et al. 1999]. The EGFR system has been a useful test case for modeling since it is present in different cell types and high-quality antibodies are widely available [Wiley et al. 2003].
ligand-receptor complexes remained at higher levels longer for the mutant receptors [Albert et al. 2008, ].
PI3-Kinase Pathway
PI3-kinase (PI3K) pathway is involved in cell survival and growth. In this pathway EGF binds to EGF receptor which activates PI3K, in turn PI3K phosphorylates PI (4,5) P2 to produce the plasma membrane lipid second messenger phosphoinositide-3,4,5-trisphosphate PI (3,4,5) P3. Phosphatase and tensin homolog (PTEN) negatively regulates PI (3,4,5) P3 and converts PI (3,4,5) P3 back to PI (4,5)P2. Then PI (3,4,5) P3 swaps its role as an enzyme and activates Akt from inactivated form to activated form Akt. Akt phosphatase dephosphorylates Akt and converts Akt back to inactivated Akt. In the process of phosphorylation and
dephosphorylation of Akt, Akt is neither consumed nor produced. This process is important in cell signaling because cell signaling is all about regulation of enzymatic reaction.
measurements in part because of its importance in this signaling pathway and the
convenience of obtaining readouts [Albert et al. 2008, Downward 2004, Shaw et al. 2006]. MAP-Kinase Pathway
The MAP-kinase (MAPK) pathway is one of the most intensely studied signaling pathways. It was one of the first connections between extracellular cues and changes in gene expression that was mapped in molecular detail, and it turned out to be involved in the control of a bewildering number of cellular processes including fundamental functions such as cell proliferation, survival, motility, and differentiation [Kolch et al. 2005].
plays an important role in cancer research and drug discovery, one of many reasons why this signaling pathway is extensively studied [Albert et al, 2008, Mitin et al. 2005, Bourne 1999].
Erk phosphorylates gene regulatory proteins FOS and JUN in the nucleus. These result in complex changes in gene expression and cell behavior. Erk also phosphorylates and inactivates Raf1 and SOS2, providing negative feedback loops to help shut off the MAP kinase module. Extracellular signals usually activate Erk transiently and the duration of activation influences the response. In a neural precursor cell line, Erk responds to EGF that peaks at 5 minutes and then rapidly declines, but the same cell line responds to NGF (Nerve Growth Factor) with hours of activation that the cells differentiate into neurons.
Phosphorylation of Erk has been shown to be an important event in promoting T cell survival and proliferation [Dong et al. 2002]. Similarly to Akt, Erk was selected for modeling and experimental measurement in part because of its importance and the convenience of obtaining readouts.
Phospholipids Cr Pathway
Phospholipids C (PLCr) pathway is involved in cell migration. In this pathway EGF receptor binding complex activates PLCr which cleaves PI (4,5)P2 to produce diacylglycerol (DAG) and inositol 1,4,5-trisphosphate (IP3), hence this pathway branches into two
Ca2+ is an important ion because it functions as a ubiquitous intracellular mediator. Many extracellular signals can trigger an increase in Ca2+ concentration in the cytosol. It is present in egg cells, muscle cells, and nerve cells. Ca2+ also can act as a signal because its concentration is very low in the cytosol and is high in the lumen of ER and sarcoplasmic reticulum (SR) in the muscle. A large gradient tends to drive Ca2+ from plasma membrane and the ER into the cytosol and may increase Ca2+ concentration 10-20 fold. In order to keep Ca2+ concentration low in the cytosol in resting cells, Ca2+ is actively pumped from the cytosol to the outside of cell or into the ER and mitochondria. Ca2+ responding to
extracellular signals can oscillate in part because of a combination of positive and negative feedback loops by Ca2+ on IP3 receptors. The response also can be transient [Albert et al. 2008, Berridge 2005, Berridge et al. 2003].
SYSTEMS BIOLOGY
System biology is a new field of study that aims to understand interactions of genes, proteins and biochemical reactions at a system level. Components of the biological system are genetic, metabolic and signal transduction pathways. The biological system is very complex due to its dynamics and interaction within an environment of uncertainty. The systems may be cells, organisms, or human beings. A reductionist approach of study of basic components such as pathways is limited in its capacity to translate the effect of perturbations in these pathways to the cell as a whole. It is often said that a biological system in its entirety presents more than a sum of all its parts.
relationship of genes, and interactions of proteins in the signal transduction and metabolism pathways; computer science to model the biological system, and find simulation results consistent with experimental data; analysis of the dynamics of the system to understand how stimuli and external perturbation affect system behavior; and technologies for high
throughput and precision measurements [Kitano, 2000].
Systems biology was pursued by scientific community. In 1933, Walter Cannon proposed a concept of “homeostasis” [Cannon, 1933], a homeostatic system of dynamic equilibria controlled by a regulatory mechanism, and focused at the physiological level. The goal of systems biology is to fundamentally transform the traditional practice of medicine to predictive, preventive, and personalized medicine [Hood et al. 2004]. By examining an individual’s genomic makeup and protein markers, a physician can make predictions about the probability of having a particular disease and current status, and is able to provide guidance for preventive treatments, or customized therapeutic drugs. It is well recognized that many mechanisms involved in complex diseases such as cancer cannot be understood on the basis of molecular parts. For example, Ras is found in 25-30% of cancer cells and has been a cancer drug target for over two decades, but no cure has been found yet, perhaps due to lack of system-level understanding of cellular dynamics.
OUTLINE OF RESEARCH
The goal of the research presented in this dissertation was to develop a mathematical modeling method using the Hill function and the Markov Chain Monte Carlo methods, and use this method to model EGFR signal transduction network and model PITP in EGFR signal transduction network. The research was performed in two stages presented in chapters 4 and 5 following the literature review in Chapter 2 (computational modeling methods) and in Chapter 3 (parameter selection methods):
Modeling Cell Signal Transduction Network Using Hill Function and Markov Chain
Monte Carlo Methods (Chapter 4). The purpose of this study was to develop a mathematical
modeling method using the Hill function and the Markov Chain Monte Carlo methods, and model epidermal growth factor receptor signal transduction network. Experimental data of response from Erk and Akt was used to fitting model.
Modeling PITP Using Hill Function and Markov Chain Monte Carlo Methods
(Chapter 5). The purpose of this study was to model four different PITP structures in EGFR signal transduction network using the Hill function and the Markov Chain Monte Carlo methods, and make predictions on which model is most likely close to experiment. Experimental data of response from Erk and Akt was used to fitting model.
REFERENCES
Alberts, B. et al. (2008) Molecular Biology of THE CELL, Fifth Edition.
Aldridge B.B. (2006) Physicochemical modeling of cell signaling pathways. Nat Cell Biol 8: 1195–1203.
Baker MD, Wolanin PM & Stock JB (2006) Signal transduction in bacterial chemotaxis.
BioEssays 28:9-22.
Ben-Shlomo I, Yu Hsu S, Rauch R et al. (2003) Signaling receptome: a genomic and evolutionary perspective of plasma membrane receptors involved in signal transduction. Sci STKE 187:RE9.
Berridge MJ (2005) Unlocking the secrets of cell signaling. Annu Rev Physiol 67:1-21. Berridge MJ, Bootman MD & Roderick HL (2003) Calcium signaling dynamics, homeostasis and remodeling. Nature Rev Mol Cell Biol 4:517-529.
Bourne HR (1995) GTPases: a family of molecular switches and clocks. Philos Trans R Soc. Lond B Biol Sci 349:283-289.
Bradshaw RA & Dennis EA (eds) (2003) Handbook of Cell Signaling. Elsevier: St. Louis. Brown, K.S. et al. (2004) The statistical mechanics of complex signaling networks: nerve growth factor signaling. Phys. Biol. 184-195.
Burns ME & Baylor DA (2001) Activation, deactivation, and adaptation in vertebrate photoreceptor cells. Annu Rev Neurosci 24:779-805.
Cannon, W.B. (1933) The wisdom of the body.
Carpenter, G. (2000)EGF receptor transactivation mediated by the proteolytic production of EGF-like agonists. Science STRK (15), PE1.
Dard N & Peter M (2006) Scaffold proteins in MAP kinase signaling: more than simple passive activating platforms. BioEssays 28:146-156.
Ferrell JE. Jr. (2002) Self-perpetuating states in signal transduction: positive feedback, double-negative feedback and bistability. Curr Opin Cell Biol 14:140-148.
Hill AV (1910) The possible effects of the aggregation of the molecules of hemoglobin on its dissociation curves. Proc Of The Phys Society.
Holbro, T. and Hynes, N.E. (2004) ErbB receptors: directing key signaling networks throughout life. Annu Rev Pharmacol Toxicol 44: 195–217.
Hood, L. et al. (2004) Systems Biology and New Technologies Enable Predictive and Preventative Medicine.Science Vol. 306. No. 5696, pp. 640 – 643.
Hudmon A & Schulman H (2002) Structure-function of the multifunctional Ca2+ /calmodulin-dependent protein kinase II. Biochem J 364:593-611.
Kitano, H. et al. ( 2000) Fundations of systems biology.
Kolch, W. et al. (2005) When kinases meet mathematics: the systems biology of MAPK signalling. FEBS Letters 579: 1891–1895.
Luttrell LM (2006) Transmembrane signaling by Gprotein-coupled receptors. Methods Mol Bio 332:3-49.
Mitin N, Rossman KL & Der CJ (2005) Signaling interplay in Ras superfamily function.
Curr Biol 15:R563-574.
Moghal, N. and Sternberg, P.W. (1999) Multiple positive and negative regulators of signaling by the EGF-receptor. Curr. Opin. Cell Biol. 11, 190-196.
Mullschleger S, Leowith R & Hall MN (2006) OR signaling in growth and metabolism. Cell
124:471-484.
Papin JA, Hunter T, Palsson BO & Subramaniam S (2005) Reconstruction of cellular signaling networks and analysis of their properties. Nature Rev Mol Cell Biol 6:99-111. Parker PJ (2004) The ubiquitous phosphoinositides. Biochem Soc Trans 32:893-898. Pawson T (2004) Specificity in signal transduction: from phosphotyrosine-SH2 domain interactions to complex cellular systems. Cell 116:191-203.
Pawson T & Scott JD (2005) Protein phosphoryation in signaling – 50 years and counting.
Pierce KL, Premont RT & Lefkowitz RJ (2002) Seven-transmembrane receptors. Nature Rev Mol Cell Biol 3:639-650.
Pires-daSilva A & Sommer RJ (2003) The evolution of signaling pathways in animal development. Nature Rev Genet 4:39-49.
Reddy, C.C. et al. (1994) Proliferative response of fibroblasts expressing internalization-deficient epidermal growth factor (EGF) receptors is altered via differential EGF depletion effect. Biotechnol. Prog. 10, 377-384.
Reiter E & Lefkowitz RJ (2006) GRKs and beta-arrestine roles in receptor silencing, trafficking and signaling. Trends Endocrino Metab 17:159-165.
Rhee SG (2001) Regulation of phosphoinositide-specific phospholipase C. Annu Rev
Biochem 70:281-312.
Robishaw JD & Berlot CH (2004) Translating G protein subunit diversiy into functional specificity. Curr Opin Cell Biol 16:206-209.
Roskoski R Jr (2004) Src protein-tyrosine kinase structure and regulation. Biochem Biophys
Res Commun 324:1155-1164.
Qi M & Elion EA (2005) MAP kinase pathways. J Cell Sci 118:3569-3572.
Sahin M, Greer PL, Lin MZ et al (2005) Eph-dependent tyrosine phosphorylation of ephexin1 modulates growth cone collapse. Neuron 46:191-204.
Schlessinger J (2000) Cell signaling by receptor tyrosine kinases. Cell 103:211-225. Schwartz MA & Madhani HD (2004) Principles of MAP kinase signaling specificity in Saccharomyces cerevisiae. Annu Rev Genet 38:725-748.
Science’s Signal Transduction Knowledge Environment (Stke): Seet BT, Kikic I, Zhou MM & Pawson T (2006) Reading protein modifications with interaction domains. Nature Rev Mol Cell Biol 7:473-483.
Shaw RJ & Cantley IC (2006) Ras, PI(3)K and mTOR signaling controls tumour cell growth.
Nature 44:424-430.
Singla V & Reiter JF (2006) The primary cilium as the cell’s antenna signaling at a sensory organelle. Science 313:629-633.
van der Geer, P. et al. (1994) Receptor proteintyrosine kinases and their signal transduction pathways. Annu. Rev. Cell Biol. 10, 251–337.
Wassarman DA, Therrien M & Rubin GM (1995) The ras signaling pathway in Drosophila.
Curr Opin Genet Dev 5:44-50.
Wells, A. (1999) EGF receptor. Int. J. Biochem. Chell Biol. 31, 637-643.
Chapter Two Computational Modeling Methods INTRODUCTION
Computational models can be very useful tools when they provide experimentally testable predictions. Modeling complex biological networks presents challenges. Models can generate hypothesis, predict and explain outcomes of novel experiments and guide
experimental design. There are different types of modeling that can be theoretically exploration and data driven. Choosing the right tool is very important in modeling. The complexity of the biological problem dictates the scale and detail of the model to be considered. There is a variety of computational modeling methods for understanding signaling networks at the systems level. When modeling cellular signaling networks, a balance needs to be considered between details, ease of simulation and interpretation. The level of details is constrained by availability of experimental data. Models based on kinetics of chemical reactions most likely contain a large number of parameters, and the rate
constants for many parameters are unknown because of the difficulty of experimentally determining individual rate constants [Brown et al. 2004]. It would be even more difficult when the signaling network involves a large number of protein-protein interactions. A network of N proteins it will consist of N protein concentrations, on average about 5N interactions per protein [Grigoriev, 2003], and the reaction-rate parameters for each
When considering the spectrum of computational modeling methods, from less detail to more detail, they may be specified as Boolean modeling method, coarse-grained modeling method, ordinary differential equation modeling method, and statistical mechanics method. Each method has its advantages and limitations. Here we introduce several computational modeling methods with examples, and compare their advantages and limitations. The choice of method or combination of methods for computational modeling depends on the biological questions to be addressed at the forefront and the measurement, definition and function of the networks [Janes et al. 2006]. The detail contained in the model is only that needed to capture
and predict the biological questions. BOOLEAN METHOD
Boolean method is a qualitative approach using Boolean (logic) function to simplify model with discrete time. Input and output are binary (1 or 0) values. A “1” means ON or present or active and “0” signifies OFF or absent or inactive.
One advantage of computational modeling using Boolean method might be to understand the function and behavior of the systems at a much larger scale instead of details of rate constants. With the availability of high-throughput genomic measurements, we may be able to apply reverse engineering to map genetic networks inside cells. Investigation of the generic properties of network models is the utmost interest. Boolean networks have received much attention for several decades in these contexts, such as yeast transcriptional network [Kauffman et al. 2003]. These networks consist of nodes, representing genes and proteins, connected by directed edges, representing gene regulation. Kauffman and others modeled intercellular signaling networks using Boolean method to explore how
communications among cells influence the genetic network dynamics in tissue simulations [Kauffman et al. 2004].
The limitation of Boolean method obviously is that information and accuracy are lost if the details are the biological questions to be addressed. If a phenomenon crucially depends on the continuous nature of the system, Boolean method is not appropriate.
COARSE-GRAINED METHOD
identify the structure of the signaling pathway qualitatively as well as the dynamic behavior of the network quantitatively under many different conditions.
The advantage of the coarse-grained method is that predictions from the modeling often help in refining theory and improving our understanding of a system. MAPK oscillatory model by Kholodenko is an example [Kholodenko, 2000]. This model made predictions about the behavior of the MAPK biochemical pathway and showed that the negative feedback loop in the MAPK cascade allows the system to undergo sustained
oscillations. Some recent examples of oscillations in the MAPK system [Akhthar et al. 2002; Duffield et al. 2002] have shown that some genes encoding components of the MAPK signaling pathway do show the oscillatory peaks. Although results from the examples do not match the model predictions in the details of time-course and amplitude, the model still provides specific and testable predictions as the basis for better understanding of signaling events.
The limitation of coarse-grained modeling is that the predictions from the models are for a range of parameter values instead of precise parameter values. Therefore, a coarse-grained method may not be suitable for detailed modeling if precise quantitative results are expected.
ORDINARY DIFFERENTIAL EQUATION METHOD
data. The focus is on the detailed kinetics of the molecular interactions formalized on the basis of mass action kinetics.
The advantage of ODE modeling method is that the models capture temporal and/or spatial dynamics at the level of individual reactions [Aldridge et al. 2006; Hlavacek et al. 2006; Levchenko et al. 2000; Chakraborty et al. 2003; Wiley et al. 2003]. For example, the ODE method was used to model the ErbB (ErbB receptors are epidermal growth factor receptor family) signaling network with all four ErbB receptors and two ligands, epidermal growth factor (EGF) and heregulin (HRG). The model simulation analysis led to new insights as to how the ErbB signaling network functions in MCF-7 cancer cells [Birtwistle et al. 2007]. There is a strong point of model validation from the ODE modeling when there is an agreement between the model prediction and an experimental data set.
OTHER RELATED METHODS
Another modeling method, Bayesian statistics, is modeling of causal relationships among random variables using conditional probabilities to associate correlations and
influences between network components. The advantage is that the mechanistic information may be incomplete but the interacting biochemical species is informative in the network [Aldridge et al. 2009]. The limitation of Bayesian method is that the model cannot construct cyclical networks.
CONCLUSION
REFERENCES
Akhtar R.A. et al. (2002) Circadian cycling of the mouse liver transcriptome, as revealed by cDNA microarray, is driven by the suprachiasmatic nucleus. Curr Biol 12: 540–550.
Aldridge, BB et al. (2006) Physicochemical modeling of cell signaling pathways. Nat Cell Biol 8: 1195–1203.
Aldridge, BB et al. (2009) Fuzzy Logic Analysis of Kinase Pathway Crosstalk in TNF/EGF/Insulin-Induced Signaling. PLoS Comput Biol 5(4): e1000340.
Birtwistle, MR et al. (2007) Lignad-dependent responses of the ErbB signaling network: experimental and modeling analysis. Mol. Sys. Biol. 3:144.
Blinov, ML et al. (2006) A network model of early events in epidermal growth factor receptor signaling that accounts for combinatorial complexity. Biosystems 83:136–151 Brown, K.S. et al. (2004) The statistical mechanics of complex signaling networks: nerve growth factor signaling. Phys. Biol. 184-195.
Chakraborty, AK et al (2003) In silico models for cellular and molecular immunology: successes, promises and challenges. Nat Immunol 4: 933–936.
de Jong, H. (2002) Modeling and simulation of genetic regulatory systems: a literature review. J Comput Biol 9(1): 67–103.
Duffield, G. E. et al. (2002) Circadian programs of transcriptional activation, signaling, and protein turnover revealed by microarray analysis of mammalian cells. Curr. Biol. 2002, 12, 551 –557.
Goldstein B, et al. (2004) Mathematical and computational models of immune-receptor signalling. Nat Rev Immunol 4:445–456.
Grigoriev, A. (2003) On the number of protein-protein interactions in the yeast proteome.
Nucleic Acids Res. 31:4157-4161.
Ideker, T. and Lauffenburger, DA (2003) Building with a scaffold: emerging strategies for high- to low-level cellular modeling. Trends Biotechnol, 21:255-262.
Kauffman, SA (1969) Metabolic stability and epigenesis in randomly constructed genetic nets. J. Theor. Biol., 22:437-467.
Kauffman, S.A. (2004) Proc. Natl.Acad. Sci. USA 101, 17102–17107. Kholodenko, B.N. (2000) Eur. J. Biochem. 267, 1583 -1588.
Levchenko A, Bruck J, Sternberg PW (2000) Scaffold proteins may biphasically affect the levels of mitogen-activated protein kinase signaling and reduce its threshold properties. Proc
Natl Acad Sci USA 97: 5818–5823.
Resat, H et al. (2003) An Intergrated Model of Epidermal Growth Factor Receptor Trafficking and Signal Transduction. Biophysical Journal Vol. 85 730-743.
Vayttaden, S.J. et al. (2004) A spectrum of models of signaling pathways. ChemBioChem, 5:1365-1374.
Chapter Three Parameter Selection Methods INTRODUCTION
In cell signaling modeling, there are relatively limited data of stoichiometry and kinetics of the biochemical reactions about species in the signaling network available.
Analysis of dynamic properties is limited to a few well characterized pathways. The classical method is to gather rate constants from experimental data. There are several concerns when gathering information in this fashion. First, it is difficult to measure the rate constants for a large network which has a large parameter set. Secondly, these data are collected from different laboratories, and, therefore, they may not be consistent. When the parameter information is not available, as the case is with our model, we must generate parameter values for our model data fitting. There are several methods for parameter selection in mathematical modeling. Two parameter selection methods are Least Squares Method, and Markov Chain Monte Carlo methods.
LEAST SQUARES METHOD
The least squares method minimizes the sum of squared differences between the values of dependent variable and model predicted value. This method was first described by
Squares method is far superior to a random selection of centers in the radial basis function network.
MARKOV CHAIN MONTE CARLO METHODS
Markov Chain Monte Carlo (MCMC) methods simulate direct draws from some
complex, nonstandard multivariate distributions of interest [Chib et al. 1995].
Markov Chain is a sequence of random variables generated by the Markov process
which is defined by its transition probabilities. These transition probabilities between
different values in the sample space depend only on the random variable’s current state. Thus the only information about the past that predicts the future is the current state of the random variable. Knowledge of the earlier state of the random variable does not change the transition probability.
For example [Walsh 2004], assume the state space is rainy, sunny, and cloudy. Then weather follows a Markov process. The probability of tomorrow’s weather depends only on today’s weather and not the weather on any previous days. The observation that it has rained for three days does not alter the probability that tomorrow’s weather will be sunny. Suppose the transition probability given that today is rainy:
P (rain tomorrow | rain today) = 0.5, read as the probability of rain tomorrow is 0.5 given that today it is rainy.
P (sunny tomorrow | rain today) = 0.25, read as the probability of that tomorrow will be sunny is 0.25 given that today it is rainy.
Monte Carlo sampling uses Bayesian inference that is based on random sampling. It was introduced by Metropolis [Metropolis et al. 1953] at Los Alamos National Laboratory. Some systems cannot be computed exactly, and, therefore they are predicted on the basis of approximation. Examples are the van der Vaals equations for dense gases, and Boltzmann equations for dilute gases, among many others.
Figure 1. Measuring the depth of the Nile: a comparison of conventional quadrature (left), with the Metropolis scheme (right) [Daan Frenkel, 2004].
a predetermined set of points is measured, understanding that some points maybe located outside of the water. The right side of the figure, illustrates measuring the depth by Metropolis sampling. This method involves the construction of an importance-weighted random walk. In this random walk, a trial is rejected if the measurement is not in the water and it is accepted if the measurement is in the water. The average of all these measurements yields an estimate of the average depth of the Nile [Daan Frenkel, 2004].
The Metropolis-Hastings Algorithm
The Metropolis-Hastings algorithm was introduced by Metropolis and extended by Hastings. Hastings (Hastings, 1970) generalized the Metropolis algorithm by using an
arbitrary transition probability function and setting the acceptance probability for a candidate point [Walsh, 2004]. Physicists attempted to compute complex integrals by expressing them as expectations for some distribution and estimating the expectation by drawing samples from that distribution.
The transition probability is a conditional distribution function that represents the probability of moving from the current point to a future point for the same parameter.
The Metropolis-Hastings algorithm has the following steps [Walsh, 2004]: 1. Start with any initial value x0 satisfying f (x0) > 0.
2. Use current value x0, sample a random number z from some distribution (uniform, normal), and a standard deviation α for fine tuning, the candidate distribution y = x0 + α*z. 3. Calculate the ratio of the density of candidate y and current x0 points.
Markov chain theory suggests that such a chain will eventually converge to a stationaryor equilibriumdistribution which is the target or posterior distribution. If we sample long enough, we will eventually be sampling from the posterior distribution itself after we discard some sets of samples from burn-in period. The burn-in period is the number of runs before the chain approaches stationarity or equilibrium. Determining the number of runs is a key issue in the successful implementation of Metropolis-Hastings or other MCMC methods. Typically the first 1000 to 5000 elements are thrown out, some applications may have more elements to be thrown out. The various convergence tests are used to assess whether stationary or equilibrium has been reached. The choice of starting values can greatly increase or decrease the required burn-in time. One suggestion is to start the chain as close to the center of the distribution as possible such as using an approximate Maximum Likelihood Estimator as the starting value [Walsh, B. 2004].
Choosing a proposed distribution is another issue in the implementation of the Metropolis-Hastings algorithm. There are two general approaches: random walk and independent chain sampling. The proposed distribution based on a random walk chain
requires that the new value y equals the current value x plus a random variable z, a standard deviation α for fine tuning.
y = x + α*z
The proposal distribution based on independent chain assumes that candidate y is drawn from a distribution of interest and that it is independent of the current value. This proposal distribution is generally not symmetric.
Convergence Diagnostics
Time series trace plot is one type of the tests for convergence. The plot is the number of iterations versus the number of sets of random variables being selected. The trace plot can show the evidence of well mixing or poor mixing [Walsh, 2004]. In a well mixing chain, the chain explores the parameter space and the time series looks like well spaced and has no long flat space (figure 2). In a poor mixing chain, it seems the chain stays in small regions of the parameter space for a long period of time or trapped and there are long flat periods in the time series corresponding to the random variables being rejected.
Figure 2. The MCMC chain of 9000 draws from the posterior distribution [Wetzels et al. 2009].
the acceptance rate is approximately 45% in one dimensional problems and approximately 23% as the number of dimensions approaches infinity, with the optimal acceptance rate being around 25% for as few as six dimensions. In statistics, the number of parameters is often referred to as the dimension [Bretscher 2005].
CONCLUSION
Markov Chain Monte Carlo methods are useful methods for parameter selection, and Metropolis-Hastings algorithm is a powerful Markov Chain method to simulate multivariate distributions. Since there is limited amount of information of biochemical reactions available for modeling cell signaling, MCMC increasingly will be used as a parameter selection method.
REFERENCES
Bretscher, Otto (2005). Linear Algebra with Applications, 3rd ed. Upper Saddle River NJ: Prentice Hall.
Chen, S., Cowen, C.F.N, and Grant, P.M. (1991). IEEE TRANSACTIONS ON NEURAL
NETWORKS, Vol. 2, No. 2.
Chib, S. and Greenberg, E. (1995) Understanding the Metropolis-Hastings Algorithm. The American Statistician, Vol. 49, No. 4, 327-335.
Frenkel, D. (2004) Introduction to Monte Carlo Methods. NIC Series, Vol. 23, 29-60. Gelman, A., and D. B. Rubin. (1992). Inferences from iterative simulation using multiple sequences (with discussion). Statistical Science 7: 457 - 511.
Geyer, C. J. 1992. Practical Markov chain Monte Carlo (with discussion). Stat. Sci.
7: 473–511.
Hastings, W.K. (1970) Monte Carlo sampling methods using Markov Chains and their applications. Biometrika 57:97-109.
Metropolis, N. et al (1953) Equations of state calculations by fast computing machines. J. of
Chemical Physics 21:1087-1091.
Raftery, A. E., and S. Lewis. 1992b. Comment: One long run with diagnostics: Implementation strategies for Markov Chain Monte Carlo. Stat. Sci. 7: 493–497. Roberts, G.O. et al (1994) Weak Convergence and Optimal Scaling of Random Walk Metropolis Algorithms. Technical Report, University of Cambridge.
Walsh, B. (2004) Markov Chain Monte Carlo and Gibbs Sampling. Lecture Notes for EEB 581.
Chapter Four Modeling Cell Signal Transduction Network Using Hill Function and Markov Chain Monte Carlo Methods
INTRODUCTION
In this study, we developed a new mathematical modeling method to understand the dynamic behavior of Epidermal Growth Factor (EGF) Receptor signal transduction network at the system level. We constructed the network as a signaling regulatory network where there is a lack of biochemical reactions information but the direction of signaling information is known. The readouts of Erk and Akt from experiments are used to fit the model to the experimental data. We used the Hill function to formulate ordinary differential equations (ODE), and the Markov Chain Monte Carlo method for parameter selection. Given the difficulty of experimentally testing the predictions that some proteins may not be
experimentally measurable at current technology, and the constraints speed of simulation that combinatorial models may not be feasible to simulate, building a simple model that can explain complex biological processes is an ultimate goal.
Modeling EGFR Signal Transduction Network
difficult where a large number of protein-protein interactions are present in a signaling network. The most intensively studied signaling pathway is the Mitogen Activated Protein Kinase (MAPK) pathway.
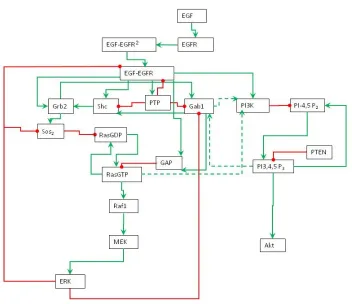
Figure 1: Schematic representation of EGFR signaling transduction network. Green line is activation, red line is inhibition, and dashed line is cross pathways.
to zero for some species and set to non-zero values for other species. The non-zero initial values are approximated by educated guess (Table 1). The model diagram (Figure 1) describes the regulatory functions and interactions among the species in the signaling network.
Table 1: Protein initial values
Species Initial values
1 EGF 0.5
2 EGFR 0.7
3 RasGDP 0.9
4 PTEN 0.5
5 PIP2 0.1
In EGFR signaling transduction network, EGF is signaling molecule (ligand) and EGFR is plasma membrane receptor. When EGF binds to EGFR, the EGFR is activated and in turn it activates the intracellular signaling pathways. Two activated EGFR form an EGFR dimer. Once a receptor dimer is formed, it gains tyrosine kinase activity and can auto-phosphorylate on several tyrosine residues. The homodimer undergoes rapid EGF-induced internalization and degradation through a multistep process.
and Raf1 activates Mek (MapKK), in turn Mek activates Erk (MAPK). RasGTP also phosphorylates PI3K in the PI3K pathway. Erk has negative feedback loop to inhibit Sos2 and EGFR. Since Ras is an oncogene, the MAPK pathway is an important research subject in cancer research.
RESULTS AND DISCUSSION Model Formulation
In this study, we modeled EGFR signaling network as a regulatory model when biochemical kinetics are not available. The model can provide insight on network signaling qualitatively. There are 20 species, 68 parameters and 30 biochemical reactions in the model. Hill function was used to formulate ODE equations with time scaling coefficient and a decay term.
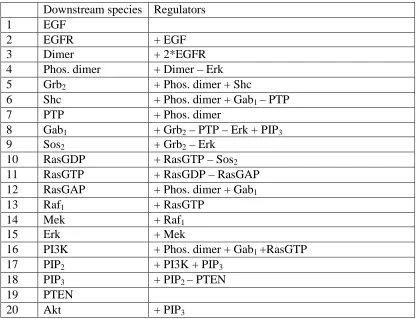
Table 2: Circuits of the EGFR signaling network, plus sign indicates activation received, minus sign indicates inhibition received. EGF and PTEN receive neither activation nor inhibition from other species, they are treated as constants.
Downstream species Regulators
1 EGF
2 EGFR + EGF
3 Dimer + 2*EGFR
4 Phos. dimer + Dimer – Erk
5 Grb2 + Phos. dimer + Shc
6 Shc + Phos. dimer + Gab1 – PTP
7 PTP + Phos. dimer
8 Gab1 + Grb2 – PTP – Erk + PIP3
9 Sos2 + Grb2 – Erk
10 RasGDP + RasGTP – Sos2
11 RasGTP + RasGDP – RasGAP
12 RasGAP + Phos. dimer + Gab1
13 Raf1 + RasGTP
14 Mek + Raf1
15 Erk + Mek
16 PI3K + Phos. dimer + Gab1 +RasGTP
17 PIP2 + PI3K + PIP3
18 PIP3 + PIP2 – PTEN
19 PTEN
20 Akt + PIP3
Model Equations
example, in equation 2 the negative EGFR term is a decay term and accounts for dissociation, degradation, and internalization.
EGF: dy(1) = 0.
EGFR: dy(2) = r2*(((α*Wactivation) n2)/(1+ (α*Wactivation ) n2 ) – EGFR). Dimer: dy(3) = r3*(((α * Wactivation ) n3)/(1 + (α * Wactivation ) n3 ) – dimer).
Phos.dimer: dy(4)=r4*(((α*Wactivation ) n4)/(1+ (α*Wactivation ) n4 +(α*Winhibition ) n4) – Pd). Grb: dy(5) = r5*(((α * Wactivation ) n5)/ (1 + (α*Wactivation ) n5) – Grb).
Shc: dy(6) = r6*(((α *Wactivation ) n6)/ (1+( α*Wactivation ) n6 +( α *Winhibition ) n6) – Shc). PTP: dy(7) = r7*(((α * Wactivation ) n7) / (1 + (α*Wactivation ) n7) – PTP).
Gab: dy(8) = r8*(((α*Wactivation ) n8)/(1 + (α*Wactivation ) n8 + (α*Winhibition ) n8) – Gab). Sos: dy(9) = r9*(((α *Wactivation ) n9)/(1+( α *Wactivation ) n9 + (α *Winhibition ) n9) – Sos). RasGDP: dy(10)=r10*(((α*Wactivation ) n10)/(1+( α*Wactivation) n10+(α*Winhibition ) n10) –GDP). RasGTP: dy(11) = r11(*((α*Wactivation ) n11)/(1+(α*Wactivation ) n11+(α*Winhibitionn ) n11) – GTP). RasGAP: dy(12) = r12*(((α* Wactivation ) n12) / (1 + (α* Wactivation ) n12) – GAP).
Raf: dy(13) = r13*((( α* Wactivation ) n13) / (1 + (α* Wactivation ) n13) – Raf). Mek: dy(14) = r14*(((α* Wactivation ) n14) / (1 + (α* Wactivation ) n14) – Mek). Erk: dy(15) = r15*(((α * Wactivation ) n15) / (1 + (α*Wactivation ) n15) – Erk). PI3K: dy(16) = r16*(((α * Wactivation ) n16 ) / (1 + (α*Wactivation ) n16) – PI3K).
PIP2: dy(17)=r17*(((α*Wactivation ) n17)/(1+(α*Wactivation ) n17+(α*Winhibitionn ) n17) – PIP2). PIP3: dy(18)=r18*(((α*Wactivation ) n18)/(1+(α*Wactivation ) n18+(α*Winhibitionn ) n18) – PIP3).
PTEN: dy(19) = 0.
Model Fitting
As in many cell signaling models, there are limited data pertaining to biochemical reactions. That is the case for our model. Consequently, we used the Markov Chain Monte Carlo method to select parameter values, as described in the Methods section (Markov Chain Monte Carlo Method). We used data points from experimental data to fit Erk and Akt response in the model. After bringing the model response to the target region, 10,000 runs were simulated. Among the 10,000 sets, around 25% of sets met the criteria of experimental data points and were selected. The final result is an average of these selected parameter values.
Figure 2 shows the average EGF-stimulated response for all the parameter sets. The star is data points from experiment (from Beak). The top plot is response from Erk and the bottom plot is from Akt. The stars are data points from experiment, the plot is from
Figure 2: EGF-stimulated response averaged from selected parameter sets. Stars are data points from experiment. Stars are data points from experiment.
Perturbation on Erk and Akt Activation
In dose response to EGF, Erk activation is robust at high ligand dose and Akt activation is not. For Erk, set EGF to 0.9, 0.5 and 0.01, Erk activation does not show great impact in response to EGF perturbation. For Akt, using the same dose, Akt activation shows significant change in response to EGF perturbation. This difference in response to
Statistical Data Analysis of Parameter Convergence
To see if the posterior or target distribution has converged, the posterior distribution density and time series trace plots are analyzed by convergence tests. Figure 3 shows that the posterior distribution has converged. The Y-axis is the number of values from different parameter sets, and the X-axis is the weight. Notice that some parameters converged well and others have long tails. These parameter convergence data may provide insights to the
signaling network as discussed below. The posterior distribution is not symmetric because negative concentration has no meaning in cell signaling.
![Figure 1. Measuring the depth of the Nile: a comparison of conventional quadrature (left), with the Metropolis scheme (right) [Daan Frenkel, 2004]](https://thumb-us.123doks.com/thumbv2/123dok_us/1294779.1162038/47.612.160.534.227.518/figure-measuring-comparison-conventional-quadrature-metropolis-scheme-frenkel.webp)