Electronic Thesis and Dissertation Repository
7-23-2013 12:00 AM
Measuring vocal performance in song sparrows (Melospiza
Measuring vocal performance in song sparrows (Melospiza
melodia), and its relationship to age, morphology and song
melodia), and its relationship to age, morphology and song
complexity.
complexity.
Steven D. Moore
The University of Western Ontario Supervisor
Dr. Elizabeth MacDougall-Shackleton The University of Western Ontario Graduate Program in Biology
A thesis submitted in partial fulfillment of the requirements for the degree in Master of Science © Steven D. Moore 2013
Follow this and additional works at: https://ir.lib.uwo.ca/etd
Part of the Behavior and Ethology Commons, and the Biology Commons
Recommended Citation Recommended Citation
Moore, Steven D., "Measuring vocal performance in song sparrows (Melospiza melodia), and its relationship to age, morphology and song complexity." (2013). Electronic Thesis and Dissertation Repository. 1357.
https://ir.lib.uwo.ca/etd/1357
This Dissertation/Thesis is brought to you for free and open access by Scholarship@Western. It has been accepted for inclusion in Electronic Thesis and Dissertation Repository by an authorized administrator of
COMPLEXITY.
(Thesis format: Monograph)
by
S. Drew Moore
Graduate Program in Biology
A thesis submitted in partial fulfillment of the requirements for the degree of
Master of Science
The School of Graduate and Postdoctoral Studies The University of Western Ontario
London, Ontario, Canada
ii
Abstract
Vocal performance in birds, measured as the ability to rapidly produce broadband trills, has
been proposed to reflect male quality. However, little is known about whether performance is
consistent across a male’s song repertoire, or whether better performers also have larger
repertoires. I quantified vocal performance in 21 male song sparrows (Melospiza melodia).
Performance varied among and within males, but was significantly repeatable when
considering multiple exemplars of the same trill type within an individual’s repertoire. This
suggests that within-individual variation in performance reflects trill types varying in
complexity and performance difficulty. Performance was positively and significantly
correlated to song repertoire size, but not with male age, bill or body size. While repeatability
of performance between multiple exemplars of the same trill suggests vocal performance
could potentially be a reliable signal in birds with multi-song repertoires, performance
appears to overlap with song repertoire size in the information conveyed.
Keywords:
vocal performance, vocal deviation, birdsong, song sparrow, Melospizaiii
Co-Authorship Statement
My supervisor Dr. Beth MacDougall-Shackleton will be given co-authorship on any
iv
Acknowledgments
I would first like to thank my supervisor Dr. Beth MacDougall-Shackleton for her
continued support and guidance throughout this project. Her kindness, and willingness to put
up with my constant requests to ‘chat’ were, and continue to be, greatly appreciated. I must
also thank her for the many laughs shared both in the field and lab. Needless to say I will
always remember what a house finch looks like!
I must also thank my advisory committee members Dr. Liana Zanette and Dr. Graeme
Taylor, whose helpful comments and criticisms greatly improved my project. I am also very
thankful for the logistical help provided by the Queen’s University Biological Station during
fieldwork.
A special thank-you to Keelin Stanbury and Natalie Westwood for their work in the
field. Thank-you to my labmates, Yani Sarquis-Adamson, Tosha Kelly and Heather
MacGillivray for your support and willingness to put up with my stream of bad jokes. Kim
Schmidt, Chandra Rodgers and Scott Colborne deserve special thanks. Kim taught me an
incredible amount in the field, and showed me how to have fun while doing it. Chandra
provided much needed laughter and helpful edits. Scott was always there with an open ear
and often a pint to listen to many thesis and non-thesis related woes. All three were amazing
friends throughout the entire process. As always thanks to Sean Munoz, Gaelen Murray, Erin
Murray, Emily Skrastins and Erica Thompson. You guys are the best. Finally, I would like to
thank my parents and family for their love and support. I certainly would not be here without
v
Table of Contents
Abstract ... ii
Co-Authorship Statement ... iii
Acknowledgments ... iv
Table of Contents ... v
List of Tables ... vii
List of Figures ... viii
List of Appendices ... ix
1 Introduction ... 1
1.1 Animal Communication ... 1
1.2 Performance as an Honest Signal ... 3
1.2.1 Maximal versus Typical Performance ... 4
1.3 Complex Signals ... 5
1.3.1 Birdsong as a Complex Signal ... 6
1.3.2 Song Complexity ... 7
1.3.3 Vocal Performance ... 8
1.4 Objectives and Hypotheses ... 16
2 Materials and Methods ... 19
2.1 General Field Methods ... 19
2.2 Recording Methods ... 22
2.3 Song Analysis Methods ... 23
2.3.1 Song Repertoire Size ... 23
2.3.2 Vocal Performance and Vocal Deviation ... 24
2.4 Repeatability of Vocal Performance ... 26
2.5 Simple versus Complex Trills ... 28
vi
3 Results ... 31
3.1 Repeatability of Vocal Performance ... 31
3.2 Average versus Maximum Vocal Performance ... 32
3.3 Complex versus Simple Trill Performance ... 33
3.4 Vocal Performance as a Function of Age, Bill Size and Body Size ... 33
3.5 Vocal Performance and Song Complexity ... 34
4 Discussion ... 43
4.1 Repeatability of Performance ... 44
4.2 Average versus Maximum Performance ... 46
4.3 Complex versus Simple Trill Performance ... 46
4.4 Vocal Performance as a Function of Age, Bill Size and Body Size ... 47
4.5 Vocal Performance and Song Complexity ... 50
4.6 Conclusions ... 53
References ... 55
Appendix ... 63
vii
List of Tables
Table 1 – Repeatability of vocal performance across all trill types performed by each male. N=21 male song sparrows each with 5-9 trill types measured. ... 35
Table 2 – Repeatability of vocal performance across all simple trill types performed by each male. N=21 male song sparrows each with 1-6 simple trill types measured. ... 36
Table 3 – Repeatability of vocal performance across ten exemplars of one randomly chosen simple trill type, from each of 21 male song sparrows. ... 37
Table 4 – Repeatability of vocal performance across ten exemplars of one randomly chosen complex trill type, from each of 21 male song sparrows. ... 38
Table 5 – Summary of nested ANOVA with maximum vocal performance (measured as minimum vocal deviation) of 21 male song sparrows as the dependent variable. ... 39
viii
List of Figures
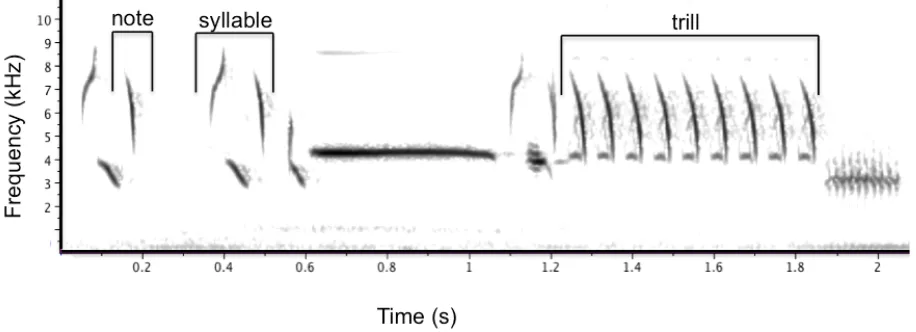
Figure 1 – An annotated spectrogram of an exemplar song sparrow song ... 10
Figure 2 – Theoretical diagram of the distribution of songs in acoustic space ... 12
Figure 3 – Examples of two hypothetical trills with identical frequency bandwidth and trill rate, but which differ in performance difficulty ... 15
Figure 4 – A schematic diagram illustrating the three bill measures (length, width and depth) taken of both the upper and lower bill of all males. ... 21
Figure 5 – Spectrograms of song sparrow song illustrating an example of a simple trill (A) and a complex trill (B). ... 29
Figure 6 – Maximum frequency bandwidth versus trill rate for (A) complex and simple trill types combined, and (B) only simple trill types. ... 40
Figure 7 – Relationship between song repertoire size and minimum vocal deviation in 20 male song sparrows ... 42
ix
List of Appendices
1
Introduction
1.1
Animal Communication
Animals have evolved a wide diversity of ways to communicate information from
signaler to receiver. Communication involves the transfer of information by a signal,
defined as any display or change in behaviour by a signaler that results in a response from
another individual (the receiver), and subsequent improvement of the signaler’s fitness
(Smith and Harper 1995). Signals are generally selected to be as detectable,
discriminable, and memorable as possible to receivers and may involve visual, tactile,
olfactory and/or acoustic components (Guilford and Dawkins 1991). Communication,
and thus signaling, occurs in a wide variety of contexts including offspring begging to
solicit parental care as in American robins (Turdus migratorius; Smith and Montgomerie
1991), male sand fiddler crabs (Uca pugilator) waving their claws to deter rivals (Pope
2000), aposematic displays by poison frogs (family Dendrobatidae) to deter predators
(Summers and Clough 2001), and the chemical signaling of queens used in kin
recognition of honey bees (Apis mellifera capensis; Moritz and Crewe 1988). This
diversity of contexts and modalities therefore provides multiple opportunities for
selection to act.
Sexually selected signals are arguably the best-studied examples of animal
communication, due to widespread interest in how animals choose and compete for
mates. They are also incredibly diverse in form and content (e.g. structural displays such
as the tails of male red-collared widowbirds (Euplectes ardens; Pryke and Andersson
Hill 1991), and the courtship pheromones used by male arctiid moths (Utetheisa ornatrix;
Kelly et al. 2012)). Signals may be favoured through intrasexual selection, as when an
individual (usually male) signals to communicate its fighting ability, condition, and/or
aggressive intent to same-sex rivals (Gil and Gahr 2002, Searcy and Nowicki 2005,
Catchpole and Slater 2008). For example, in many species of northern swordtail fish
(genus Xiphophorus), males produce a dynamic display of vertical bars of pigment,
which is known to communicate aggression and willingness to fight (Moretz and Morris
2006). Alternatively, signals may be favoured by intersexual selection, that is, in the
context of mate choice. Because the sex that invests more in parental effort (usually
females) is a limiting resource for the investing sex (usually males), the
lower-investing sex frequently evolves ornaments or displays to attract the higher-lower-investing sex
(Trivers 1972, Hurd and Enquist 2005, Searcy and Nowicki 2005). For example, male
túngara frogs (Physalaemus pustulosus) use a whine-chuck call to attract females (Baugh
and Ryan 2010). Finally, some signals are used in both intra- and inter-sexual contexts. In
many songbird species (suborder Passeri), for example, male song functions in both a
territorial and mate attraction capacity (Catchpole and Slater 2008). Regardless of the
context in which a signal is favoured, it must ultimately provide useful information to the
receiver in order to be maintained.
Signal theory predicts that receivers should only attend to signals that are honest
(Searcy and Nowicki 2005). In the context of sexual selection, an honest signal is one
that reliably indicates some aspect of the signaler’s quality or environment such that a
prospective mate or a potential rival is able to extract usable information from it
the context of sexual selection, as selection on signalers is expected to favour signal
exaggeration. That is, males that ‘cheat’ by exaggerating their quality to potential mates
and/or rivals should achieve a fitness advantage (Smith and Harper 1995). For example,
male fiddler crabs (Uca annulipes) that have lost their big claw appear to successfully
“bluff” potential rivals and attract mates by regenerating large but energetically cheap
and structurally weak replacement claws (Backwell et al. 2000). Therefore in order for
signals to be reliable and consistent indicators of quality, some mechanism must exist by
which they remain honest.
One resolution to the problem of signal honesty is provided by the handicap
principle, which posits that in order to be honest, signaling must be costly to the signaler
(Zahavi 1975). Displaying a sexually selected signal associated with a reduction in
survival (the handicap) can be viewed as having passed a type of test, because only
high-quality individuals can incur the costs and still survive (Zahavi 1975). Refinements of
this idea suggest that costly signals may be condition-dependent rather than all-or-none,
such that the degree to which a costly trait is expressed depends on (and thus reveals) the
quality or current condition of the signaler (Iwasa et al. 1991). For example, in male field
crickets (Gryllus campestris) increasing food availability results in improved body
condition, and an associated increase in call frequency (Holzer et al. 2003). An increase
in food availability provides sufficient energy to overcome the cost of frequent calling,
and it is this cost by which the honesty of the signal is maintained.
1.2
Performance as an Honest Signal
Recent attention has focused on motor performance as an honest signal, which
extended period of time) and skill (the ability to perform fine motor tasks well; Byers et
al. 2010). In male bobolinks (Dolichonyx oryzivoru), for example, extended flying bouts
require considerable vigour and the length of such bouts predicts both male condition and
subsequent fledging success (Mather and Robertson 1992). Skill may also be salient to
many sexually selected displays as the motor actions required to produce or perform the
displays are often more intricate than those required for other daily tasks. Sexually
selected displays requiring vigour and/or skill may also approach an upper limit of
performance constrained by physiology, anatomy or developmental stability due to the
need to coordinate multiple systems (e.g. musculoskeletal and nervous systems). For
these reasons, signals displaying motor performance ability have been proposed as
excellent candidates for honest signals, because motor performance cannot be faked
(Byers et al. 2010).
1.2.1
Maximal versus Typical Performance
Despite the difficulty in faking motor performance, variation may still exist at a
within-individual level as many displays are not performed at a maximal level at all
times. Therefore motor performance can be measured as either typical performance (e.g.
the average of multiple observations), or maximal performance (e.g. the best of multiple
observations). Podos et al. (2009) suggest that maximal performance merits special
investigation as for many traits individuals will only perform at maximal levels in
specific contexts, such as the need to avoid a predator. Much research on maximal
performance has focused on locomotion in lizards (Irschick and Garland 2001). For
example, in an observational study of the lizard Anolis lineatopus, individuals typically
maximum speed during feeding, and at 90% of maximum speed during predator evasion
(Irschick 2003). This demonstrates that animals may not approach maximal performance
levels frequently. Moreover, individual lizards overlapped considerably in typical
performance (e.g. similar undisturbed walking speeds), with variation between
individuals only being exposed at maximal levels (Irschick and Garland 2001, Irschick et
al. 2008). Although maximal performance may be expressed only occasionally, it is more
likely than typical performance to reflect variation in physiology and morphology, and to
be the direct target of selection (Irschick et al. 2008). In other words, non-maximal
(typical) performance may be only weakly related to quality, because considerable
variation in performance may occur within individuals. Maximum performance may thus
be particularly important to assess in signals for which performance varies substantially
at the within-individual level. Specifically, where repeatability of performance (defined
as the proportion of variance in a trait or signal that occurs among rather than within
individuals; Lessells and Boag 1987) is low, receivers may attend primarily to maximal
performance to assess among-individual variation in quality.
1.3
Complex Signals
While performance may provide receivers information through displays of vigour
or skill, signals may also encompass more than one sensory modality, or otherwise have
multiple features to which receivers can attend. For example, nestling common magpies
(Pica pica) signal nutritional need through postural changes combined with vocalizations
(Redondo and Castro 1992), and male satin bowerbirds (Ptilonorhynchus violaceus)
combine vocal mimicry and postural displays to attract females (Doucet and
situations (Møller and Pomiankowski 1993, Johnstone 1996). First, the various
components may encode similar (redundant) information about the signaler, potentially
enhancing the receiver’s overall ability to assess quality or condition. This is referred to
as the ‘backup signal’ hypothesis (Johnstone 1996). Alternatively, each signal component
may encode distinct information concerning the signaler’s condition. This is referred to
as the ‘multiple messages’ hypothesis (Johnstone 1996). Different signal components
may also overlap partially but not completely in the information they convey
(MacDougall-Shackleton et al. 2009a). In each case, however, each component
communicates some aspect of the signalers quality or condition to the receiver.
1.3.1
Birdsong as a Complex Signal
The learned song of oscine songbirds comprises several components to which
receivers of both sexes may attend. These include song output (e.g. the number of songs
produced per unit time), local song structure (e.g. the degree to which songs are shared
with other members of the population), song complexity (e.g. the number of distinct song
types in an individual’s repertoire), and vocal performance (the ability to produce
physically challenging song; Searcy and Nowicki 2005). The relative importance of these
components and the degree to which each is implicated in intra- and/or inter-sexual
selection, is expected to vary between species (Gil and Gahr 2002). For example, in song
sparrows (Melospiza melodia), females choose mates based in part on song complexity
(Reid et al. 2004), whereas in northern mockingbirds (Mimus polyglottis) song
complexity is implicated primarily in male-male competition for territories (Howard
1974), while in swamp sparrows (Melospiza georgiana) song complexity is very low and
Therefore while song complexity may be of more importance in some species, it is still
but one of multiple aspects of song that may be attended to by receivers.
1.3.2
Song Complexity
Of the components of birdsong reviewed above, song complexity has received the
most study (Searcy and Nowicki 2005). Many species of songbird are age-limited
learners, such that vocal learning is restricted to a sensitive period during the first few
months of life (Marler and Peters 1987). In age-limited learners, including song sparrows,
song complexity remains fixed throughout adulthood (Nordby et al. 2002). Female
preference for large repertoires has been shown in many species including song sparrows
(Searcy 1984, Reid et al. 2004), European starlings (Sturnus vulgaris; Mountjoy and
Lemon 1996), and great tits (Parus major; Baker et al. 1986); although see Byers and
Kroodsma (2009). This widespread preference by female songbirds for males with large
song repertoires, suggests that by attending to song complexity females gain information
regarding the quality of the singer. Indeed, in European starlings male song complexity is
positively correlated with age and body condition (Mountjoy and Lemon 1996).
Similarly, in an island population of song sparrows male song complexity is positively
related to paternal care (Reid et al. 2005a) as well as individual genetic diversity and
cell-mediated immune function (Reid et al. 2005b). This suggests females may obtain both
direct and indirect benefits from choosing males with large song repertoires.
Whereas it is easy to envision how singing at high rates of output is likely to be
more costly than singing at lower rates (e.g. more energetically demanding and less
foraging time), the costs associated with song learning (e.g. why learning a repertoire of
apparent. The developmental stress hypothesis (Nowicki et al. 1998, 2002) posits that the
honesty of song complexity is maintained by the costs of developing neural structures
associated with song learning during early life. Supporting this, in a recent study of song
sparrows, song repertoire size, syllable repertoire size and song learning accuracy were
all affected by experimentally-induced early-life stress in the form of food restriction and
corticosterone treatment (Schmidt et al. 2013b). Similarly, experimental studies of both
European starlings and zebra finches (Taeniopygia guttata) have found that early-life
stress in the form of food restriction results in reduced adult song complexity (Buchanan
et al. 2003, Spencer et al. 2003). Thus by attending to song complexity, females may gain
information about the degree to which the singer avoided or withstood early-life stressors
such as disease, parasitism or food limitation (Nowicki et al. 1998, 2002). Such
information may in turn confer direct (material) and/or indirect (genetic) benefits to the
mates of complex singers.
1.3.3
Vocal Performance
A more recently examined component of song to which receivers may attend is
vocal performance (Podos 1997, Searcy and Nowicki 2005, Catchpole and Slater 2008).
Because motor performance in general has been identified as an honest (un-fakeable)
signal (Byers et al. 2010), it follows that due to the complex mechanism required to
produce songs, individual singers will likely vary in their ability to perform physically
challenging aspects of song. Many different measures have been used to quantify vocal
performance, including song amplitude (Forstmeier et al. 2002), use of ‘special’ syllables
characterized by rapid frequency modulation (Vallet and Kreutzer 1995), rate of syllable
intervals (Leadbeater et al. 2005, Holveck and Riebel 2007, Cardoso et al. 2007, 2009),
and ‘predicted amplitude’ or the amplitude of particularly challenging song types
(Cardoso et al. 2007, 2009). Therefore while each (of the above) methods differ in the
characteristic of song measured, they all consider the ability of a bird to perform
physically challenging aspects of song. Research on vocal performance of birds has
proven fruitful because of the complex nature of this behavior and its many physically
challenging components.
The most frequently used measure of vocal performance, however, is ‘vocal
deviation’ (Podos 2001). This approach examines the trilled components of a bird’s song
(Figure 1) and plots frequency bandwidth (the difference between the maximum and
minimum frequencies in the trill) as a function of trill rate (the number of repetitions of a
trilled syllable per unit time). For each song, the orthogonal deviation from an upper
performance boundary established for the species or study population is then determined.
Thus, a song with low vocal deviation reflects superior vocal performance (Podos 2001).
Vocal deviation is relatively straightforward to measure even under field conditions, and
has the advantage of being widely applicable because repeated, frequency-modulated
trills occur in the songs of many songbird species (Podos 1997). Finally, the
biomechanics governing the inherent trade-off between trill rate and frequency bandwidth
are relatively well understood (Podos 1997).
The intricacies of birdsong and the complex motor skill it requires make vocal
performance an excellent candidate for an honest signal (Nowicki and Searcy 2005,
Byers et al. 2010). Birdsong is inherently difficult to produce, because of the physicality
production occurs in the syrinx, which is located at the base of the trachea; the syrinx is
particularly well developed in true (oscine) songbirds (Catchpole and Slater 2008). Each
side of the syrinx can operate independently, such that there are two potential sites at
which sound can originate (Suthers 2004). The sounds mix upon entering the trachea, and
the vocal tract moves in coordination to filter out sounds and modify the final song
(Nowicki 1987, Riede et al. 2006). By stretching or compressing its neck, a singing bird
can dynamically alter the length of its vocal tract (Suthers 2004). Finally, the bill is
another important modulator of sounds and frequency. Bill movements affect song
frequencies such that opening the bill produces a high frequency and closing the bill
produces a low frequency (Westneat et al. 1993, Hoese et al. 2000). Therefore rapidly
modulating the frequency of sound produced requires that the bill be opened and closed
as quickly as possible. This requirement limits the speed with which frequency can be
modulated, based on the distance the bill is required to travel. It is this morphological
constraint that makes it difficult for songbirds to produce broadband trills at a rapid rate,
and is the basis of trill performance as an honest signal (Podos 1997).
Variation in the speed with which individuals can maneuver this mechanism leads
to variation in frequency bandwidth and trill rate, and thus to variation in vocal deviation
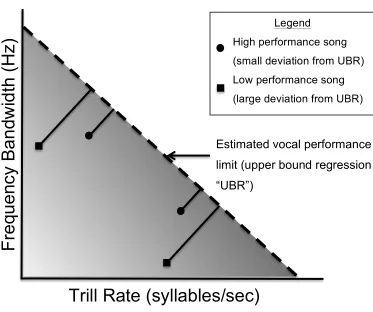
and vocal performance. Plotting the relationship between frequency bandwidth and trill
rate generally yields a triangular distribution, with the majority of trills occupying the
lower left-hand corner and none in the upper right-hand corner of the distribution above
the upper performance limit (Figure 2; Podos 1997, Ballentine et al. 2004). This
relationship has been found in a variety of bird species including multiple species of
Figure 2 - Theoretical diagram of the distribution of songs in acoustic space. The dashed line represents the estimated vocal performance limit established by an upper bound regression. Theory suggests that individual songs will be found in the shaded area, as songs above the performance limit are deemed too physically challenging. The four points represent theoretical trill examples. Squares represent low performance songs with a large deviation from the estimated performance limit, while circles represent high performance songs with a small deviation. Adapted from Ballentine et al.(2004).
Fr
e
qu
e
nc
y B
a
n
dw
id
th
(
H
z)
Trill Rate (syllables/sec)
Estimated vocal performance limit (upper bound regression “UBR”)
warblers (Satophaga petechia; Beebee 2004), Darwin’s small tree finch (Camarhynchus
parvulus; Christensen et al. 2006), Darwin’s medium ground finch (Geospiza fortis;
Huber and Podos 2006), red-winged blackbirds (Agelaius phoeniceus; Cramer and Price
2007), banded wrens (Thryothrosu pleurostictus; Illes et al. 2006, Vehrencamp et al.
2013), house wrens (Troglodytes aedon; Cramer 2013), dark-eyed junco (Junco hyemalis;
Cardoso et al. 2007, 2009, 2012), much of the Emberizid family (Podos 1997) including
swamp sparrows (Melospiza georgiana; Ballentine et al. 2004) and Lincoln’s sparrows
(Melospiza lincolnii; Caro et al. 2010), as well as one non-passerine, brown skuas
(Catharacta antarctica lonnbergi; Janicke et al. 2008). Thus while the song structure of
each species may differ, the trilled components of their song still share the characteristic
trade-off between frequency bandwidth and trill rate used to measure vocal deviation.
1.3.3.1
Bill Morphology as a Constraint on Vocal Performance
Due to the intimate relationship between bill movement and sound production,
several studies have examined the relationship between bill morphology and vocal
performance. In Lincoln’s sparrows, vocal deviation increases with increasing bill length
(Sockman 2009) and in swamp sparrows, multiple species of neotropical woodcreepers
(Subfamily: Dendrocolaptinae) and multiple species of Darwin’s finches, vocal deviation
increases with bill length, width and depth (Podos 2001, Ballentine 2006, Huber and
Podos 2006, Derryberry et al. 2012), suggesting that larger bills impede the movements
required to produce rapid broadband trills. Thus, some of the among-individual variation
in vocal performance may reflect morphological constraints imposed by bill size, in so far
1.3.3.2
Vocal Performance as an Indicator of Quality
In light of claims that signals relying on motor performance should be particularly
honest (Byers et al. 2010), a growing number of studies have investigated the relationship
between vocal performance and various aspects of male quality and/or reproductive
success. While recent studies of dark-eyed juncos (Cardoso et al. 2012) and banded
wrens (Cramer 2013) have found no relationship between vocal deviation and measures
of male quality (including body condition, age, and parasite load), other studies have
found associations between vocal deviation and male quality or reproductive success. For
example, female swamp sparrows perform more copulation solicitation displays in
response to low-deviation than to high-deviation songs (Ballentine et al. 2004), indicating
a preference for songs of superior vocal performance. Moreover, male swamp sparrows
with better vocal performance (low vocal deviation) tend to be older and heavier (and
thus presumably of better quality) than their high-deviation counterparts (Ballentine
2009). The discrepancy between studies may reflect differences in vocal complexity.
Whereas swamp sparrow song is very simple, consisting only of rapid repeated trill
syllables with a single song type per male (Ballentine et al. 2004), both dark-eyed juncos
and banded wrens have relatively complex repertoires (Cardoso et al. 2007, Cramer
2013). Therefore, vocal performance may be a less reliable indicator of male quality in
species with relatively complex song repertoires than in species with simple song
(Cardoso et al. 2012).
Little is known about whether vocal performance is an honest indicator of quality
in birds with complex vocal repertoires. To the extent that some song types are inherently
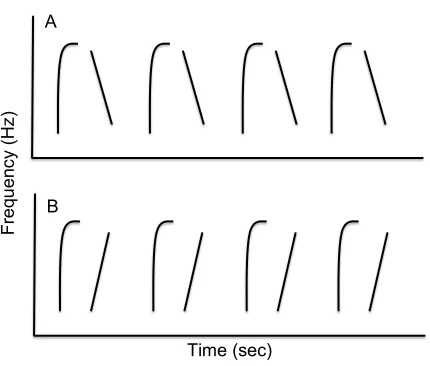
Figure 3 - Examples of two hypothetical trills with identical frequency bandwidth and trill rate, but which differ in performance difficulty. Trill A would be easier to perform as the ending frequency of the first note and starting frequency of the second note are matched, thus not requiring a reconfiguration of the syrinx and vocal tract between notes. Trill B would be more difficult to perform as the mismatch between the ending frequency of the first note and starting frequency of the second note would require significant vocal maneuvering. Adapted from Podos et al. (2009).
Time (sec)
Fr
e
qu
e
nc
y (
H
z)
A
may thus have a concomitantly large within-individual component of variation in
performance. Thus receivers may not be able to easily assess among-individual variation
in vocal performance, because much variation is introduced by differences in song types
among and within the repertoires of individual singers. Indeed, Cardoso et al. (2009)
found that several aspects of song performance in dark-eyed juncos (e.g. proportion of
sound, residual intervals, predicted amplitude) showed more variation within males than
between males. Related to this, Logue and Forstmeier (2008) suggest that large song
repertoires may allow singers to disguise poor vocal performance. That is, when
countersinging the same song type with a better-performing rival, poor performers may
switch to a new and unshared song type such that the ability of receivers to directly
compare vocal performance is compromised. If so, receivers may be limited in their
ability to assess male quality by attending to vocal performance in species with complex
vocal repertoires.
1.4
Objectives and Hypotheses
Song sparrows provide an excellent opportunity to examine the signal value of
vocal performance in a species with complex song repertoires. Male song sparrows learn
to sing during early life (Marler and Peters 1987), and have repertoires of between 5 – 13
song types (Pfaff et al. 2007). Previous studies, including several done on my study
population, have shown that song complexity in this species is influenced by conditions
experienced during early development (Schmidt et al. 2013b) and is positively associated
with phenotypic traits including body condition, physiological condition, immunological
competence, and stress responsiveness (Pfaff et al. 2007, Schmidt et al. 2012, 2013a,
specifically local song structure and song output, suggesting that multiple aspects of song
may encode redundant information regarding the quality of the signaler
(MacDougall-Shackleton et al. 2009a). Finally, although the vast majority of research on song in this
species has focused on song complexity rather than vocal performance, performance is
readily measurable because song sparrow song consists of trilled as well as untrilled
syllables (Figure 1).
In this thesis my first objective was to characterize the repeatability (defined as
the fraction of variation that is due to differences between individuals; Lessells and Boag
1987) of vocal performance in song sparrows. I hypothesized that because each
individual’s repertoire contains multiple song and trill types, within-individual variation
in vocal performance should be substantial and thus repeatability should be low. I also
sought to determine whether average or maximal vocal performance better characterizes
the expected trade-off between frequency bandwidth and trill rate. Given that the
consistency in vocal performance within individuals is expected to be low, I predicted
that the trade-off between frequency bandwidth and trill rate should be more apparent
when using maximum vocal rather than average performance.
The second major objective of my thesis was to determine how vocal performance
is related to age, body size, and bill size. Previous empirical work on swamp sparrows
found that vocal performance was higher in older and larger-bodied males, and that
individual males tended to improve vocal performance between their first and second
breeding seasons (Ballentine2009). From this, I predicted that vocal performance should
similarly be related to age in song sparrows, such that older males should also be better
et al. 2000) and previous empirical work on multiple species (Podos 2001, Huber and
Podos 2006, Ballentine 2006, Sockman 2009), I hypothesized that vocal performance
would be constrained by bill size and predicted that males with larger bills should have
lower vocal performance.
My final objective was to examine the relationship between song complexity and
vocal performance. No causal relationship is expected between song complexity and
vocal performance, nor are these aspects of song likely to be correlated through shared
developmental timing: song complexity is established during neural development in the
first few months of life whereas vocal performance is believed not to be established until
the sensorimotor phase later in the first year (Podos et al. 2009). However, carryover
effects of stress or condition from one life history stage to the next (e.g. Norris et al.
2004) may result in a positive relationship between these components of song despite
their being established at different times of development. Indeed, Podos et al. (2009)
suggest that birds recovering from early life stress may be unable to establish and
maintain a baseline level of vocal performance later in life. Consistent with the idea of
carryover effects, song complexity has been shown to correlate with song output in song
sparrows despite the different developmental timescales over which these aspects of song
develop (MacDougall-Shackleton et al. 2009a). Thus, I predicted that vocal performance
and song complexity should be positively related such that males with more complex
2
Materials and Methods
2.1
General Field Methods
I carried out field work at the Bracken property near Newboro, Ontario, Canada
(44o 38.6’ N, 76o 19.0’ W) owned by the Queen’s University Biological Station. All
measurements and recordings were conducted on a long-term study population of
approximately 35 – 40 breeding pairs of free-living, colour-banded, song sparrows
(Melospiza melodia). The study population is migratory, but adults show high levels of
breeding philopatry upon returning to the site each spring, generally returning to the same
breeding territory as the previous year (MacDougall-Shackleton et al. 2009a).
Birds were captured in mist-nets or seed-baited Potter traps, measured, and their
repertoires recorded between April 9th and June 2nd, 2012. Newly captured individuals
were fitted with a numbered Canadian Wildlife Service band, as well as a unique
combination of coloured leg bands for visual identification. Males were identified by the
presence of a cloacal protuberance, then tarsus length, unflattened wing length, and mass
were measured for each male. Tarsus length and unflattened wing length were measured
to the nearest 0.1 mm using dial calipers, and mass was measured to the nearest 0.2 g
using a spring-loaded scale. These morphological measurements were made either by
myself or one of two other members of the field crew. I did not assess inter-observer
measurement error for these morphological measurements, but in general, these three
measurements are generally consistent between observers (0.54 to 6.40% measurement
In addition to measuring body size, I measured six aspects of bill size in an effort
to fully characterize the size of both the upper and lower bill. Similar to body size
measurements, bill size measurements were made to the nearest 0.1 mm using dial
calipers. However, to eliminate inter-observer measurement error, I conducted all bill
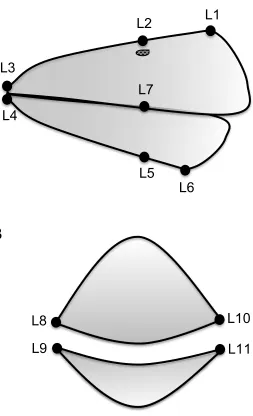
measurements myself. These measurements are summarized in Figure 4. Upper bill
length was measured from above as the horizontal length of the exposed culmen of the
upper mandible (Figure 4A – L1 to L3), and lower bill length was measured as the length
from base to tip of the exposed portion of the lower mandible (Figure 4A – L6 to L4).
Upper bill depth was measured from the side as the depth of the upper mandible at the
position of the nares (Figure 4A – L2 to L7), and lower bill depth was measured from the
side as the depth of the lower mandible at the position of the nares (i.e. directly below the
landmark for upper bill depth; Figure 4A – L7 to L5). Upper bill width was measured as
the width of the upper mandible at the position of the nares (nostrils; Figure 4B –
landmarks L8 to L10). Lower bill width was measured as the width of the lower mandible
at the position of the nares (i.e. directly below the landmark for upper bill width; Figure
4B – L9 to L11).
To assess the extent of within-observer measurement error for bill measurements,
I re-measured the bills of five males that were captured twice. These re-measurements
were done blind to the original measured values. For each of the six measured aspects of
bill size, the first and second measurements were positively correlated (Pearson’s r
ranging from 0.36 to 0.87) but not significantly so (p ranging from 0.13 to 0.90), however
the lack of statistical significance may reflect low statistical power as only five
Figure 4 – A schematic diagram illustrating the three bill measures (length, width and
depth) taken from each of the upper and lower bill of all males. A shows a side-view of a representative song sparrow bill, while B shows a front-view. Upper length was measured from landmarks L1 to L3. Lower length was measured from L6 to L4. Upper depth was measured from L2 to L7. Lower depth was measured from L7 to L5. Upper width was measured from L8 to L10 across the top mandible. Lower width was measured from L9 to L11 across the lower mandible.
A
B
L1
L2
L3
L4
L5
L7
L8
L9
L10
L11
multiple measurements (Pearson’s r = 0.87, p = 0.13), and was therefore the only
measurement used as an estimate of bill size in further analyses. This parallels other
studies, which have similarly used bill length as on estimate of overall bill size (Sockman
2009).
I determined the age of each male using banding records dating back to 2002. Some
males had been banded as nestlings in previous years and their ages were known with
certainty. Others (“adult recruits”) were first captured and banded as adults in 2012 or
previous years; these adult recruits are assumed to have been yearlings when they were
first captured. This is warranted because adult recruits tend to have shorter wings
(characteristic of yearlings) than birds known to be two years or older; because each
spring we capture and band all breeding adults in our study area; and because of the short
distance (<75 m) in which banded birds move territories each year (Lapierre et al. 2011).
Thus I am confident that adult recruits were indeed one year of age upon first capture and
therefore that the age data are accurate.
2.2
Recording Methods
I recorded the full song repertoires of 21 breeding male song sparrows, between
April 10th and May 12th, 2012, within the first five hours of sunrise (approximately 06:00
– 11:00). While some of these males had had their repertoires recorded in previous years,
performance is a dynamic trait (see Byers et al. 2010) and therefore I considered only
repertoires recorded in 2012 in order to examine current performance. Performance is
also context-dependent (see Podos et al. 2009) so I did not use conspecific song playback
to elicit singing, as this apparent territorial challenge might have artificially elevated
song, although because males frequently engage in countersinging, some of my
recordings likely reflect song produced in the context of a naturally-occurring territorial
challenge. Otherwise, my methods for recording full song repertoires followed those
previously established for this study population (Pfaff et al. 2007). Specifically, I
considered an individual’s repertoire to be recorded in full once 300 or more consecutive
songs or 450 non-consecutive songs had been recorded.
I recorded songs directly to the memory disk of a Marantz Professional PMD 671
solid-state recorder using a Telinga Twin Science Pro parabolic microphone (Uppsala,
Sweden). Songs were digitized and spectrograms were created using Raven Pro sound
analysis software (v.1.4; Bioacoustics Research Program, Cornell Lab of Ornithology,
Ithaca, NY, U.S.A.). For all song analyses, I created Hann-type spectrograms with a -3
dB bandwidth filter at 248 Hz in order to filter out background noise. I removed
additional background noise below 1000 Hz and above 10 000 Hz using a frequency pass
filter in Raven Pro, as song sparrow song does not exceed these frequency extremes.
2.3
Song Analysis Methods
2.3.1
Song Repertoire Size
I determined the song repertoire size for each male through visual inspection and
sorting of spectrograms into distinct song types. Song sparrows sing with eventual
variety, repeating one song type multiple times before switching to a new song type. I did
not count slight variations in song (e.g. the addition or omission of a single syllable) as a
new song type. Consistent with previous studies on this species and other populations of
2.3.2
Vocal Performance and Vocal Deviation
To estimate vocal performance, I measured vocal deviation, defined as the ability
to produce trilled elements that approach the upper performance boundary defined by the
trade-off between frequency bandwidth and trill rate (Podos 1997). I began by
categorizing the individual trill types (e.g. trills consisting of unique syllables) in each
male’s repertoire based on visual examination of spectrograms. A given trill type can be
common to multiple song types in an individual’s repertoire; males in my study had 5-9
unique trill types (mean ± standard deviation = 7.10 ± 1.14) in their repertoire. Next,
following methods outlined by Podos (2001), for each trill type in each bird’s repertoire, I
selected ten exemplars of the bird producing that trill type. This yielded a total 50 – 90
exemplars per bird, depending on the number of trill types in its repertoire. Exemplars
were chosen based on order of appearance in the recording (i.e. the first ten examples of a
particular trill type in a recorded repertoire were used when possible), as well the
recording quality and signal to noise ratio of each exemplar (i.e. exemplars with
excessive background noise or unusually low amplitude were skipped and the next
acceptable exemplar was used instead).
From each sampled exemplar, I measured trill rate in Hz from the spectrogram as
the number of times the trilled syllable (consisting of one or more note traces on the
spectrogram; Figure 1) was repeated, divided by the duration (in seconds) of the entire
trill. Also from each sampled exemplar, I measured frequency bandwidth from the
spectrogram as the difference in Hz between the maximum and minimum frequencies at
90 percent signal energy. This 90 percent criterion was used to compensate for variation
From these measurements, I calculated the upper vocal performance boundary for
the population following methods described by Podos (2001) and Blackburn (1992). Trill
exemplars were binned into 3 Hz bins based on trill rate (7 bins total; 0-3 Hz, 3-6 Hz, 6-9
Hz, 9-12 Hz, 12-15 Hz, 15-18 Hz, and 18-21 Hz), and the trill exemplar with the largest
frequency bandwidth was selected from each bin. I then ran a simple least-squares
regression through the resultant subset of seven points. This regression line represents the
estimated vocal upper performance boundary for this population. While the choice of bin
size is arbitrary, Blackburn (1992) argues that between 6-15 bins is ideal, as this is the
region where the estimates of slope are largely independent of sample size and number of
bins. Increasing the number of bins beyond this range results in a statistically powerful
regression, but is less accurate in reflecting the upper performance boundary (Blackburn
1992). My use of seven 3 Hz bins is comparable to previous studies in other songbirds,
which have used 10 bins varying in size from 1-5 Hz, depending on observed variation in
trill rates (Podos 1997, Ballentine et al. 2004). The combination of bin number and size
in this study should thus provide an accurate estimate of the upper performance boundary
while remaining fairly robust to small sample size and thus permitting statistical
significance testing.
After generating the upper performance regression as described above, I
calculated the average trill rate and frequency bandwidth across all ten sampled
exemplars of each trill type for each individual bird. Thus, each bird was represented by
5-9 (depending on the number of trill types in its repertoire) values of trill rate and
frequency bandwidth, and these average values for each trill type in each individual’s
calculated the orthogonal distance from each of these points to the upper boundary
regression, resulting in 5-9 values of trill deviation per individual (again depending on
number of trill types in the repertoire). From these values, I calculated the average vocal
deviation for each male as the mean of these orthogonal distances across all of its trill
types.
To measure each individual’s maximum vocal performance (that is, its minimum
vocal deviation), I used similar methods as described above except that the vocal
deviation score for each individual was not the average value of all trill types. Instead, I
plotted all trill exemplars sampled (50-90 per male) onto the frequency bandwidth – trill
rate distribution, and the single exemplar with the lowest distance to the upper
performance boundary was used as that individual’s minimum vocal deviation. This
approach minimizes the effect of sub-maximal performance and the within-individual
variation in performance seen across multiple trill exemplars (Podos et al. 2009).
2.4
Repeatability of Vocal Performance
To determine whether individuals differ consistently in vocal performance as
assessed by vocal deviation, I calculated repeatability (defined as the intraclass
correlation coefficient, or the proportion of variation resulting from among-individual
rather than within-individual variance components) of vocal deviation. I conducted
one-way ANOVAs in JMP (v.10; SAS, Cary, NC, U.S.A.) to determine among- and
within-individual variance components and then used these to calculate repeatability following
Lessells and Boag (1987). Because I was particularly interested in the degree to which
variation in trill type difficulty within an individual’s repertoire contributes to
repeatability. Specifically, I calculated repeatability of vocal performance based on (1) all
trills in a male’s repertoire; (2) all simple trills in a male’s repertoire; (3) a single,
randomly chosen, simple trill type from each male’s repertoire; and (4) a single,
randomly chosen, complex trill type from each male’s repertoire. If within-individual
variation in vocal deviation is due in part to variation in trill type difficulty, the first two
estimates of repeatability (which include variation resulting from trill types within an
individual’s repertoire varying in difficulty) should be lower than the last two, which
exclude this component of variation.
To supplement the repeatability analysis and more directly investigate the main
source of among- and within-individual variation in vocal performance, I conducted a
nested ANOVA. Maximum vocal performance (minimum vocal deviation) was the
response variable, with bird identity and trill type nested within bird identity as the
explanatory variables. If most variation in vocal deviation is attributable to differences
among individuals (i.e. some birds are consistently better performers than others), we
should find a significant effect of bird identity on vocal deviation. In contrast, if most
variation in vocal deviation is attributable to differences among trill types within the
repertoires of individuals (i.e. some trills are harder to perform well than others), we
should find a significant effect of trill type nested within bird identity on vocal deviation.
Finally, a finding of no main effect of either bird identity or trill type nested within bird
identity would indicate that vocal performance varies substantially within individuals
even over multiple renditions of the same trill type. Such a pattern might suggest that
2.5
Simple versus Complex Trills
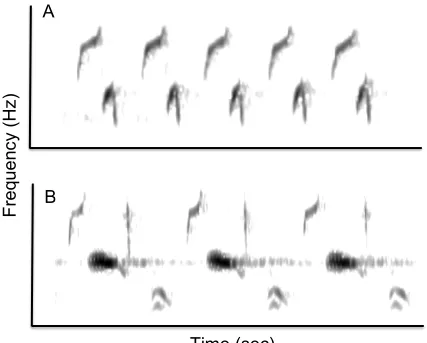
I observed substantial variation among trill types in the number of notes
(continuous traces on a spectrogram) that comprised the trill syllable (Figure 5). Because
this variation might affect the difficulty of rapidly repeating a particular trilled syllable
(i.e. syllables composed of many notes cannot be repeated as quickly as those composed
of a single note), I classified trill types by the number of notes comprising the trilled
syllable. ‘Simple’ trills were those consisting of two or fewer notes in the trilled syllable,
and ‘complex’ trills were those consisting of three or more notes in the trilled syllable
(Figure 5).
To compare vocal performance as measured from all trill types versus the subset
of trill types defined as ‘simple’, I used average frequency bandwidth and trill rate values
for each trill type in each bird’s repertoire (as described above) to calculate average vocal
deviation using two different distributions. The first distribution included all trill types
(simple and complex) and the second consisted of simple trills only. I then characterized
the upper performance boundary lines separately for each graph as described above, in
order to determine whether the frequency bandwidth-trill rate trade-off is equally
apparent regardless of whether all trill types or only simple trills are considered.
2.6
Data Analysis
All statistical analyses were two-tailed and were completed in JMP (v.10; SAS,
Figure 5 – Spectrograms of trills from song sparrows, illustrating an example of a simple trill (A) and a complex trill (B). Trill A is comprised of syllables containing two notes and is therefore classified as a simple trill. Trill B is comprised of syllables containing four notes and is therefore classified as a complex trill.The syllable in trill A is repeated a total of five times; that in trill B is repeated a total of three times.
Time (sec)
A
B
Fr
e
qu
e
nc
y (
H
2.6.1
Vocal Performance as a Function of Age, Bill size and Body size
To examine how maximum vocal performance (measured as minimum vocal
deviation) varies with age, bill and body size, I used a standard least-squares general
linear model regression. Age, bill size and body size were used as predictors of maximum
vocal performance. Age was included as a categorical predictor with males being
classified as either ‘second year’ (i.e. one year old) or ‘after second year’. Bill size was
measured as the lower bill length (see section 2.1) and was a continuous predictor. Mass
was used as a proxy for body size following the methods of Ballentine (2009) and was
also a continuous predictor. Interaction terms were included in the initial model, but were
not significant and subsequently removed from the final model.
To determine whether maximum vocal performance varies with song repertoire
size, I used a Pearson’s product-moment correlation between song repertoire size and
minimum vocal deviation. Repertoire size was not included as a predictor in the GLM
described above because no causal relationship was expected between repertoire size and
vocal performance. One apparent statistical outlier was removed from the correlation, as
both its leverage and Cook’s distance values exceeded criteria for removal (observed and
threshold leverage values were 0.29 and 0.19 respectively; observed and threshold
Cook’s distances were 1.22 and 1 respectively). Notably, the single individual removed
from the correlation was the oldest bird in the population (age 7, compared to a mean age
3
Results
3.1
Repeatability of Vocal Performance
To test the degree to which vocal performance shows consistent among-individual
variation, I calculated the repeatability of: (1) all trills in a male’s repertoire; (2) all
simple trills in a male’s repertoire; (3) a single, randomly chosen, simple trill type from
each male’s repertoire; and (4) a single, randomly chosen, complex trill type from each
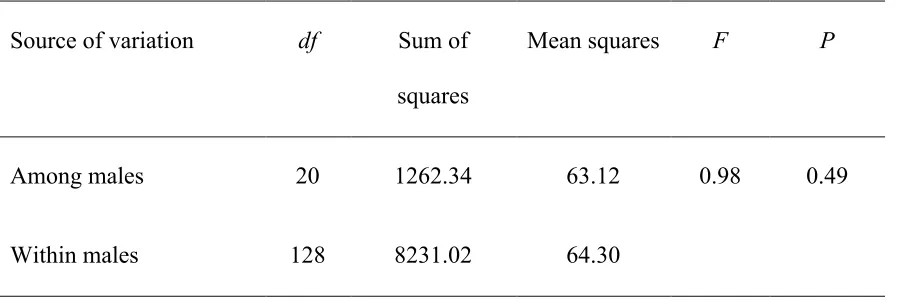
male’s repertoire. Males showed low repeatability of vocal performance for all trills and
for only simple trills. Indeed, repeatability of vocal deviation across all trill types within
an individual’s repertoire was low and not significantly different from zero (F20,128 = 0.98,
repeatability = -0.003, p = 0.49; Table 1). Similarly, repeatability of vocal performance
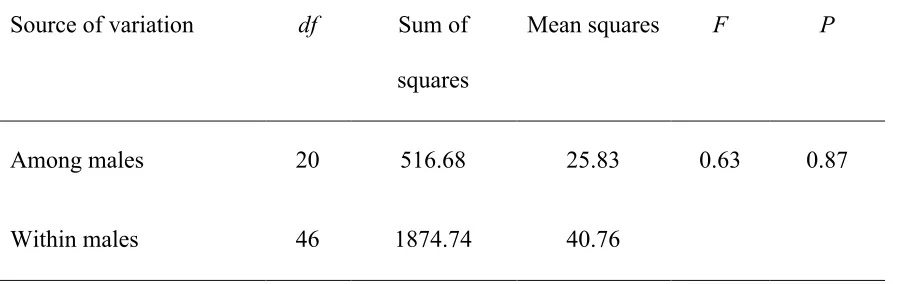
across the subset of simple trill types within an individual’s repertoire was also low and
not significantly different from zero (F20,46 = 0.63, repeatability = -0.13, p = 0.87; Table
2). This low repeatability of vocal performance for all trills and for only simple trills
suggests considerable variation in performance within individuals.
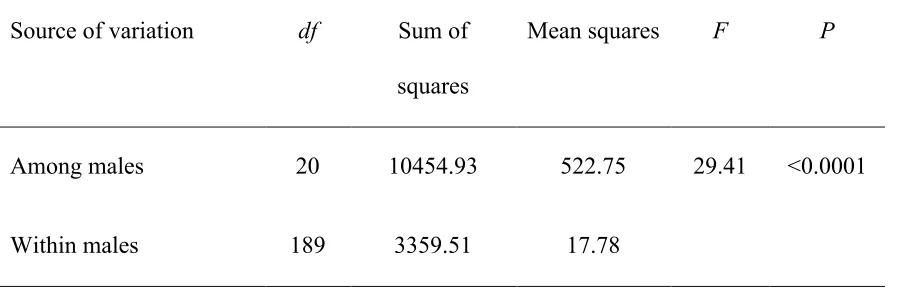
In contrast, males showed high repeatability of vocal performance across multiple
examples of the same trill type. The repeatability of vocal performance across ten
exemplars of one randomly selected trill type per individual was high and significantly
greater than zero for both simple trill types (F20,189 = 185.12, repeatability = 0.95, p
<0.0001; Table 3) and complex trill types (F20,189 = 29.41, repeatability = 0.74, p <0.0001;
Table 4). Together, these findings suggest that within-individual variation in performance
is largely due to performance differences among trills within an individual’s repertoire
(trill types differ in their inherent difficulty) rather than to variation in performance
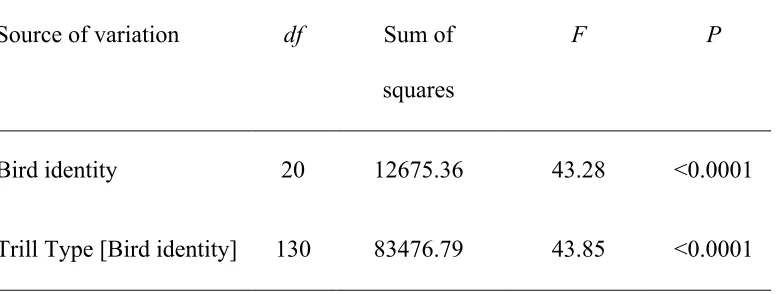
Maximum vocal performance also differed between males and the variation
within males was explained by differences in performance between trill types. I used a
nested ANOVA to more directly assess the main source of variation in vocal deviation,
with minimum vocal deviation as the response variable, and bird identity and trill type
nested within bird identity as the explanatory variables. Bird identity explained a
significant proportion of variation in minimum vocal deviation (F20,130 = 43.28, p
<0.0001, Table 5), suggesting that males differ in maximum vocal performance.
Moreover, trill type nested within bird identity also explained a significant proportion of
variation in minimum vocal deviation (F20,130 = 43.85, p <0.0001, Table 5), suggesting
that the majority of within-individual variation in performance arises due to differences
among trill types in inherent difficulty. These findings parallel the results of the
repeatability analyses, which also suggested that the majority of variation within
individuals was due to variation in performance between trill types.
3.2
Average versus Maximum Vocal Performance
Maximum vocal performance better addresses the trade-off between frequency
and bandwidth and trill rate in song sparrows. Indeed, when maximum and average vocal
performance were calculated for each individual, the upper boundary regression
calculated from measures of maximum vocal performance was more steeply negative
than that calculated from measures of average vocal performance, and only the
maximum-performance-derived upper boundary regression was statistically significant
(maximum performance: slope= -154.12, SE = 47.21, r26=0.68, p=0.02; average
performance: slope = -131.76, SE = 62.74, r26=0.47, p=0.09). This suggests that
and trill rate in song sparrow song than does average performance, and thus my
subsequent analyses focus on maximum performance.
3.3
Complex versus Simple Trill Performance
Simple trills tended to have lower vocal deviation and thus higher performance
when compared to complex trills. When plotting the frequency bandwidth and trill rate of
all trill types (simple and complex), the majority of the points were located in the
lower-left corner of the plot (Figure 6A). By contrast, plotting only the subset of simple trills
yielded a triangular distribution (Figure 6B) characteristic of a trade-off between
frequency bandwidth and trill rate (Podos 1997). Supporting this, the regression of
frequency bandwidth as a function of trill rate used to characterize the upper performance
boundary for complex and simple trills combined was not statistically significant (r26 =
0.47, p = 0.09), but the upper performance boundary regression for simple trills alone was
statistically significant (r26 = 0.85, p = 0.003). Moreover, the upper performance
boundary regression for simple trills alone was more steeply negative than that for simple
and complex trills combined (slopes of -291.47 and -131.76, respectively). Vocal
performance was higher (i.e. vocal deviation was lower) for simple than for complex
trills, as assessed by orthogonal deviation from the upper boundary regression of complex
and simple trills combined (two-sample t-test, t147 = -5.62, p < 0.0001).
3.4
Vocal Performance as a Function of Age, Bill Size and Body Size
I used a multiple regression to examine the effects of age (yearling versus older),
Contrary to my original predictions, vocal performance did not vary with age, bill size or
body size (Table 6).
3.5
Vocal Performance and Song Complexity
Vocal performance and song complexity were negatively related in this
population of song sparrows. Indeed, after removing one outlying data point
(corresponding to the oldest bird in the population; see section 2.6.3), the negative
relationship between minimum vocal deviation and song repertoire size was significant
(Figure 7; Pearson’s r19 = -0.44, p = 0.05). That is, males with lower minimum vocal
deviation (and thus superior maximum vocal performance) also tended to have larger
Table 1 - Repeatability of vocal performance across all trill types performed by each male. N=21 male song sparrows each with 5-9 trill types measured.
Source of variation df Sum of
squares
Mean squares F P
Among males 20 1262.34 63.12 0.98 0.49
Table 2 - Repeatability of vocal performance across all simple trill types performed by each male. N=21 male song sparrows each with 1-6 simple trill types measured.
Source of variation df Sum of
squares
Mean squares F P
Among males 20 516.68 25.83 0.63 0.87
Table 3 - Repeatability of vocal performance across ten exemplars of one randomly chosen simple trill type, from each of 21 male song sparrows.
Source of variation df Sum of
squares
Mean squares F P
Among males 20 6523.36 326.17 185.12 <0.0001
Table 4 - Repeatability of vocal performance across ten exemplars of one randomly chosen complex trill type, from each of 21 male song sparrows.
Source of variation df Sum of
squares
Mean squares F P
Among males 20 10454.93 522.75 29.41 <0.0001
Table 5 – Summary of nested ANOVA with maximum vocal performance
(measured as minimum vocal deviation) of 21 male song sparrows as the dependent variable.
Source of variation df Sum of
squares
F P
Bird identity 20 12675.36 43.28 <0.0001
Figure 6 – Maximum frequency bandwidth versus trill rate for complex (open circles; n = 149 trill types in the repertoires of 21 male song sparrows) and simple (filled circles; n = 67 trill types in the repertoires of 21 male song sparrows) trill types. The solid line represents the upper performance boundary, calculated independently for each distribution. Distribution A, showing both simple and complex trill types had a non-significant upper performance boundary (slope = -131.76, r2
6 = 0.47, p = 0.09).
Distribution B, showing only simple trills, had an upper performance boundary that was both steeper than A and significant (slope = -291.47, r26 = 0.85, p = 0.003). Distribution
B also shows the triangular distribution characteristic of performance trade-offs (Podos 1997).
Fr
e
q
ue
nc
y
B
a
nd
wid
th
(
H
Table 6 – Results of a general linear model with maximum vocal performance (measured as minimum vocal deviation) of 21 male song sparrows as the dependent variable.
Predictor df Sum of
squares
F P
Age 1 0.53 0.07 0.80
Body Size (Mass)
Bill Size (Lower length)
Overall Model
1
1
20
6.23
28.62
167.83
0.78
3.59
1.35
0.39
0.08
0.29
Figure 7 - Relationship between song repertoire size and minimum vocal deviation in 20 male song sparrows. Minimum vocal deviation and song repertoire size show a
significant negative correlation (Pearson’s r19= -0.44, p = 0.05).
4
5
6
7
8
9
10
11
12
-6
-4
-2
0
2
4
6
Song Repertoire Size
Mi
n
im
u
m
V
o
c
a
l
D
e
v
ia
ti
o
4
Discussion
Despite increasing interest in performance-related sexually selected displays in
general (Byers et al. 2010), and songbird vocal performance in particular (Podos 1997,
2001, Ballentine et al. 2004, Ballentine 2006, 2009, Cardoso et al. 2012, Cramer 2013)
studies of vocal performance have focused on species with simple vocal repertoires (e.g.
swamp sparrows, Lincoln’s sparrows, Darwin’s finches, yellow warblers). Examining
vocal performance in a species with more complex song (multiple song types per male)
requires first evaluating the degree to which this trait varies among versus within
individuals (e.g. across different song types within a repertoire). Vocal performance, as
measured by trill vocal deviation, was not repeatable across multiple trill types within
individuals’ repertoires, but was highly repeatable across multiple exemplars of a single
trill type per individual. A supplementary analysis also showed that the majority of
within-individual variance in vocal performance was due to performance differences
between trill types. Maximum vocal performance (i.e. minimum vocal deviation) better
characterized the trade-off between frequency bandwidth and trill rate than did average
vocal performance. Similarly, simple trills better characterized this trade-off than did all
trill types combined. Maximum vocal performance was not associated with age or body
size, but was correlated with song repertoire size, such that males with lower minimum
vocal deviation tended to have more complex song repertoires. Collectively, my results
suggest that vocal performance varies substantially both within and among individual
male song sparrows, and that performance in this population does not indicate age or