Volume 2010, Article ID 476598,9pages doi:10.1155/2010/476598
Research Article
Range-Based Localization for UWB Sensor Networks in
Realistic Environments
Guowei Shen, Rudolf Zetik, Ole Hirsch, and Reiner S. Thom¨a
Department of Electrical Engineering and Information Technology, Ilmenau University of Technology, 98693 Ilmenau, Germany
Correspondence should be addressed to Guowei Shen,[email protected]
Received 6 April 2009; Accepted 1 September 2009
Academic Editor: Xinbing Wang
Copyright © 2010 Guowei Shen et al. This is an open access article distributed under the Creative Commons Attribution License, which permits unrestricted use, distribution, and reproduction in any medium, provided the original work is properly cited.
The Non-Line of Sight (NLOS) problem is the major drawback for accurate localization within Ultra-Wideband (UWB) sensor networks. In this article, a comprehensive overview of the existing methods for localization in distributed UWB sensor networks under NLOS conditions is given and a new method is proposed. This method handles the NLOS problem by an NLOS node identification and mitigation approach through hypothesis test. It determines the NLOS nodes by comparing the mean square error of the range estimates with the variance of the estimated LOS ranges and handles the situation where less than three Line of Sight (LOS) nodes are available by using the statistics of an arrangement of circular traces. The performance of the proposed method has been compared with some other methods by means of computer simulation in a 2D area.
1. Introduction
Localization in distributed Ultra-Wideband (UWB) sensor networks is an important area that attracts significant research interest. It is required in many sensor network applications, such as indoor navigation and surveillance,
detection and tracking of persons or objects, and so on [1–4].
The range-based time of arrival (TOA) approach is the most suitable approach for localization in UWB sensor networks, because it is proved to have a very good accuracy due to the high time resolution (large bandwidth) of UWB
signals [3,4].
Cooperative operation of several network nodes requires temporal synchronization. One distinguishes between two
different versions of node synchronization in sensor
net-works. In the first case, only the reference nodes are synchronized. After transmission of a signal by the target
node, ranges can be estimated by using the time differences
between the signal arrivals at different reference nodes. In
the second case, all nodes are synchronized. Here the time of pulse generation is known and ranges can be estimated from TOA measurements immediately. The minimum num-ber of reference nodes, necessary for the application of
trilateration methods that operate without ambiguity in a two-dimensional (2D) scenario, is three in the case of full synchronization and four if only the reference nodes are
synchronized. Apart from the different minimum numbers
of nodes, there is no principle difference between the
two methods. In this article, full synchronization is always assumed.
In most TOA-based localization systems in Line of Sight (LOS) situations, the two-step positioning is the common technique, which includes a range estimation step and a
location estimation step [3,4]. Firstly, the time delays signals
that propagate from the target node to the reference sensor nodes are estimated through TOA estimation, and then the time delays are converted to distance parameters (range estimates) by multiplication by the speed of light. This step is called range estimation. After that, the position of the target node is estimated based on the range estimates via trilateration. This step is called location estimation.
[5]. Both the TOA estimation and the range estimation
precision can be improved by application of efficient
methods [4], such as maximum likelihood methods (e.g.,
generalized maximum likelihood method in [6]), subspace
methods (e.g., MUSIC method in [7]), and some
low-complexity techniques (e.g., threshold-based methods in
[8]).
For the implementation of the second step, many diff
er-ent algorithms were developed. All of them try to acquire a high precision of the localization from the range estimates,
such as Taylor series method (TS) [9,10] and approximate
maximum likelihood method (AML) [11]. Furthermore,
in [12, 13], various location estimation algorithms (for
range-based localization) have been analyzed and compared
in 3-dimensional (3D) space. In [14], a novel joint TOA
estimation and location estimation technique for UWB sensor network applications is proposed which uses the residual localization error as a metric to optimize the ranging thresholds.
In an urban or indoor environment, localization is mainly deteriorated by the multipath propagation and Non-Line of Sight (NLOS) situations. If some obstacles, for example, walls, or objects attenuate or block the direct signal between the transmitter and the receiver, the transmitted signal can only reach the receiver through a reflected,
diffracted, or scattered path, so that the path length increases.
In such environments, generally, those TOA estimation methods we mentioned before become suboptimal, because in this case the strongest path is not always the direct, or Line of Sight (LOS), path. Therefore, a typical positive ranging
offset will occur [14,15].
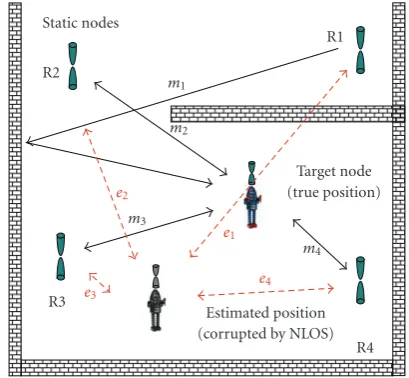
A simple example scenario of a network is shown in Figure 1. The network consists of four static reference nodes R1–R4 and one target node T1. The estimated distance
between R1 and T1,m1, may be much larger than the true
distance because of the blockage by the wall.
In this case, the location estimation algorithms men-tioned before can also hardly handle this situation. Applica-tion of TOA estimaApplica-tion in the locaApplica-tion estimaApplica-tion step will lead to large position errors.
In this article, we focus on the localization problem in realistic environments and propose a novel NLOS identi-fication and mitigation algorithm that can cope with this NLOS problem. We assume that a number of static reference nodes and one target node are deployed in a UWB sensor network. A 2D arrangement is considered for simplicity of explanation. The distances between target node and reference nodes are obtained beforehand by TOA estimation, but it is not known a priory, which of them (if any) contain NLOS errors.
The remainder of this article is organized as follows. A comprehensive overview of the existing methods of handling
the NLOS problem is presented and analyzed inSection 2.
InSection 3, a novel hypothesis test for NLOS identification and mitigation is proposed and described in detail. The performance of the new method is evaluated and compared with results of standard methods by computer simulation in Section 4. Finally, conclusions are given inSection 5.
Static nodes
Figure1: Example location scenario. The network consists of four static reference nodes R1–R4 (indicated by receiving antenna in green/black) and one target node T1 (indicated by a robot with transmitting antenna). The blockage by the wall between Node R1 and T1 creates an NLOS situation, but for the others reference nodes, T1 is in an LOS position. Themi(i=1, 2, 3, 4) are the range
estimates between the reference nodes and the target node.
2. Overview of Existing Methods
We present an overview of important range-based localiza-tion methods that take into account the NLOS problem.
A residual weighting approach was first proposed in
[16] for a TOA location scheme. It uses all NLOS and LOS
estimated distances for the localization and applies residual ranking to minimize the influence of NLOS contributions.
Different combinations of the reference nodes are considered
to estimate the location and the corresponding residual error. The location estimates with smaller residuals have larger chances of corresponding to the correct target position. Hence, this algorithm weights the location estimates with the inverse of their residual errors. This residual ranking method can work very well when we have a large number of reference nodes and one of them is in an NLOS situation. The problem of this approach is that the estimate can be unreliable because NLOS errors, although reduced, are still present. The location is estimated by inclusion of all already estimated distances without any identification of LOS and NLOS channel conditions. In addition, it is computationally intensive, because it tries out all possible combinations of all nodes to determine the NLOS situations, especially when the total number is very large.
Another approach of handling the NLOS problem is location by tracking and smoothing. This approach detects discontinuities of the estimated historical positions by using
tracking algorithms like Kalman filter [17] or Particle filter
[18]. However, although it can detect points in time where
A more popular approach is attempting to distinguish between the nodes in LOS and in NLOS positions and
to mitigate the effects of NLOS nodes within the location
estimation step. For example, in the location scenario in Figure 1, we can try to recognize that the channel between R1 and T1 is in NLOS condition and to locate T1 without using this NLOS node. The advantage of this approach is that if the identification is correct, the accuracy of the localization can be considerably improved. For the practical realization of this concept, the following attempts have been suggested in literature.
A method is proposed in [15] that investigates the
received multipath signal. It is based on the signal power variation, and it assumes that a sudden decrease of SNR (Signal-to-Noise Ratio) could indicate the movement from an LOS into an NLOS position, and vice versa. Therefore,
this method is a time history-based method. In [19], an
identification technique based on the multipath channel statistics is proposed. It distinguishes between LOS and NLOS channel conditions by exploiting the amplitude or the delay statistics of the UWB channels. The amplitude statistics are captured using the kurtosis and the delay statistics are evaluated using the mean excess delay and the root mean square (RMS) delay spread of the received multipath components (MPCs). These algorithms identify NLOS nodes by means of the received multipath signal or the channel statistics.
As an alternative, it is also possible to identify LOS and NLOS channel conditions by using the range estimates.
For example, a hypothesis test method is proposed in
[20]. It is based on the theory that the NLOS error increases
the standard deviation of the estimated distances of each
reference node. In [21], a decision theoretic framework for
NLOS identification is presented, where time history-based hypothesis tests for the probability density function (PDF) of the results of TOA measurements are proposed. Here the NLOS and LOS range estimates are modeled as Gaussian random variables. These methods are time history-based hypothesis test methods. They consider the time history of estimated distances from each reference node individually.
In [20], the measurement noise variance is assumed to be
known. Moreover, a residual test is proposed in [22]. It works
on the principle that if all measurements are performed under LOS channel conditions, the residuals have a central Chi-Square distribution and the residuals are the squared
differences between the estimates and the true positions. It
is computationally intensive similarly to [16], because it tries
out all possible combinations of all single nodes to find NLOS situations. In addition, it cannot treat situations with only three reference nodes.
3. Proposed Method
In this article, we consider a sensor network consisting of three or more reference nodes and one target node in a 2D
area. The reference nodes Ri are fixed and their positions
are already known (index i always goes from one to n,
the number of the reference nodes, for all variables in
this article). We assume that all the reference nodes are synchronized with each other. The situation of the target node is stationary or moving.
For a stationary target node or a certain moment in case of a moving target node, the time delays of a signal that travels from the target node to the reference nodes are obtained by TOA estimation after performing measurements, and hence the distances are acquired. Here in this article, the estimated distances are referred to as range estimates. However, there is no prior knowledge of the LOS or NLOS conditions.
The range estimate between theith reference node and
the target node,di, where the “hat” indicates the estimate, is
modeled as
di=ri+bi+εi, (1)
where ri are the true distances; εi denote the noise of
range estimates and are assumed to be independently and identically distributed zero mean Gaussian random variables
with variance σLOSi2 [14, 22]; bi are the distance biases
introduced due to the NLOS blockage [14] and must be
additive non-negative errors. If the channel is in LOS
condition, thenbiis zero. In most cases, if the channel is in
NLOS condition,biis much greater than the absolute value
ofεi(i.e.,bi |εi|). The noiseεican be reduced by averaging
repeated measurements for each reference node in a static situation.
3.1. Hypothesis Test Using MSE of Range Estimates and Variance of LOS Range Estimates. From (1), the range estimation errors for each reference nodes are
ξi=di−ri= ⎧ ⎨ ⎩
εi, in LOS channel conditions,
εi+bi, in NLOS channel conditions.
(2)
That means the range estimate errors in LOS channel
conditions are zero-mean Gaussian variables, that is,ξi ∼
N(0,σLOSi2). However, the true distances ri are always
unknown. We use the initial location estimate, by treating all the reference nodes as being in LOS situation, to estimate the distance. Then, the estimated range errors are
ξi=di−ri, (3)
where ri are the estimated distances by using the initial
location estimate.
The mean square error (MSE) of ξi with respect to ξi,
which is referred to asM, is
M=MSEξ=Eξ−ξ2
LOS2, in LOS channel conditions,
E(ε+b)2> σLOS2, in NLOS channel conditions, (4)
where E(·) refers to the calculation of mathematical
ε3
Figure 2: Demonstration for the hypothesis test. The solid circles are produced by estimated distances and dashed circles are produced by true distances. R2 and R3 are in LOS situation and estimated distances are only affected by measurement noise. R1 is in NLOS situation; estimated distance is affected by measurement noise and NLOS blockage.
It follows from (4) that in a pure LOS situation MSE of
range estimates should not be greater than the variance of
the LOS range estimates,σLOS2. In contrast, if one or more
NLOS nodes are within the group of nodes, M is greater
thanσLOS2because the NLOS biasesbiare additive positive
values.
This point can be demonstrated inFigure 2. Nodes R1,
R2, and R3 are three static reference nodes. The radiuses of the circles are the corresponding range estimates. When all the nodes are in LOS situation, the range estimation
errors,ξ1,ξ2andξ3, are caused only by noise. The location
estimation of the target node is position T1. In this case, the MSE of the range estimates is equal or smaller than the variance of the LOS range estimates. If, however, the node R1
is in an NLOS situation, the positive NLOS distance biasesb1
adds to the measurement distance. Assume position T1to
be the result of the location. Then, the MSE of the measured ranges will be greater than the variance of the LOS range estimates.
The variances of the LOS range estimatesσLOSi2are
dif-ferent at different distances, because the noise level of range
estimates depends on the distance. We define σLOS2 as the
greatest value of the variance among the estimated variances of measurements with all reference nodes. Therefore, for a
specific UWB device, it can easily be obtained by k(k >
0) times distance measurements and range estimates in a pure LOS environment within the possible greatest distance, for example, a room without any objects (e.g., furniture, electronic devices, etc.) inside.
Let a random variableXbe a vector of the range estimates
errors of each measurement,X = [ζ1,ζ2,. . .,ζk], then the
maximum likelihood estimation of the variance of the range estimates is
A hypothesis test can be deduced from the idea described above. This hypothesis test determines if NLOS nodes exist or not by comparing the MSE of the range estimates with the variance of the LOS range estimates. The two hypotheses are
H0:M≤σLOS2, no NLOS node exists,
H1:M > σLOS2, NLOS nodes exist.
(6)
The MSE of the range estimates,M, can be calculated by
M=MSEξ= 1
If nodes in NLOS situation are determined, the one with the highest probability of being an NLOS node will be excluded from this group and the subgroup must be checked once again until there are no more NLOS node detected, or until there are only three reference nodes left. In this case, the node having the highest probability of being an NLOS node will be identified later.
After that, location estimation is done by using the nodes left.
The procedure of this Hypothesis Test is summarized as follows.
(1) Perform location estimation by treating all reference nodes as if they would be in LOS channel conditions.
(2) Calculate the MSE of the range estimatesM
accord-ing to the estimated distancesri.
(3) Compare M with the variance of the LOS range
estimatesσLOS2. IfM ≤ σLOS2, we conclude that no
NLOS nodes exist. In this case, we proceed with the final location estimation. Otherwise, proceed with the next step.
(4) Estimate the locations and calculate the MSEs of the
range estimates for each subgroup withn−1 nodes.
(5) Compare each MSE of the range estimates with the variance of the LOS range estimates. This step will be explained in detail later.
(b) If no MSEs are smaller than the variance of the LOS range estimates, we choose the node with the highest probability of being an NLOS node as the NLOS node. Then, proceed to step (4) and repeat the procedure with the remaining
n−1 nodes until there are no more NLOS nodes
detected or until there are only three reference nodes left.
(c) If more than one MSE is smaller than the variance of the LOS range estimates, we do the same as explained in step 5(b) , choose the node with the highest probability of being an NLOS node as the NLOS node, and proceed to step (4).
(6) Locate estimation with the remaining nodes by excluding the NLOS nodes identified before.
A step by step explanation shall be given using the simple
scenario inFigure 1. In step (3), we discern that one or more
NLOS nodes exist. In step (4), we do location estimations and calculate the MSEs for the four subgroups of four nodes. Then, each MSE is compared with the variance of the LOS range estimates. In step (5), we find that the MSE and only this MSE, which is obtained by the subgroup (R2, R3, and R4) without the node R1, is smaller than the variance of the LOS range estimates. Therefore, in step 5(a), we conclude that no NLOS nodes exist in this subgroup. Hence, node R1 is identified as an NLOS node in this scenario. Then, the location estimate can be done by the subgroup (R2, R3, and R4) in step (6).
In this simplest case, there is only one MSE smaller than the variance of the LOS range estimates detected in step (5), because only one NLOS node exists. However, this algorithm is an iterative method and there can two special cases appear (in steps 5(b) and 5(c)) at a certain iteration. They are explained separately in the following.
At a certain iteration, if no MSE is smaller than the variance of the LOS range estimates (step 5(b)), all subgroups still include NLOS nodes. In this case, the number of NLOS nodes is greater than one. Then, the node having the highest probability of being an NLOS node is determined in the following way:
We defineξas the average values ofξifor each subgroup.
The difference betweenξandξis that the node outside of
the corresponding subgroup is also taken into account within
the calculation of ξ. Because the NLOS biases are additive
positive errors,ξwould be greater thanξobtained without
the node outside of the corresponding subgroup. A more precise location estimate provides less MSE. Therefore, we
chose the subgroup, which satisfiesξ > ξand provides the
smallest MSE, as the subgroup having the lowest probability of including NLOS nodes. The node, not included in this subgroup, has the highest probability of being an NLOS node.
In addition, there can be another special case (in step 5(c)). It is possible that more than one MSE is smaller than the variance of the LOS range estimates, although only one
R4
R4
R3
R1
R2
Figure3: Demonstration of the special situation. The solid circles are created based on the range estimates and the dashed circle R4
is produced based on the true distance between the target node and reference node R4. In this case, there are two subgroups, (R1, R2, and R3) and (R1, R2, and R4), with MSE of the range estimated smaller than the variance of LOS range estimates.
NLOS node exists. This case is demonstrated in Figure 3.
There are four reference nodes R1–R4 in this network. Node
R4 is an NLOS node and the dashed circle R4is produced
based on the true distance. In this case, the criterionM ≤
σLOS2is satisfied by two subgroups, (R1, R2, and R3) and (R1,
R2, and R4).
In this case, we also determine the node that has the highest probability of being an NLOS node within the corresponding subgroup as described above. In contrast, here we do the detection within those subgroups where the MSE is smaller than the variance of the LOS range estimates. It is easily to know that, generally, the iteration will be finished and stopped after a few number of times iteration. The number of iteration times relates to the number of the NLOS nodes in the examined sensor networks and should be equal or less than the number of the NLOS nodes. Therefore, this method is not so computational intensive as the method
in [16,22].
3.2. Hypothesis Test Using the Statistics of the Arrangement of Circular Traces. In a large sensor network, there is a high probability of having three or more LOS nodes. However, in case of less than three reference nodes with LOS channel conditions, the above hypothesis test will stop identification and will perform the location estimation with the three nodes left and with some NLOS nodes still included. We
propose a simple but efficient method to improve the
location estimation by using the statistics of the arrangement of circular traces obtained from the range estimates.
A
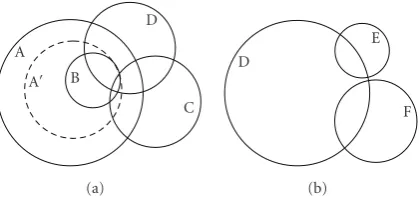
Figure4: Situation of the arrangement of circular traces.
the target node must be inside the intersection area of the circles.
If it happens that one circle surrounds one of the other
circles, as the nodes A and B displayed in Figure 4(a),
reference node A is identified as an NLOS node [23].
Moreover, in this case, the range estimate of reference node A can be reduced to the value where the two circles are tangent
at a single point. This is shown inFigure 4(a) (the dashed
circle A). The revised value of the range estimate will be
closer to the true distance. Then, the revised value is used in the data fusion.
We have also noticed a situation where two circles are isolated from each other, for example nodes E and F
displayed inFigure 4(b). In such situation, both node E and
node F should be regarded as LOS reference node, because
this situation is normally caused by the noise εi in an LOS
situation.
3.3. Combination of These Two Hypothesis Tests. The hypoth-esis test method using the statistics of the arrangement of circular traces can improve the performance of the hypothesis test using the variance to some extent. Therefore, we propose the combination of these two methods for NLOS identification and mitigation.
The flowchart of the proposed combination method is
shown inFigure 5.
4. Performance Evaluation
In this section, we examine the performance of the proposed method by computer simulation.
We considern(n ≥ 3) reference nodes that are placed
randomly in a square area with side length 300 cm. Range estimates were simulated by adding range estimation errors and NLOS biases to the true distances. Because of the
different noise levels at different distances, we assume that
the variance of the LOS range estimatesσLOSiis proportional
to the distances with σLOSi being 2 cm if the distance is
zero and σLOSi being 3 cm if the distance is 425 cm (the
biggest possible LOS distance measured inside the area is the length of the diagonal). The random variable of NLOS bias is
modeled in different ways in literature, such as exponentially
distributed [16,22] and uniformly distributed [24]. In this
article, we model it as a uniformly distributed random variable ranging from 50 cm to 400 cm.
We compare the performance of the proposed method, the combination of hypothesis test methods (HC), with a number of other methods. One is the hypothesis test method
using the variance (HT) described inSection 3.1. The second
is the hypothesis test method using circular traces (CT) inSection 3.2. The third is the Residual weighting method
(RW) described in [16]. In addition, the AML method [11],
which is the best performing algorithm among some typical
location estimation algorithms compared in [12] but without
NLOS identification, is also included.
Location estimation errors have been obtained by aver-aging 1000 trials with randomly chosen node positions. The Root Mean Square Error (RMSE) of the location estimates is chosen as the performance criteria. It is defined as
RMSE=
true position and the location estimate in thejth trial within
a totality ofmtrials, respectively.
4.1. Performance Depending on the Number of LOS Nodes. For ease of illustration but without loss of generality, we suppose that there are eight reference nodes in the network. The performance of all methods was examined depending on the number of LOS nodes among these eight nodes.
From Figure 6, one can see that HC and HT methods perform better than AML and RW for all possible numbers of the LOS nodes. In case of more than three LOS nodes, the error is less than 3 cm. When the number of the LOS nodes is three, HT method and HC method achieve a location error of about 13 cm. This is caused by a higher possibility of wrong identification by using the proposed method when the number of the LOS node is less than three. If the number of LOS nodes is less than three, the error is bigger but the proposed method is still the best.
In addition, it is obvious that HC performs better than HT when the number of the LOS nodes is less than three. It proves that the CT method can improve the performance of the HT method in some case.
4.2. Performance Depending on the Total Number of Reference Nodes. In real sensor networks, however, we do not know the exact number of LOS reference nodes. Here we assume that there are at least three LOS nodes. The performance of all methods, with four to ten reference nodes, was examined.
Figure 7presents the simulation results. It is obvious that the proposed method HC acquires the best performance among the tested methods. For the given range inaccuracy, the HC gives a location estimation error of several centime-ters for all numbers of reference nodes.
Known reference nodes, range estimations and variance of the LOS range measurementsσLOS2
Location estimation by regarding nnodes as in LOS situation,
calculateM
M > σLOS2
n >3?
Location estimations for each combination with (n−1) nodes
CalculateM,ξ, andξfor each combination respectively
AnyMmeets M≤σLOS2?
Select the node to be NLOS node, whose corresponding combination meetsξ>ξand provides the
smallestM
Select the node to be NLOS node, whose corresponding combination meetsξ>ξ
and provides the smallestMamong the combinations that satisfiedM≤σLOS2
Discard the NOLS node from thenreference nodes,n=n−1
Location estimation with the left nodes
Result of the target node
Revise the range estimations by using the statistics of the arrangement of circular traces N
Y
N
Y
N
Y
0
Number of the LOS nodes inside 13.41
Figure6: Performance of the methods depending on the number of LOS reference nodes. The network consists of eight reference nodes. 1000 trials have been averaged.
0
Number of the reference nodes inside
2.82 6.17
Figure 7: Performance of the methods depending on the total number of reference nodes. The number of the LOS nodes is random but at least three. Simulation performed with 1000 trials.
4.3. Performance with Random Number of LOS Nodes Includ-ing the Situation of Less than Three Nodes. In dense multipath environment, the number of LOS nodes may be less than three. Here, we include this case in our simulations.
Results are presented inFigure 8. From the figure, we can
see that the HT and HC methods provide better performance than other methods. The HC method, a combination of the HT and the CT method, can further improve the performance of the HT method.
50
Number of the reference nodes inside AML
HT CT
RW HC
Figure8: Performance of the methods depending on the number of reference nodes. The number of the NLOS nodes is a random variable. 1000 trials have been averaged.
5. Conclusion
The NLOS problem is considered a killer issue in UWB localization. In this article, a comprehensive overview of the existing methods for localization in distributed UWB sensor networks under NLOS condition is given and a new method is proposed. The proposed method handles the NLOS prob-lem by NLOS node identification and mitigation approach through hypothesis test. It determines the NLOS nodes by comparing the mean square error of the range estimates with the variance of range estimates in LOS situation, and moreover, using the statistics of the arrangement of circular traces to further improve the performance in the situations that there are less than three LOS nodes available. Because the number of the iteration times is equal or less than the number of the NLOS nodes, this method is not too much computational intensive.
The performance comparison was performed by com-puter simulation. The simulation results imply that the pro-posed method acquires the highest performance among the tested methods, even within dense multipath environments where a high possibility exists that the number of LOS nodes is less than three. Moreover, the proposed method could also be applied to scenario with a moving target node.
Acknowlegments
References
[1] S. Gezici, Z. Tian, G. B. Giannakis, et al., “Localization via ultra-wideband radios: a look at positioning aspects of future sensor networks,”IEEE Signal Processing Magazine, vol. 22, no. 4, pp. 70–84, 2005.
[2] R. S. Thom¨a, O. Hirsch, J. Sachs, and R. Zetik, “UWB sensor networks for position location and imaging of objects and environments,” inProceedings of the 2nd European Conference on Antennas and Propagation (EuCAP ’07 ), pp. 11–16, Edinburgh, UK, November 2007.
[3] S. Gezici and H. V. Poor, “Position estimation via ultra-wide-band signals,”Proceedings of the IEEE, vol. 97, no. 2, pp. 386– 403, 2009.
[4] Z. Sahinoglu, S. Gezici, and I. Guvenc, Ultra-Wideband Positioning Systems: Theoretical Limits, Ranging Algorithms, and Protocols, Cambridge University Press, New York, NY, USA, 2008.
[5] S. Gezici, “A survey on wireless position estimation,”Wireless Personal Communications, vol. 44, no. 3, pp. 263–282, 2008. [6] J.-Y. Lee and R. A. Scholtz, “Ranging in a dense multipath
environment using an UWB radio link,” IEEE Journal on Selected Areas in Communications, vol. 20, no. 9, pp. 1677– 1683, 2002.
[7] A. Chehri, P. Fortier, and P.-M. Tardif, “On the TOA estimation for UWB ranging in complex confined area,” in
Proceedings of the International Symposium on Signals, Systems and Electronics (ISSSE ’07), pp. 533–536, Montr´eal, Canada, July-August 2007.
[8] I. Guvenc and Z. Sahinoglu, “Threshold-based TOA estima-tion for impulse radio UWB systems,” inProceedings of IEEE International Conference on Ultra-Wideband (ICU ’05), pp. 420–425, September 2005.
[9] K. Yu, J.-P. Montillet, A. Rabbachin, P. Cheong, and I. Opper-mann, “UWB location and tracking for wireless embedded networks,” Signal Processing, vol. 86, no. 9, pp. 2153–2171, 2006.
[10] W. H. Foy, “Position-location solutions by Taylor-series estimation,” IEEE Transactions on Aerospace and Electronic Systems, vol. 12, no. 2, pp. 187–194, 1976.
[11] Y.-T. Chan, H. Y. C. Hang, and P.-C. Ching, “Exact and approximate maximum likelihood localization algorithms,”
IEEE Transactions on Vehicular Technology, vol. 55, no. 1, pp. 10–16, 2006.
[12] G. Shen, R. Zetik, and R. S. Thom¨a, “Performance comparison of TOA and TDOA based location estimation algorithms in LOS environment,” in Proceedings of the 5th Workshop on Positioning, Navigation and Communication (WPNC ’08), pp. 71–78, Hannover, Germany, March 2008.
[13] G. Shen, R. Zetik, and R. S. Thom¨a, “Performance evaluation of range-based location estimation algorithms under LOS situation,” inProceedings of the German Microwave Conference (GeMiC ’08), Hamburg, Germany, March 2008.
[14] I. Guvenc, C.-C. Chong, and F. Watanabe, “Joint TOA estimation and localization technique for UWB sensor net-work applications,” inProceedings of the 65th IEEE Vehicular Technology Conference (VTC ’07), pp. 1574–1578, Dublin, Ireland, April 2007.
[15] J. Schroeder, S. Galler, K. Kyamakya, and K. Jobmann, “NLOS detection algorithms for ultra-wideband localization,” inProceedings of the 4th Workshop on Positioning, Navigation and Communication (WPNC ’07), pp. 159–166, Hannover, Germany, March 2007.
[16] P. C. Chen, “A non-line-of-sight error mitigation algorithm in location estimation,” inProceedings of IEEE Wireless Commu-nications and Networking Conference (WCNC ’99), vol. 1, pp. 316–320, New Orleans, La, USA, September 1999.
[17] E. Medina and M. N´ajar, “High resolution location in ultra wideband communications systems,” in Proceedings of the 2nd International Workshop Networking with Ultra Wide Band Workshop on Ultra Wide Band for Sensor Networks, pp. 40–44, Rome, Italy, July 2005.
[18] D. B. Jourdan, J. J. Deyst Jr., M. Z. Win, and N. Roy, “Monte Carlo localization in dense multipath environments using UWB ranging,” in Proceedings of IEEE International Conference on Ultra-Wideband (ICU ’05), pp. 314–319, Zurich, Switzerland, September 2005.
[19] I. G¨uvenc¸, C. Chong, F. Watanabe, and H. Inamura, “NLOS identification and weighted least squares localization for UWB systems using multipath channel statistics,”EURASIP Journal on Advances in Signal Processing, vol. 2008, Article ID 271984, 14 pages, 2008.
[20] M. P. Wylie and J. Holtzman, “The non-line of sight problem in mobile location estimation,” inProceedings of the 5th IEEE Conference on Universal Personal Communications (ICUPC ’96), vol. 2, pp. 827–831, Cambridge, Mass, USA, September-October 1996.
[21] J. Borras, P. Hatrack, and N. B. Mandayam, “Decision theoretic framework for NLOS identification,” inProceedings of the 48th IEEE Vehicular Technology Conference (VTC ’98), vol. 2, pp. 1583–1587, Ottawa, Canada, May 1998.
[22] Y.-T. Chan, W.-Y. Tsui, H.-C. So, and P.-C. Ching, “Time-of-arrival based localization under NLOS conditions,”IEEE Transactions on Vehicular Technology, vol. 55, no. 1, pp. 17–24, 2006.
[23] R. Chang and S.-W. Lu, “A geometrical position location method suitable for NLOS environment,”Journal of Electronics & Information Technology, vol. 29, no. 9, pp. 2212–2216, 2007. [24] S. Venkatesh and R. M. Buehrer, “A linear programming approach to NLOS error mitigation in sensor networks,” in