CSEIT16133 | Received: 05 Nov. 2016 | Accepted: 25 Nov. 2016 | November-December-2016 [(1)3: 11-18]
International Journal of Scientific Research in Computer Science, Engineering and Information Technology © 2016IJSRCSEIT | Volume 1 | Issue 3 | ISSN : 2456-3307
11
Feature Extraction and Classification for the Identification of
Different Cardiac Arrhythmias using Wavelet-SVM Methodology
Mayank Kumar Gautam
Department of Electrical Engineering, Rajkiya Engg College, Ambedkar Nagar, India
ABSTRACT
According to a recent report of world health organization (WHO), an estimated 17.5 million people died from CVDs (cardiovascular diseases) representing 30% of all global deaths (latest available data from website). Electrocardiogram (ECG) is the recording of the electrical activities of the heart and is used to diagnose various cardiovascular diseases. The real source of human calamity is Cardiac issues that are expanding step by step in world. To incredible exertion and analyze the cardiovascular disease, which numerous individuals are utilized diverse sort of portable electrocardiogram (ECG) in remote observing method. ECG Feature Extraction acting a critical part in diagnosing generally of the heart sicknesses. Presently complete inspected has been completely through for highlight extraction of ECG sign dissecting, highlight extricating and taking after that characterizing it have been arranged amid the long-prior time, and here we presented delicate processing procedures. To perceive the current circumstance of the heart Electrocardiography and is a fundamental device however it is a period expending procedure to break down a persistent ECG signal as it might hold a huge number of relentless heart pulsates. As of right now we, change over simple sign to computerized one and after that switch of it, it helps in precisely diagnosing the sign. Point of this paper is to show an identification of some warmth arrhythmias utilizing emerging Wavelet-SVM methodology.
Keywords : ECG, SVM, Wavelet Transform, Feature Extraction and Classification
I.
INTRODUCTION
The electrocardiogram (ECG) is routinely utilized as a part of clinical practice, which portrays the electrical activity of the heart. In physical checkups at healing centers, doctors record the ECG after the patient has practiced to check his/her cardiovascular condition. The Holter ECG recorder is utilized most oftentimes to record the ECG. Doctors apply the gadget to a patient when they have to screen his/her ECG to locate the couple of unusual cycles in the ECG for the duration of the day. Doctors then decipher the states of those waves and buildings. They figure parameters to figure out if the ECG hints at heart malady or not. The parameters are the stature and the interval of every wave, for example, RR interval, PP interval, QT interval, and ST segment. Acknowledgment of the fiducial focuses and counts of the parameters is a dreary routine for the doctor. In this way, there is an
week of ECG action might should be recorded utilizing a Holter ECG screen to effectively catch them. Numerous arrhythmias show as groupings of heartbeats with abnormal timing or ECG morphology. An imperative stride toward recognizing an arrhythmia is the arrangement of heartbeats. The mood of the ECG sign can then be controlled by knowing the arrangement of back to back heartbeats in the sign [6]. Order of heartbeats can be exceptionally tedious and henceforth any computerized handling of the ECG that helps this procedure would be of help and is the center of this study.
Robotized characterization of heartbeats has been beforehand reported by different agents (e.g., [7]–[12]) utilizing an assortment of elements to speak to the ECG and various arrangement strategies. Highlights incorporate ECG morphology [8], [9], pulse interim elements [8]–[11], recurrence based components [7], higher request cumulant highlights [10], Karhunen– Loeve development of ECG morphology [11], and hermite polynomials [12]. Classifiers strategies utilized incorporate straight discriminants [7], back spread neural systems [8]–[10], self-sorting out maps with learning vector quantization [11], and self-arranging systems [12].
In spite of gauges prescribed for reporting execution aftereffects of cardiovascular musicality calculations by the Association for the Advancement of Medical Instrumentation (AAMI) [13], [14], just the work in [11] and [12] have used these models. This makes it exceptionally hard to evaluate the relative benefits of the distinctive calculations. The AAMI principles are embraced in this study and our outcomes have been contrasted with those of [11] and [12].
In [11], Hu et al. tweaked a pulse classifier to a particular patient (known as a nearby classifier) and afterward joined it with a worldwide classifier composed from a huge database of ECG signs. The two classifiers were then joined utilizing a blend of specialists (MOE) approach. The nearby classifier requires a cardiologist to clarify a fragment of a patient-particular ECG keeping in mind the end goal to execute the MOE approach. The worldwide classifier accomplished an exactness of 62.2% and the MOE classifier accomplishing 94.0% precision for recognizing ventricular ectopic beats (VEB) from non-VEBs. specialist can effectively distinguish the prevailing beat of a bunch.
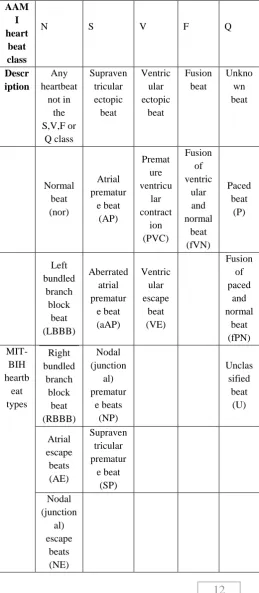
The AAMI prescribed practice was utilized to consolidate the MIT-BIH pulse sorts into five pulse classes which were utilized as a part of all resulting handling. Every class incorporates heartbeats of one or more sorts as appeared in Table 1. Class N contains beats beginning in the sinus hub (typical and group branch piece beat sorts), class S contains supraventricular ectopic beats (SVEBs), class V contain ventricular ectopic beats (VEBs), class F contains beats that outcome from intertwining typical what's more, VEBs, and class Q contains obscure beats including paced beats.
Database Used
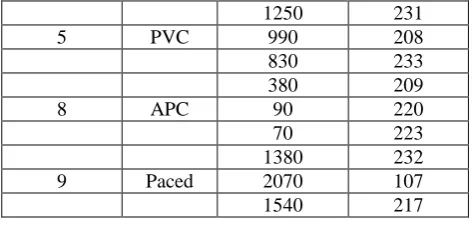
All ECG information is acquired from MIT-BIH arrhythmia database that contains records of numerous patients with heart inconveniences or variations from the norm. The recurrence of the ECG information was 360HZ. Every record has its separate explanation document that shows the class of the pulse. A solitary channel ECG is gathered and used to calculation assessment. Since there is couple of classes of unusual QRS buildings in one record, we select diverse strange QRS edifices from a few records. Six sorts of QRS buildings showed up every now and again in the database. Along these lines, we for the most part manage six sorts heartbeats which incorporate typical beat(NORMAL), left package branch square beat(LBBB), right package branch piece beat(RBBB), paced beat(PACE), untimely ventricular contraction(PVC) and atrial untimely contraction(APC). In the information preprocessing process, nonstop ECG signals must be isolated into numerous fragments which contain one pulse. Table 2. shows the different beats belonging to different MIT-BIH files used in the study.
Table 2: Samples of ECG used for training and
testing.
Methodology for feature extraction and classification
Figure 1. Structure of purposed ECG signal processing approach.
Pre-processing of Signal
ECG signal intrinsically contains of different kind of undesirable noise and artifacts impacts like baseline drift, noise f the electrode contact, polarization noise, the inward speaker noise, noise because of movement of the muscles, and motor artifacts. The movement of electrodes instigated artifacts noise. Along these lines in order to make original ECG signal prepared for feature extraction step, we should evacuate baseline wander and take out above noise.
We propose to utilize wavelet filtering to filter the ECG signal since this method is suitable for processing the R-peak areas without change of the shape or position of the original signal. As per the past exploratory information, with an aim to upgrade the signal to be separating, we should consider these two criteria: sampling frequency of the signal and the learning that a large portion of the noises are situated outside of the frequency interval between 1.5 Hz to 50 Hz [13]. For this reason, we utilize a band pass filter (BPF) Equations which is being developed by a high pass filter (HPF) with cutoff frequency of 1.5 Hz. This filter disposes of benchmark varieties. The yield of this channel is course with a LPF with cutoff frequency of 50 Hz. This channel evacuates noises of high frequency.
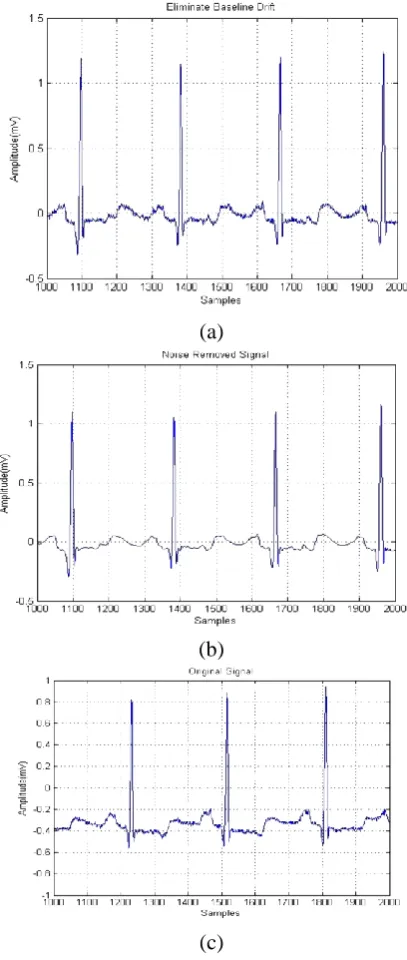
The scale and sort of the mother function parameters are particular to every filter. Along these lines, the programmed figure of ideal scale for high pass sifting when the examining frequency is 256 is equivalent to request 6. The ideal scale request for the low pass filtering is equivalent to order 2. The consequences of above steps are being appeared in the following ECG record Figure 2.
(a)
(b)
(c)
Figure 2. Preprocessing results taken on record 100.dat from MIT-BIH cardiac arrhythmia database (a) original signal, (b) baseline elimination, (c) removal of noise
B. QRS Detection
Every ECG cycle is basically comprised of a P-wave which is been compared to the atrial depolarization phase of ECG cycle, a QRS complex which is being related to the ventricular depolarization phase of ECG cycle and a T wave which is point to the fast repolarization of the ventricles. A typical ECG signal and its time intervals are appeared in Figure 3.
estimation of the signal sufficiency. For instance, the Q-T highlight is utilized to acknowledgment one risky ailment, the Long Q-T Syndrome (LQTS), which is capable of thousand passings every year [14]. The state of T wave is a basic component and it is key to distinguish it effectively since reversed T waves can be brought on as an impact of a genuine infection named coronary ischemia [15].Designing a calculation in order to extricate the features of ECG naturally is hard since ECG signal has a period variation conduct. As an aftereffect of these signal properties, we confront with various physiological limitations and the presence of noise.
Lately a few calculations have been proposed for discovery those features. In [16] they acquainted a technique with concentrate wavelet features and utilized SVM for order. In their purposed strategy, the order is done without totally distinguish ECG parts. Castro et al. presented a technique that utilized wavelet based features and characterize different type of irregular heartbeats [17]. Tadejko and Rakowski proposed a calculation which depends on computational morphology [18]. Their fundamental objective is the evaluation of different programmed classifiers for location of confusion in the ECG. In [18] they proposed a strategy to concentrate highlight from ECG in view of a multi determination wavelet transform. To start with, they expel commotion from ECG signal by tossing the coefficient which brought on noise. In next step, they identify QRS buildings and by utilizing them the begin and end of every wave part is resolved. They survey proposed strategy on a few records taken in the account from MIT-BIH Cardiac Arrhythmia Database of ECG records.
We have proposed a strategy for acknowledgment of time interval and sufficiency of different wave parts of ECG in the current thesis for the evaluation of peaks. In the First phase of our methodology, the R-peak is recognizing precisely. For this reason we utilized wavelet. In the second stage, the other ECG parts are recognized by utilizing a neighborhood seeks around the distinguished R-peak. We can abridge this methodology:
The area of the R-wave has been recognized by utilizing wavelet transform.
C. R-Peaks Detection
The discovery of R-peak is the initial step of feature extraction. For this reason, we utilized DWT because of its capacity to perceive distinctive areas of the waves precisely. So also to the preprocessing, we apply the same strides in order to fig the scale as well as the pickup the mother capacity. We have the QRS complex sign as a data which has the frequencies somewhere around 5Hz and 15Hz, so we select size of request 4 and pick the Db4 mother wavelet. The Db4 wavelet is exceptionally prominent for the discovery and area of R peaks because of the solid likeness of its shape to the ECG signal. Our technique is sorted out in the accompanying steps. By performing wavelet decomposition, we down examining the information. Thus, the measure of pointless data is decreased however the segment of QRS is not changed.
In order to evaluate the focused area of renowned R wave peak, firstly we pick the areas which their sufficiency is more noteworthy than 60% of the maximum estimation of the entire data signal. Since, we expel the commotion from the sign in the past step; it is helpful for R-peak identification.
Since we break down the sign into fourth level, the R-peak area in the adjusted sign is no less than 0.25 of the R-peak area in the original signal. So as to locate the real area of R-wave we should change over the established positions by duplicating them with 4. Another vital point is that R-peak area in changed sign is not precisely on the original signal at a size of 4. Position of the sign will change amid the down examining, so we should to do neighbourhoods seek around the R-peak which computed in past part. The interval of this pursuit can be restricted to a window of ± 20 samples.
D. T Wave Detection
T-wave Onset detection
Another critical point in analyzing the ECG signal is the begin purpose of T-wave or Ton since it is utilized as a bolster (support) point for deciding the extremity of T which can be positive, negative or leveled (flat). Presence of negative or level T waves in ECG demonstrates a genuine illness, the heart ischemia. The looking area is beginning from the S-wave in addition to little balance till T-wave and Ton is a point with min value in this interval.
T-wave end detection
Identification of end purpose of T-wave, Toff, is another troublesome errand in this area since there is still discourse between experts about it. The best properties for distinguish Toff is finding the point which has the most minimal amplitude after T inside of a constrained extent. For this reason, it is important to make the signal smooth. We can do it by including past estimations of the sign to it. In the event that a point in abundance is bigger than the amplitude’s of all the past 3 samples, it can be think about as a Toff point.
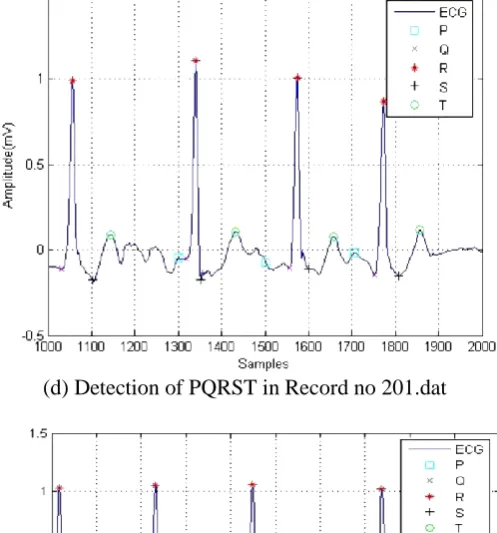
Table 3 condenses the search intervals used to discover ECG segments. It demonstrates the records of the begin and the end scopes of the search [19]. The aftereffects of usage of PQRS discovery calculation for some ECG records from MIT-BIH database are appeared in Figure 4
(a) Detection of PQRST in Record no 100.dat
(b) Detection of PQRST in Record no 111.dat
(d) Detection of PQRST in Record no 201.dat
(d) Detection of PQRST in Record no 210.dat
(e) Detection of PQRST in Record no 220.dat
Figure 3. Detection results of PQRST in (a) record 100.dat, (b) record 111.dat, (c) record 118.dat, (d) record 201.dat, (e) record 210.dat, (f) record 220.dat taken in account from MIT-BIH arrhythmia database of ECG records.
III.
RESULTS AND DISCUSSION
Calculation of Accuacy
Table 4. Detection of Accuracy for Different Type of Arrhythmia on MIT-BIH Arrhythmia Database
Types of Arrhythmias
Model Accuracy
N 94.16% APB 99.04% LBBB 98.50% RBBB 92.33% PVC 99.97% Fusion of V and N 99.51% PB (Paced Beat) 99.63% Average 97.59%
As we talked about some time recently, different specialists utilized different sort of techniques for ECG characterization, for example, Combining KNN and DWT [15], MLP and VQ [16] and SOM with SVD [18]. Their framework execution is appeared in Table 5. As should be obvious, there are numerous elements and reasons cause the examination between our own framework results and theirs off base. For instance the quantity of chose arrhythmia by every scientist is differed to the others, likewise the chose records or even the quantity of removed beat from a particular record for preparing and testing are not specified unmistakably. In any case our framework results are tantamount with the others [19] [20] [21].
Table 5. Comparisons of Different Methods and Proposed Method for ECG Classification
Method No. of beat type Accuracy (%)
KNN-DWT Method 4 beat type 96.65%
Neuro-Fuzzy
Method 4 beat type 98%
MLP-VQ Method 2 beat type 96.80%
SOM-SVD Method 3 beat type 92.20%
Wavelet-SVM Method
(Proposed Method)
7 beat type 97.59%
IV.CONCLUSION
study, which are the estimations of vitality, greatest, least, mean and standard deviation of level 4 DWT detail coefficients. The outcomes show that by utilizing DWT and SVM, the characterization of Normal, LBBB, RBBB, APC, PVC, Paced Beats etc can be classified; consequently the essential objective of this study is accomplished. The simulation results about demonstrate that the class of coronary illness is all around predicted utilizing DWT and SVM system and the system functioning admirably since it accomplish the 97.59% of arrangement accuracy rate. This result demonstrates that it has some potential and had been observed to be effective in cardiac disease diagnosis.
V.
ACKNOWLEDGMENT
This work is supported by University Grant Commission (UGC), New Delhi, India under Major Research Project (MRP) scheme. This work has been carried out in the Department of Electrical Engineering at MMM University of Technology, Gorakhpur, India.
VI.REFERENCES
[1] M. S. Thaler, The Only EKG Book You’ll Ever Need, 3rd ed. Philadelphia, PA: Lippincott Williams & Wilkins, 1999.
[2] K. Minami, H. Nakajima, and T. Toyoshima, "Real-time discrimination of ventricular tachyarrhythmia with Fourier-transform neural network," IEEE Trans. Biomed. Eng., vol. 46, pp. 179–185, Feb. 1999.
[3] S. Evans, H. Hastings, and M. Bodenheimer, "Differentiation of beats of ventricular and sinus origin using a self-training neural network," PACE, vol. 17, pp. 611–626, 1994.
[4] R. Clayton, A. Murray, and R. Campbell, "Recognition of ventricular fibrillation using neural networks," Med. Biol. Eng. Comput., vol. 32, pp. 217–220, 1994.
[5] S. Barro, R. Ruiz, D. Cabello, and J. Mira, "Algorithmic sequential decision- making in the frequency domain for life threatening ventricular arrhythmias and imitative artefacts: A diagnostic system," J. Biomed. Eng., vol. 11, pp. 320–328, 1989.
[6] J. A. Kastor, Arrhythmias, 2nd ed. London, U.K.: W.B. Saunders, 1994.
[7] L. Senhadji, G. Carrault, J. J. Bellanger, and G. Passariello, "Comparing wavelet transforms for recognizing cardiac patterns," IEEE Eng. Med. Biol. Mag., vol. 14, pp. 167–173, Mar.–Apr. 1995.
[8] T. H. Yeap, F. Johnson, and M. Rachniowski, "ECG beat classification by a neural network," in Proc. Annu. Int. Conf. IEEE Engineering Medicine and Biology Soc., 1990, pp. 1457–1458.
[9] Y. H. Hu,W. J. Tompkins, J. L. Urrusti, and V. X. Afonso, "Applications of artificial neural networks for ECG signal detection and classification," J. Electrocardiol., vol. 26, pp. 66–73, 1993.
[10]S. Osowski and T. L. Linh, "ECG beat recognition using fuzzy hybrid neural network," IEEE Trans. Biomed. Eng., vol. 48, pp. 1265–1271, Nov. 2001.
[11]Y. H. Hu, S. Palreddy, and W. J. Tompkins, "A patient-adaptable ECG beat classifier using a mixture of experts approach," IEEE Trans. Biomed. Eng., vol. 44, pp. 891– 900, Sept. 1997.
[12]M. Lagerholm, C. Peterson, G. Braccini, L. Edenbrandt, and L. Sornmo, "Clustering ECG complexes using hermite functions and self-organizing maps," IEEE Trans. Biomed. Eng., vol. 47, pp. 838–848, July 2000. [13]Gokhale, P. S., "ECG Signal De-noising using Discrete
Wavelet Transform for removal of 50Hz PLI noise", International Journal of Emerging Technology and Advanced Engineering, Vol. 2, pp. 81-85, 2012.
[14]Thakor, N. V., Zhu, Y. S, & Pan, K. Y., "Ventricular tachycardia and fibrillation detection by a sequential hypothesis testing algorithm", IEEE Transactions on Biomedical Engineering ,Vol. 37, p. 837-843, 1990. [15]Al Qawasmi, A. R., & Daqrouq, K., "ECG Signal
Enhancement Using Wavelet Transform", WSEAS Trans on Biology and Biomedecine, Vol. 7, pp. 62-72, 2010.
[16]Gautam, R., & Sharmar, A., "Detection of QRS complexes of ECG recording based on Wavelet Transform using MATLAB", International Journal of Engineering Science and Technology, Vol. 2, pp. 3038-3044, 2010.
[17]Sumathi, S., & Sanavullah, M. Y., "Comparative Study of QRS Complex Detection in ECG Based on Discrete Wavelet", International Journal of Recent Trends in Engineering, Vol. 2, pp. 273-277, 2009.
[18]Priyadarshini, B., Ranjan, R. K., & Rajeev A., "Determining ECG characteristics using wavelet transforms", International Journal of Engineering Research & Technology (IJERT), Vol. 1, 2012.
[19]Sasikala, P., & Wahidabanu, R., "Robust R Peak and QRS detection in Electrocardiogram using Wavelet Transform", (IJACSA) International Journal of Advanced Computer Science and Applications, Vol. 1, No.6, 2010.
[20]Senhadji, L., Carrault, G., Bellanger, J. J., & Passariello, G., "Comparing wavelet transforms for recognizing cardiac patterns", IEEE Engineering in Medicine and Biology Magazine, vol. 14, p. 167-173, 1995.
![Table 3 condenses the search intervals used to discover ECG segments. It demonstrates the records of the begin and the end scopes of the search [19]](https://thumb-us.123doks.com/thumbv2/123dok_us/1012429.1125445/6.595.301.550.49.245/table-condenses-search-intervals-discover-segments-demonstrates-records.webp)