Brain Tumour Detection and Classification on
Neural Network Classifier Using Random
Decision Forest
Sujitha G
1, Mohana Sundari L
2, Prasath T
3PG Scholar, Dept. of ECE, Kingston Engineering College, Vellore, Tamil Nadu, India1
Assistant Professor, Dept. of ECE, Kingston Engineering College, Vellore, Tamil Nadu, India2
Assistant Professor, Dept. of ECE, Kingston Engineering College, Vellore, Tamil Nadu, India 3
ABSTRACT: Brain tumour detection is a challenging problem, due to the structure of the tumour cells. Magnetic
Resonance Imaging (MRI) has a considerable role in tumour scrutiny. A fully automatic segmentation method based on K-Means clustering algorithm, for segmenting Magnetic Resonance Images and to detect the brain tumour in initial stages has been proposed here. The Random Decision Forest (RDF) is used to detect the tumour part from the brain. Morphological filter is used to reduce grayscale deviations in images, which desirably reduce noise in an image for subsequent processing. Clustering is used to segment the tumour part detected by the RDF.
KEYWORDS:Magnetic Resonance Imaging (MRI), K-means clustering algorithm, Random Decision Forest (RDF),
Morphological filter, Brain tumour
I.INTRODUCTION
Tumours are groups of aberrant cells that form lumps or growths, different types of tumours grow and behave differently. The malignant tumours that emerge from the glial cells of the nervous system are called Glioma. These cells support the structure of the central nervous system. Glioma is classified into 4 grades [1]. According to the World Health Organization (WHO), grade I and II are called Low Grade Glioma and grade III and IV are called High Grade Glioma.
Glioblastomas Multiform (GBM) are usually malignant (cancerous) and has high mortality rate [2]. The active cells region is very important for segmentation, but gliomas are highly variable in shape and size which makes it complex to detect. GBM is considerably a very aggressive cancer and due to its invasion nature cannot be completely removed by surgery.
Many automatic segmentation methods have arrived, they help in diagnosis, radiotherapy and surgery planning. MRI plays an important role in providing the information to demarcate brain tumour tissues[3]. MRI has the ability to provide a multi-spectral analysis of brain, this makes MRI most required to analyze brain tissues[4]. The existent method for brain tumour detection and segmentation are manual segmentation, thresholding, and learning methods. Learning methods can be broadly classified into supervised and unsupervised learning methods.
The existing supervised and unsupervised learning methods and classifiers are Support Vector Machine (SVM) [5], Markov Random Field (MRF) [6], and fuzzy clustering. However the brain atlas does not confine tumour regions. The manual analysis of the tumour is time consuming and requires highly trained persons to avoid diagnosis errors. Thus a novel automatic segmentation approach based on Random Decision Forest [7] and K-means clustering algorithm is proposed. RDF is a fully automatic machine learning method. It compares the test images with training data and provides accurate tumour detection. Intensity normalization [8], [9] and Bias field correction [10] are used along with these methods.
II. RELATED WORK
Grade Glioma (grade III and IV). In [3] authors used Magnetic Resonance technique for understanding the structure of brain tumour, MRI plays an important role in tumour detection and analysis of the tumour structure. In [5] authors used a learning method, Support Vector Machine (SVM) for automatic detection of brain tumour. The classification was done on the basis of five criteria: region, contour, shape, structural approaches and graph theory. It provided good results in tumour detection, however glioma vary highly with shape and size. In [6] authors used a new learning method for the detection of brain tumour using Markov Random Field (MRF), this method concentrates on the shape and size of the glioma tumour part. The tumour part is detected and separated from the brain. In [8], [9] authors have given the detail about the Intensity Normalization of MR image. Due to the conversion of MR image some noises will be present in the image this will vary the intensity of the image, thus Intensity Normalization is used to correct this variation from the input image. This variation may lead to some errors in the detection of the tumour part. Intensity value of the pixels in the image is corrected by Intensity Normalization, which helps to detect the tumour part without any error.
III. SYSTEM MODEL
A.PREPROCESSING STAGE
In pre-processing stage, the input image is gathered from the patients MRI scan and it is converted to gray scale image, then the image is scaled. During this conversion of MRI scan to gray scale image, some noise will be present in the image being converted.
The noise present in the image will change the intensity value which may lead to miscalculation of tumour part. Here the Median filter is used to remove noise from the image. This median filter replaces the pixel value with the intermediary of the gray values in the region of the pixel. This also corrects the bias field of the image given as input.
B.INTENSITY NORMALIZATION
The filtering process leads to intensity variations. Thus intensity normalization method is used to precise the intensity range of the image. The range of the pixels intensity values is diversified by a process labelled as normalization. Normalization is consequently called as contrast stretching or histogram stretching.
Thus the intensity of the input image is adjusted by intensity normalization. The mean value of the image is obtained after the intensity normalization process.
Figure.1 Mean value of the image
Figure 1 shows the mean value of the input image gathered from the patients. The values are obtained after feature extraction.
C.RANDOM DECISION FOREST
Random forest are an en masse of decision trees, each one with a different subset of the training data. The RDF is used to classify the volume of pixels (voxels) in the brain. This classifier is a supervised one, which means it must be trained before classification. The RDF trees are all randomly disparate. The forests of trees splitting with oblique hyper planes, if randomly restricted to be sensitive to only selected feature dimensions, can gain accuracy as they grow without suffering from overtraining.
The training data is placed in the trees roots and as it passes along each internal node. Each test point is trained independently and pushed towards all the trees, there is some randomness during the training, making each tree unique and improving generalization of unseen data.
The two main advantages of RDF are the capability to deal with different features, even if they are redundant, and the possibility to be used in multi label classification. This method is suitable as glioma is highly variable in shape and appearance.
Here the training data is the tumour images obtained and stored from different patients. The intensity normalized image is given to the training dataset in order to compare them. Once the juxtaposition is done the image is given to RDF to detect whether tumour is present in the given input image or not.
(ii) Random Decision Forest(RDF)
The Random Decision Forest detects the compared images and decides whether the image given as input has tumour or not. The input MRI scan is compared with the training data and the tumour part is detected. The training data is a normal brain image and tumour is a collection (or mass) of abnormal cells in the brain.
It is easy to detect the tumour part
.
RDF decides the result and indicates them. As it is a supervised learning method it provides accurate results in the detection of brain tumour part especially glioma tumour.D.MORPHOLOGICAL FILTERING
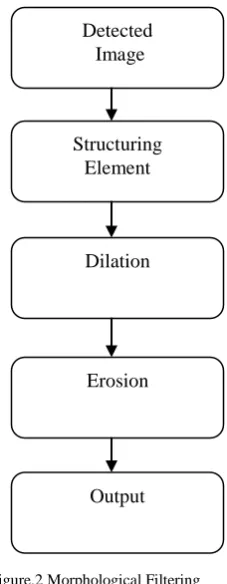
Morphological filtering is enforced on segmented image for smoothening the image. It is a collection of non-linear operations related to the shape or morphology of features in a image, such as frontier, skeletons etc. Dilation and erosion are the two important morphological operations. Often combinations of these operations are used to perform morphological image analysis.
Dilation: It is the process of summating pixels to the object boundary. Erosion: It is the process of subtracting pixels from the object boundary.
Figure.2 Morphological Filtering
Figure 2 shows the Morphological operation dilation and erosion to the input image.
This may be desirable in order to reduce noise or simplify grayscale variation in an image for subsequent Detected
Image
Output Structuring
Element
Dilation
E. K- MEANS CLUSTERING
The technique used for grouping data objects into different groups is Clustering, such that analogous objects belong to the same group and non analogous data objects belong to different clusters group. K-means clustering, it is the simplest unsupervised learning method used to solve the well known clustering problem. The input data points are classified into various classes based on their intrinsic distance from other dataset points of this cluster. It assumes that the data lineaments from a vector space and tries to find natural clustering.
Clustering is used to segment the tumour detected by the RDF. The detected tumour part is given as a input to K-means clustering, this method segments the image in the form of clusters, the similar and dissimilar clusters are grouped together. It segments the tumour part, as tumour is a group of abnormal tissues and congregates together as a single group. Finally the tumour part is segmented and displayed separately. This provides fast and accurate results for glioma tumour.
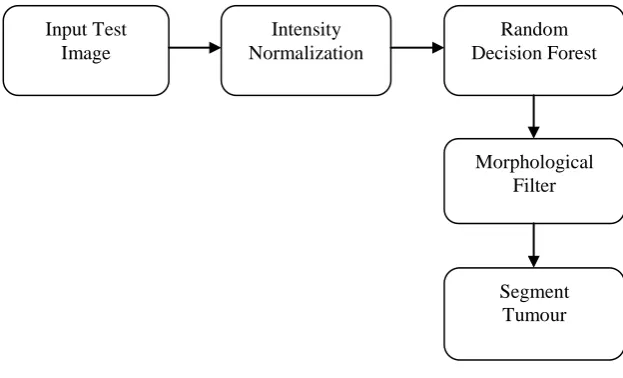
Figure.3 Block diagram of Segmentation process
Figure 3 represents the block diagram of the proposed method. The input image is obtained and processed as shown above, detection and segmentation has been carried out by Random Decision Forest and K-Means clustering algorithm.
IV. SIMULATION RESULT
The given input image is detected using Random Decision Forest and segmented using K-means clustering. The input image is obtained from patients MRI Scan, MRI scan is converted into grayscale image. During the conversion some noises will be introduced into the image. Thus the noises are removed using Median filter. Then the intensity is adjusted using Intensity Normalization. Random Decision Forest is used to detect the tumour part from the brain. Then the Morphological Filter is used to add or subtract the pixels from the image. Finally the K-Means Clustering is used to segment the detected tumour part. The outputs are obtained as shown below.
Input Test Image
Intensity Normalization
Random Decision Forest
Morphological Filter
Figure.4 Detection of normal brain images (without tumour)
Figure 4 represents the normal brain images (without tumour) which are obtained from MRI where the noises are removed using RDF detect tumour. As it is normal brain image no tumour part is detected.
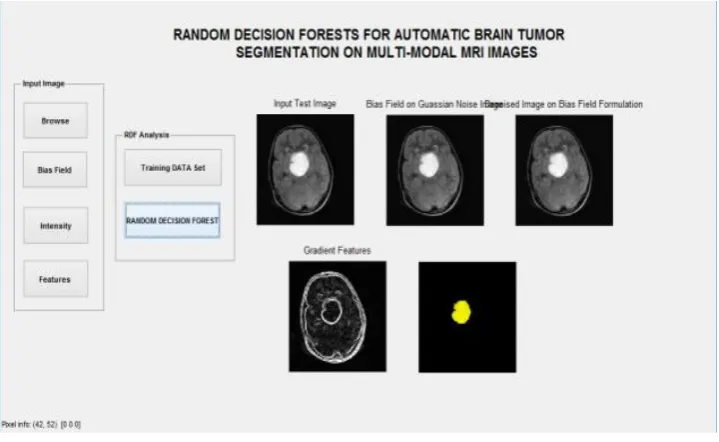
Figure.5 Detection of tumour from given input image
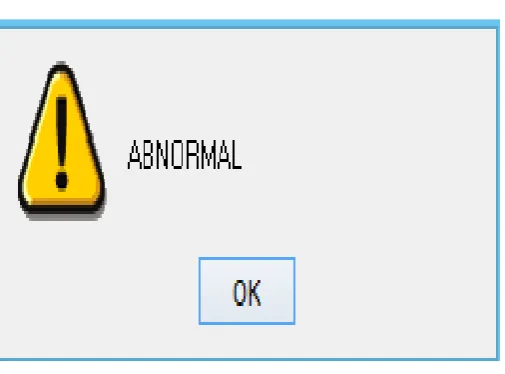
Figure.6 Warning that the given input image is abnormal
Figure 6 depicts that the given input image is abnormal indicating that the image is diagnosed with tumour.
Figure.7 segmenting the tumour using K-means clustering
Figure 7 shows the segmentation of tumour using K-means clustering, the tumour part is segmented separately as shown.
V.CONCLUSION & FUTURE WORK
tumour part separately, accurate result is obtained as shown in the output. The disease part is segmented precisely. By implementing Dual Tree Complex Wavelet Transform high segmentation accuracy can be achieved in future.
REFERENCES
1. V. Narayanan, “High grade gliomas: Pathogenesis, management”, Neurosurgery, 2012.
2. J.G. Smirniotopoulos, “The new WHO classification of brain tumours ”, Neuro imaging Clinics of North America, vol. 9, no. 4, pp. 595-613, 1999.
3. D. Miller et al., “The role of magnetic resonance techniques in understanding and managing multiple sclerosis”, Brain, vol. 121, no. 1, pp. 3-24, 1998.
4. W. R. Hendee and E. R. Ritenour, “Medical imaging physics”, John Wiley & Sons, 2003.
5. Raouia Ayachi and Nahla Ben Amor, “Brain Tumour Segmentation Using Support Vector Machines”, ECSQARU 2009, LNAI 5590, pp. 736-747, 2009. Springer-Verlag Berlin HeidelBerg 2009.
6. S. Bauer and M. Reyes, “A markov random field-based biomechanical tumour growth model for atlas-based segmentation of brain tumour images”, This volume is dedicated to cancer patients, p. 76, 2010.
7. Adriano Pinto, S’ergio Pereira, Hugo Dinis and Carlos A. Silva and Deolinda M. L. D. Rasterio, “Random Decision Forest for automatic brain tumour segmentation on multi-modal images”, 2015 IEEE 4th Portuguese Bioengineering Meeting Porto, Portugal, 26-28 February 2015.
8. L. G. Nyu and J. K. Udupa, “On standardizing the MR Image intensity scale”, image, vol. 1081, 1999.
9. L. G. Ny’ul, J. K. Udupa, and X. Zhang, “New variants of a method of MRI scale standardization”, Medical Imaging, IEEE Transactions on, vol. 19, no. 2, pp. 143-150, 2000.
10. N. Tustison and J. Gee, “N4itk: Nicks n3 itk implementation for MRI bias field correction”, Insight Journal, 2009.
11. K. S. Angel Viji and Dr. J. Rajakumari, “Automatic detection of brain tumour based on Magnetic Resonance Image using CAD system with watershed segmentation”, International Conference on Signal Processing, Communication, Computing and Networking Technologies (ICSCCN), IEEE 2011.
BIOGRAPHY
Sujitha G pursuing Master of Engineering (ME) in the Electronics and Communication Department, Kingston
Engineering College, Anna University. She received Bachelor of Engineering (BE) degree in 2013 from Anna University, Chennai, India.
Mohana Sundari L ME, is an Assistant Professor in the Department of Electronics and Communication, Kingston
Engineering College, Vellore, Tamil Nadu, India. She received her BE (ECE) from University of Madras in 2003 and she received her ME from Anna University in 2009.
Prasath T ME, is an Assistant Professor in the Department of Electronics and Communication, Kingston Engineering