Volume 4, No. 10, Sep-Oct 2013
International Journal of Advanced Research in Computer Science
RESEARCH PAPER
Available Online at www.ijarcs.info
ISSN No. 0976-5697
Study of K-Means and Enhanced K-Means Clustering Algorithm
Dr. S.P.Singh
Assistant Professor BITs, Mesra( Noida campus)Ghaziabad(U.P.) , India
Abstract: Data clustering is a process of arranging data into groups or a technique for classifying a mountain of information into some manageable meaningful piles. The goal of clustering is to partitions a dataset into several groups such that the similarity within a group is better than among groups. K- means is one of the basic clustering algorithm which is commonly used in several applications, but it is computationally time consuming and the quality of the resulting clusters heavily depends on the selection of initial centroids.We can removed first limitation using the Enhanced K- Means algorithm. This paper represent the comparison analysis of basic K-Means clustering algorithm and Enhanced K- Means clustering algorithm which shows Enhanced K-Means algorithm more effective and efficient than Basic K-means algorithm.
Keywords: Basic K-Means clustering, Clustering, computational time complexity, centroids, Enhanced K-Means algorithm.
I. INTRODUCTION
Data mining is the process of automatically finding useful information in large data repositories .The purpose of deploying data mining techniques[1] is discovering important patterns from datasets and also provide capabilities to predict the outcome of a future observation.
Clustering [2] is a division of data into groups of similar objects. Representing the data by fewer clusters necessarily loses certain fine details, but achieves simplification. It models data by its clusters. Data modeling puts clustering in a historical perspective rooted in mathematics, statistics, and numerical analysis. From a machine learning perspective clusters correspond to hidden patterns, the search for clusters is unsupervised learning, and the resulting system represents a data concept. K-means clustering[3] as the most intuitive and popular clustering algorithm, iteratively is partitioning a dataset into K groups in the vicinity of its initialization such that an objective function defined in terms of the total within-group sum-of-squares is minimized. However, there exists several flaws; not only regarding the sensitivity of the algorithm to initialization and number of iterations in the loop, the algorithm’s success in finding globally optimal partitions depends on its starting values. Several different initialization results have been proposed for the K-means algorithm and can be easily trapped at a local minimum regarding to the measurement (the sum of squared errors) used in the model.
II. THE K-MEANS ALGORITHM
The term "k-means" was first used by James MacQueen in 1967 , though the idea goes back to 1957.According to him:
“The process, which is called “k-means”, appears to give partitions which are reasonably efficient in the sense of within-class variance, corroborated to some extend by mathematical analysis and practical experience. Also, the k-means procedure is easily programmed and is computationally economical, so that it is feasible to process very large samples on a digital computer.”
And the other is Likewise idea which summarized in introduction part of his work benefits of using K-means:
“K-means algorithm is one of first which a data analyst will use to investigate a new data set because it is algorithmically simple, relatively robust and gives “good enough” answers over a wide variety of data sets.”
The K-means algorithm[4] is the most commonly used partitional clustering algorithm because it can be easily implemented and is the most efficient one in terms of the execution time. The major problem with this algorithm is that it is sensitive to the selection of the initial partition and may converge to local optima.We assume we have some data point, D=(X1… Xn), first choose from this data points, K initial centroid, where k is user-parameter, the number of clusters desired. Each point is then assigned to nearest centroid. For many, we want to identify group of data points and assign each point to one group. The idea is to choose random cluster centres, one for each cluster. The centroid of each cluster is then updated based on means of each group which assign as a new centroid. We repeat assignment and updated centroid until no point changes, means no point don’t navigate from each cluster to another or equivalently, each centroid remain the same.
A. Algorithm 1 : Basic K-Mean Clustering[5]:
a. Choose k points as initial centroid b. Repeat
c. Assign each point to the closest cluster centre, d. Recompute the cluster centres of each cluster, e. Until convergence criterion is met.
B. Limitations of K-Means[6][7]:
a. It is computationally expensive and requires time proportional to the product of the number of data items, number of clusters and the number of iterations.
b. The quality of the resulting clusters heavily depends on the selection of initial centroids which causes it to converge at local optimum.
III. RELATED WORK AN EFFICIENT ENHANCED K-MEANS CLUSTERING
ALGORITHM[8]
The aim of following approach makes that K-means algorithm more effective and efficient by removing the first limitation i.e. it limits the number of computations to some extent. This algorithm is easy to implement, requiring a simple data structure to keep some information in each iteration to be used in the next iteration. The idea makes k-means more efficient, especially for dataset containing large number of clusters. Since, in each iteration, the k-means algorithm computes the distances between data point and all centers, this is computationally very expensive especially for huge datasets. Therefore, we do can used from previous iteration of k-means algorithm. We can calculate the distance for each data point to nearest cluster. At the next iteration, we compute the distance to the previous nearest cluster. The point stays in its cluster, if the new distance is less than or equal to the previous distance, and it is not required to compute its distances to the other cluster centers. This saves the time required to compute distances to k-1 cluster centers. Following fig. explains the phenomena-
Fig. (a) represents the dataset points with 3 initial centroids.
Figure (a) : Initial Centroids to a dataset
Fig.(b) shows points distribution over the initial 3
centroids, and the new centroids for the next iteration
Figure (b) : Recalculating the position of the centroids
Fig. (c ) shows the final clusters and their centroids.
In fig (b), we observed some changes in cluster 1 and 2.some data points are redistributed in both clusters on the basis of min centroids distance. And the rest of the data points become closed to their new center. Fig (c) showed final clusters. By this phenomenon, we saves a lot of time by reducing number of iterations. In the proposed method, we write two functions. The first function is the basic function of the k-means algorithm, that finds the nearest center for each data point, by computing the distances to the k centers, and for each data point keeps its distance to the nearest center. The first function is shown in Algorithm 2, which is similar to that in Algorithm 1, with adding a simple data structure to keep the distance between each point and its nearest cluster. This function is called distance().
Algorithm 2: An Efficient Enhanced k-Mean Clustering Algorithm[8] : First Function
Function distance()
//assign each point to its nearest cluster a. For i = 1 to n
b. For j = 1 to k
c. Compute squared Euclidean distance d2(xi, mj); d. endfor
e. Find the closest centroid mj to xi; f. mj = mj+xi; nj = nj+1;
g. MSE = MSE + d2(xi, mj);
h. Clusterid[i] = number of the closest centroid;
i. Pointdis[i] = Euclidean distance to the closest centroid;
j. endfor k. For j = 1 to k l. mj = mj/nj; m. endfor
First, calculate the distances between point number I and all k centriods in Line 3. And determine the nearest centroid to data points in Line 5.and Line 6 adds point number i to cluster number j, and increase the count of points in cluster j by one. Line 8 and 9 are keep records of number of closest centroid and Euclidean distance to the closest centroid.and again recalculated the new centroids in Line 12. The rest of the algorithms are shown in algorithms 3, is called distance_new(). Line 1 finds the distance between the current point i and the new cluster center assigned to it in the previous iteration, if the computed distance is smaller than or equal to the distance to the old center, the point stays in its cluster that was assigned to in previous iteration, and there is no need to compute the distances to the other k-1 centers. Lines 3~5 will be executed if the computed distance is larger than the distance to the old center, this is because the point may change its cluster, so Line 4 computes the distance between the current point and all k centers. Line 6 searches for the closest center, Line 7 assigns the current point to the closest cluster and increases the count of points in this cluster by one, Line 8 updates mean squared error. Lines 9 and 10 keep the cluster id, for the current point assigned to it, and its distance to it to be used in next call of that function (i.e. next iteration of that function). This information is kept in Line 9 and Line 10 allows this function to reduce the distance calculation required to assign each point to the closest cluster, and this makes the function faster than the function distance in Algorithm 2
//Assign each point to its nearest cluster
f. Find the closest centroid mj to xi; g. mj = mj+xi; nj = nj+1;
h. MSE = MSE + d2(xi, mj);
i. Clustered[i] = number of the closest centroid; j. Pointdis[i] = Euclidean distance to the closest
centroid;
We considered an example, and centroids are taken randomly in K-means clustering approach.
Took a records[8, 9], in which some employes (data points ) are different to each other by their two attributes or features as shown in table below.Our purpose is to group these objects into K=3 groups based on the two attributes.
Table 1(Employee data set)
Employee Salary (Attribute 1) Experience
(Attribute 2)
Initial value of centroids : consider emp1, emp2 , emp3 are initial centroids presented by c1(1,4), c2(2,6), c3(4,7) respectively.
a. Objects-Centroids Distance: Find the Euclidean distance , then distance matrix at iteration 0 is
D0=
0 2.23 4.24 6.40 8.49 10.63 12.81 14.21
2.23 0 2.23 4.47 6.40 8.49 10.63 12.04
4.24 2.24 0 2.24 4.24 6.4 9.7 10
b. Each column in the distance matrix represented the object. The first row of the distance matrix corresponds to the distance of each object to the first centroid and the second row is the distance of each object to the second centroid. Similarly for third.
c. Objects Clustering: each data points are assigns in 3 clusters, based on the minimum distance .so, Emp1 is assigned to group 1, Emp2 to group 2, Emp3, Emp4 …..Emp8 to group 3. The element of Group matrix below is 1 if and only if the object is assigned to that group.
G0=
d. Iteration-1, Determine Centroids: In previous iteration, each dat points are assign in one cluster or group. And then find the new centroids which based on the new data points (members). Group 1 and group 2 are unchanges because only has one member od data point .so, c1(1,4) and c2(2,6). But c3 will change because of new 6 datapoints or member. so the cenroid becomes the average coordinate among the six members:
C3=((4+6+7+8+9+10)/6,(7+8+10+12+14+15)/6)) = ( 7.33,11 )
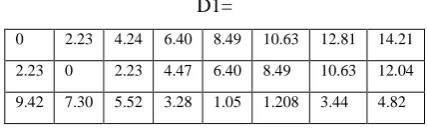
e. Iteration-1, Objects-Centroids Distances: this step is also same as the previous step 2. Again we are to compute the distance of all data points to the new centroids, then the Euclidean distance is
D1=
0 2.23 4.24 6.40 8.49 10.63 12.81 14.21
2.23 0 2.23 4.47 6.40 8.49 10.63 12.04
9.42 7.30 5.52 3.28 1.05 1.208 3.44 4.82
f. Iteration-1, Objects Clustering:
Similar to step 3, each data point are assigned to cluster or group on the basis of the minimum distance. Based on the new distance matrix, we move Emp3 to Group 2 while all the other objects remain as before. The Group matrix is shown below:
G1=
g. Iteration 2, Determine Centroids: again the same step is repeated to find the new centroids which based on the new data points (members).C1= (1 ,4) C2= (3,6.5 ) C3= (8 , 11.8 )
h. Iteration-2, Objects-Centroids Distances: Repeat step 2 again, we have new distance matrix at
i. Iteration-2, Objects clustering: Again, we assign each object based on the minimum distance.
j. Iteration-3, Determine Centroids:
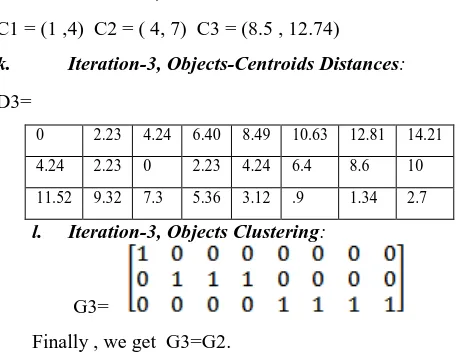
C1 = (1 ,4) C2 = ( 4, 7) C3 = (8.5 , 12.74)
k. Iteration-3, Objects-Centroids Distances:
D3=
0 2.23 4.24 6.40 8.49 10.63 12.81 14.21
4.24 2.23 0 2.23 4.24 6.4 8.6 10
11.52 9.32 7.3 5.36 3.12 .9 1.34 2.7
l. Iteration-3, Objects Clustering:
G3=
Finally , we get G3=G2.
Comparing the grouping of last iteration and this iteration reveals that the objects does not move group anymore. Thus, the computation of the kmean clustering has reached its stability and no more iteration is needed. We get the final grouping as the results shown in Table2 .
Table 2: Clustering Results (based on K-Means )
Employee Salary
If Enchanced K-means Algorithm are applied on above example then the results are:
Table 3
In the original K-means algorithm, before the algorithm converges the centroids are calculated many times and the data points are assigned their nearest centroids[10,11,12]. since complete new redistribution of the data points takes place according to the new centroids,this takes O(nkl),where
n is the number of data objects, k is the number of clusters and l is the number of iterations. In enhanced K-meams algorithms, to obtain initial clusters, this process requires O(nk).here, some data objects remains in its cluster while the others move to other clusters depending on their relative distance from the new centroid and the old centroid. This requires O(1) if a data-object stays in its cluster, and O(k) otherwise. As the algorithm converges, the number of data objects moving away from their cluster decreases with each iteration. Assuming that half the data objects move from their clusters, this requires O(nk/2). Since the algorithm converges to local minimum, the number of points moved from their clusters decreases in each iteration .so we expect the total cost is nk∑ 1/n.
Even for large number of iteration, i=1;
So, its cost is approximately O(nk), not O(nkl).
VI. CONCLUSION
In this paper, basic K-means clustering algorithm have discussed with an appropriate example. Then we pointed out the limitation of k-means technique of having more computational complexity, and solution for the same. The Enhanced K-Means Algorithm and Basic K-Means algorithm have been implemented on the same dataset and the Enhanced K-Means is proved to more efficient than Basic K-Means. But a drawback is still present in enhanced k means algorithms, fixed number of clusters. and again empty cluster problem are subsist .
VII. REFERENCE
[1]. Kirti Aggarwal, Neha Aggarwal, Priyanka Makkar “Analysis of K-Means Clustering Algorithm for Data Mining”, national conference on emerging trends in electronics and infotmation technology,2012.
[2]. Richa loohach, Dr Karnwal Garg “An insight onerview of issuses and challenges associated with clustering algorithms”, IJRIM, vol 2, issues 2(feb 2012)
[3]. Ren Jingbiao and Yin Shaohong “Research and Improvement of Clustering Algorithm in Data Mining”, 2010 2nd International Conference on Signal Processing Systems (ICSPS)
[4]. K.A. Abdul Nazeer, M. P. Sebastian “Improving the Accuracy and Efficiency of the k. Means Clustering Algorithm” world congress on Engineering 2009 vol 1, 2009
[5]. Tapas Kanungo, David M. Mount, Nathan S.
Netanyahu, Christine D. Piatko, Ruth Silverman, and AngelaY. Wu. An efficient kmeans clustering algorithm: Analysis and implementation. IEEE Trans. Pattern Anal. Mach. Intell., 24(7):881–892, 2002
[6]. M. Srinivas and C. Krishna Mohan, “Efficient Clustering Approach using Incremental and Hierarchical Clustering Methods”, 978-1-4244-8126-2/10/$26.00 ©2010 IEEE
[8]. Neha agarwal, kirti agarwal and kanika agarwal “comperative analysis of means and enhanced k-mean clusterinh algorithm for data mining” IJSER, vol3, issues 3, aug 2012
[9]. Kanik ,Neha , Kirti, “Comparative Analysis of k-means and enhanced k-k-means clustering algorithm for data mining”, IJSER, Aug 2012, Vol-3,Issuse3.
[10]. S. Sujatha & A. Shanthi Sona proposed “ New fast K-means Clustering Algorithm using Modified centroid
selection Method ”2013 International Journal of Engineering Research & Technology, vol. 2.
[11]. Ravindra Jain proposed “A Hybrid Clustering Algorithms for data mining”, 2008 School of computer science & IT, Devi Ahilya Vishwavidyalaya.