24
† Corresponding author
IMPROVEMENT OF PEST DETECTION USING HISTOGRAM ADJUSTMENT METHOD AND GABOR WAVELET
Mostafa Bayat1† --- Mahdi Abbasi2 --- Ali Yosefi3
1,3Computer Engineering Department, Hamedan Branch, Islamic Azad University, Hamedan, Iran 2
Department of Computer Engineering, Faculty of Engineering, Bu-Ali Sina university, Hamedan, Iran
ABSTRACT
Plant diseases reduce production and cause huge economic losses in the agricultural section. At present, plant diseases are diagnosed by specialists and with the naked eyes. Presenting a simple, fast, cheap and accurate way for
the diagnosis of plant diseases is necessary. In this paper, by using image processing and machine vision techniques, four methods for the diagnosis and classification of the diseases of corn leaf are presented. In the first method, the affected parts were separated from the healthy parts using the histogram adjustment; subsequently, a two-layer
Perceptron Neural Network was used to categorize the final results and diagnose the disease type. The results indicate that Neural Network with an average of 65.15% is able to correctly diagnose the disease of the corn leaf. In
the second method, different types of Laplacian filters, Canny and Sobel were applied on the leaves; after the separation of the affected parts, the classification and diagnosis phase were implemented. The results revealed that the algorithm with the accuracy of 67.94%, can correctly diagnose the disease. In the third method, using the
analysis method of principal components, data dimension was reduced, and then was sent to the Support Vector Machine classifier for the diagnosis of the disease. This algorithm is able to correctly diagnose the disease with an
accuracy of 75.28%. Furthermore, the algorithm is able to diagnose Class 5 and 4 diseases in a more accurate way. Finally, in the fourth method, a combination of Gabor filter and visual features was used in order to diagnose the type of disease. In this method, the proposed algorithm can correctly diagnose the disease with the accuracy of
90.04%.
© 2016 AESS Publications. All Rights Reserved.
Keywords: Plant diseases, Histogram adjustment, Gabor wavelet, Corn leaf, Perceptron Neural Network, SVM classifier
Contribution/ Originality
This study contributes in the existing literature using the Gabor filters and visual features of the image such as the number of holes in the image and the radius of each hole the extraction of the feature is carried out, and eventually, the features are sent to a Support Vector Machine classifier and the type of the disease is diagnosed with an accuracy of 90.04%.
1. INTRODUCTION
Plant diseases reduce production and cause huge economic losses in the agricultural section. Hence, diagnosis of the diseases in plants and trees is of high importance. At present, plant diseases are diagnosed by specialists and with the naked eyes. This task requires continuous monitoring of experts for which heavy costs may be needed on large
Journal of Asian Scientific Research
ISSN(e): 2223-1331/ISSN(p): 2226-5724
farms. In addition, in some developing countries, farmers may have to travel long distances to contact experts which is time-consuming and very costly [1]. Furthermore, timely control of plant diseases reduces product loss and leads to a minimum use of chemical pesticides which will result in the reduction of pollution of underground resources. With the help of machine vision technology and image processing, it is possible to automatically diagnose and classify plant diseases [2].
Further, given that the symptoms most of the diseases in the early stages are not clear and their diagnosis is very difficult with the naked eye, using more accurate and rapid identification methods such as machine vision and image processing is necessary, specifically in conditions that information should be obtained by repetition and naked eyes [3];[2].
The purpose of this paper is to provide a method based on image processing for rapid and accurate diagnosis of five types of diseases of corn leaves. In the following section, some of the past works in this field are introduced; subsequently, in Section Three the proposed method is presented, and then the results of the proposed method are mentioned. The article, finally, ends with a Conclusion section.
2. REVIEW OF LITERATURE
In recent years, using image processing method, extensive research has been done in order to identify early diagnosis methods of plant diseases.
For instance, article [4] contributed making a distinction between corn plants affected by moth larvae and healthy plants. In this study, the algorithms have been divided into two main stages: image processing and image analysis. At the level of image processing, the image was filtered into a gray scale to remove the fake effects. At the stage of image analysis, the whole image is divided into 12 blocks in each of which the leaf area is less than 5% of the whole affected leaf area. For each of the remaining blocks, the number of connected elements, representing the affected areas, is calculated. If this calculated number, after the experimental evaluation is higher than 10, the plant will be considered ill.
In Al-Taani and Al-Haj [5]an after-diffusion Neural Network method is presented for diagnosing leave pests. It is proven that in order to identify the type and species of a leaf, a post-emission Neural Network and the image of the leaf are enough. In order to find the input data of the after-diffusion algorithm, the thinning algorithm and Prewitt edge detection algorithm were used. The study indicated that using a larger learning data set to identify different types of affected and damaged leaves, it is possible to improve this method and develop an expert system.
Study Al Bashish, et al. [6] using image processing technique and separation analysis, identified and classified four diseases of the grapefruit plant. Image processing was carried out through the co-occurrence color matrix in which the structural properties of citrus leaf color were extracted in channel HSI, and then using the separation analysis in SAS software, the diseases were isolated from each other with an accuracy of 98.75%.
In Aleixos, et al. [7] the damages of the leaves caused by the spider worms were examined. The algorithm was based on a two-stage threshold. The first stage separated the leaf from the background, and the second stage separated the damages areas from the healthy areas. The final estimation was obtained through dividing the number of pixels in the damaged areas by the total number of pixels of the leaf. The researchers compared the results through two other methods, the first one was based on the leaf damage index, and the other one based on chlorophyll fluorescence. They concluded that their method and the leaf damage index gained better results compared to the fluorescence of chlorophyll.
related to each other. In the first stage, three main colors of the image are selected by comparing the standard deviation. In the second stage, the Euclidean distance between the coefficients of the features of image selected in the first stage and the image under query was calculate, and the images were chosen and arranged with the smallest distance.
In general, due to the cheaper, faster and the more reliable methods based on image processing, different methods for disease diagnosis are provided [8];[9];[10]. In the following section, the proposed method will be introduced.
2.1. Data Collection
This article examines the results of the proposed methods; using a public data set which was collected and labeled by a botanist physician. This dataset contains 100 color images of the corn leaves. These images are of different sizes and have 5 types of labels naming the diseases of the corn leaves. Table 1 shows the characteristics of the images in this collection. In order to assess the proposed method, this dataset was used.
Table-1. Distribution of Images in the Image Data-set [6]
Disease/ Image label The number of images
Southern Leaf Blight 20
Southern Rust 20
Gray Leaf Spot 20
Holcus Spot 20
Stewart's Wilt 20
In Figure (1), an example of the images of each of the diseases is displayed.
Figure-1. Pictures ofcornleafdiseases- from top, and from left to right (a) Southern Leaf Blight (b) Southern Rust (c) Gray
Leaf Spot (d) Holcus Spot (e)Stewart's Wilt
Source:https://www.pioneer.com/home/site/us/agronomy/crop-management/corn-insect-disease/southern-leaf-blight/
2.2. Proposed Methods for the Diagnosis of Plant Leaf Diseases
In this section, the proposed methods and the results of each of them are discussed.
In all methods before applying the algorithm, a series of preprocessing is performed on the images. For instance, the dimensions of images are changes to 150 * 150 at first, the noise of the images are deleted and only the images of the
In the first method which is carried out after the pre-processing stages, the image contrast is increased, and then using the image histogram, a threshold is used to isolate the affected areas from other areas, then the output of this stage is sent to the Neural Network Classifier and also to SVM, consequently the plant disease is diagnosed.
In the second method, extraction of the affected areas is done using high-pass filters, and then the performances of various filters in the extraction of the damaged areas are compared with each other. In the present study, three
types of filters, namely Laplacian filter on small windows, Butterworth filter and Gabor filter are used to identify the damaged areas of leaves. Some examinations are also done on the color areas of HSV and La * b *. Based on the
obtained results, Laplacian filter had the best performance. Subsequently, after obtaining the damaged areas, the images are sent to a neural network to diagnose the types of plant diseases.
In the third method carried out after the pre-processing stages, the size of images is decreased by PCA method,
and then the decreased images are sent to Neural Network Classifier and Support Vector Machine classifier (SVM) to diagnose plant diseases.
In the fourth method, Gabor filters and visual characteristics of the image such as the number of holes in the picture, the radius of each hole, along with the Support Vector Machine are used to distinguish the affected areas and to diagnose the types of disease.
3. RESULTS
In the first method, after the pre-processing stages, in order to obtain better results; firstly, the image contrast is increased. Subsequently, to decrease small fluctuations in the histogram, a buffer filter is applied on the histogram diagram. Also, the histogram adjustment can be used.
After applying the pre-processing, two peaks in the histogram are obtained, and then the mean scores of the two peaks are considered as the threshold. This threshold is used to separate the affected areas. Accordingly, a binary
image is obtained which divides the image into two sections of healthy and affected. Using this image, the affected areas in the plant leaf would become clear.
In Figure 2 the diagram of this method is displayed. And the results of the application of this method on the plant
images are displayed in Figure (3). Moreover, the affected areas separated by this method are shown in Figure 4.
Figure-3. Histogram adjustment and the separation of the affected areas
From left to right (a) the plant image (c) histogram (c) the adjusted histogram (d) the separation result
Figure-4. The separation of the affected areas
As can be seen, using this method, the affected areas are separated well. Subsequently, the damaged areas are sent to the Neural Network classifier.
The Neural Network classifier used here is a Perceptron neural network with 5 and 10 neurons in the hidden
layer, and 70% of the data were used for education, 15% for testing, and 15% for authentication.
In Table 2 the rate of MSE error in various performances is displayed. In Table 3, the accuracy of diagnosis in
each class is shown.
Table-2. The Rate of MSE Error
MSE Error The number of neurons in the hidden layer
5
10
Table-3. The Accuracy of Diagnosis in each Class Diagnosis Accuracy (%) Type of Disease
62.70 Southern Leaf Blight
61.34 Southern Rust
73.24 Gray Leaf Spot
59.75 Holcus Spot
67.85 Stewart's Wilt
65.15 Mean
The results indicate that the Neural Network with mean of 65.15% was able to correctly diagnose the corn leaf disease. Subsequently, in order to improve the results in the pre-processing stage, the scanning of the affected areas is
tried to be done in a better way.
Detection of the damaged areas can be done by using a high-pass filter. As noted above, in this method the
effectiveness of various filters on damaged images is gone under consideration. To this aim, several filters were examined, and their effectiveness results on the separation of the damaged areas of the leaves images were compared with each other. Finally, the Laplacian filter which had a better effectiveness was used.
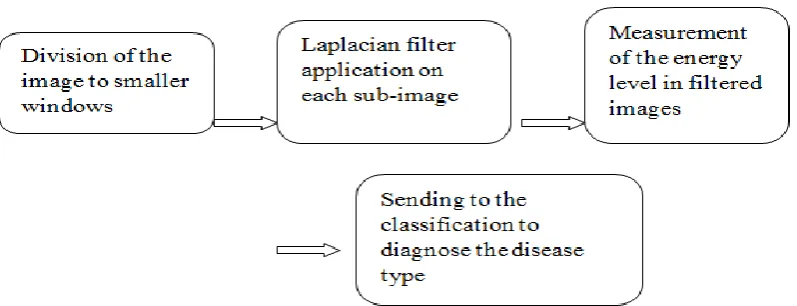
The diagram of the third method is displayed in Figure 5.
Figure-5. The diagram of the second proposed method
The image of the Leaf was changed into a gray image and the filter was applied on it. The result was an image in which the damaged areas were shown white in a black background. The result of the Laplacian filter can be seen in Figure 6. As Figure 6 displays, this filter is suitably able to distinguish the affected areas. In the main method of this research, this filter was used on small windows. In order to remove noise from the image, the morphological operators were utilized.
Furthermore, the results of Sobel and Canny filters application on images are displayed in Figures 7 and 8.
Figure-7. The result of Sobel operator application :
Figure-8. The result of Canny operator application.
In examining the results of Laplacian, Canny, and Sobel filters, it became apparent that Laplacian filters have a better performance in separating the damaged areas; hence, this method is used to isolate the affected areas and the results are sent to the Support Vector Machine classifier to diagnose the type of plant disease. Considering that the issue under study in this research is a five-classification issue, the Support Vector Machine is used by a one-to-one method.
The results of the application of this algorithm are displayed in Table 4.
Table-4. The Accuracy of Diagnosis in each Class in the Second Method
Accuracy of diagnosis (%) Type of disease
65.75 Southern Leaf Blight
66.49 Southern Rust
54.68 Gray Leaf Spot
75.76 Holcus Spot
77.06 Stewart's Wilt
67.84 Mean
The results indicate that the algorithm was able to correctly diagnose the disease with the accuracy of 67.94%. Considering that the dimension number of input data is high, it seems that by reducing the size of input data the accuracy of the classification would increase; and then in the third method the data size would decrease in order to improve the accuracy of data classification.
Figure-9. The diagram of the third proposed method
According to the diagram in figure 9, in the third method, scanning of the affected parts is performed using the first method. Due to the large volume of data, in the next step, the size of data is decreased using PCA method. Then the results of the vector machine classifier used in method 2 are sent.
In table (5), the results of the application of this method are shown. By examining the results it becomes clear that the algorithm is able to correctly diagnose the disease with the accuracy of 75.28%. As it is clear, by reducing the size of the data, the accuracy of diagnosis is increased.
Furthermore, the algorithm is able to more accurately diagnose the Class 5 and 4 diseases.
Table-5. The Accuracy of Diagnosis in each Class Using the Third Method
Diagnosis accuracy (%) Type of disease
75.72 Southern Leaf Blight
68.54 Southern Rust
70.03 Gray Leaf Spot
80.00 Holcus Spot
82.14 Stewart's Wilt
75.28 Mean
In the three previous methods only the statistical properties of the images were used to diagnose the type of plant diseases.
The results of the studies conducted by researchers on the human visual system indicate that the human eye breaks the input image into a number of small pictures with different spatial frequencies and at different angles. In other words, there are different cells in the human retina that are sensitive to different spatial frequencies and different directions. Gabor filters that are a collection of loaded causeway filters and have different crossing frequencies and bandwidth are mathematical simulation of this aspect of human visual system.
This study takes advantage of the Gabor filters bank in two directions, two frequencies and two scales to diagnose the plant diseases. For each image, eight filtered images are obtained. These filters are applied in two directions of 2 / π and 4 / π, in two scales of 2 and 5, and two frequencies of 0.5 and 2. The frequency response of these eight filters is shown in Figure 10.
Figure-10. Frequency response of Gabor Filters
Subsequently, four features of image energy, entropy, and Homogeneity are calculated for each image using the following equations.
( ) ∑ * ( | )+ * ( | )+ (2)
Thus, for each image, 8 images are obtained in the Gabor filter, and from each of these images the three features referred to above are extracted. This means that for each original image there will be 24 features.
Then, these data are sent to two types of the Support Vector Machine classifier. The accuracy and amount of MSE of these two classifiers are shown in Table 6.
Table-6. Diagnosis Accuracy in the Fourth Method
Diagnosis Accuracy (%) Type of disease
87.77 Southern Leaf Blight
85.40 Southern Rust
89.91 Gray Leaf Spot
93.35 Holcus Spot
95.57 Stewart's Wilt
90.04 Mean
4. CONCLUSION
Every year plant diseases cause great economic losses in the agriculture sector. Early diagnosis of diseases and plant pests reduces these losses. One of the fastest methods for the diagnosis of plant diseases is the image processing techniques. In this article in order to diagnose 5 types of corn Leaf diseases, several methods were examined, and finally a combination of Gabor features and SVM classifier indicated the best results in terms of accuracy. In this method, after pre-processing stage, at first the affected areas were separated by using a special separation method, such that firstly the image contrast is increased, then with the help of image histogram and determining the threshold, the damaged areas are separated from other areas. Subsequently, using the Gabor filters and visual features of the image such as the number of holes in the image and the radius of each hole the extraction of the feature is carried out, and eventually, the features are sent to a Support Vector Machine classifier and the type of the disease is diagnosed with an accuracy of 90.04%.
REFERENCES
[1] G. Anthonys and N. Wickramarachchi, "An image recognition system for crop disease identification of paddy fields in
Sri Lanka," presented at the Industrial and Information Systems (ICIIS), 2009 International Conference, 2009.
[2] N. E. Abdullah, A. A. Rahim, H. Hashim, and M. M. Kamal, "Classification of rubber tree leaf diseases using multilayer
perceptron neural network," Paper Presented at the Research and Development, 2007. SCOReD 2007. 5th Student
Conference, 2007.
[3] N. Arica and F. T. Yarman-Vural, "An overview of character recognition focused on off-line handwriting," Systems,
Man, and Cybernetics, Part C: Applications and Reviews, IEEE Transactions on, vol. 31, pp. 216-233, 2001.
[4] H. Al-Hiary, S. Bani-Ahmad, M. Reyalat, M. Braik, and Z. ALRahamneh, "Fast and accurate detection and classification
of plant diseases," International Journal of Computer Applications, vol. 17, pp. 31-38, 2011.
[5] A. T. Al-Taani and S. Al-Haj, "Recognition of on-line arabic handwritten characters using structural features," Journal
of Pattern Recognition Research, vol. 1, pp. 23-37, 2010.
[6] D. Al Bashish, M. Braik, and S. Bani-Ahmad, "A framework for detection and classification of plant leaf and stem
diseases," Paper Presented at the Signal and Image Processing (ICSIP), 2010 International Conference, 2010.
[7] N. Aleixos, J. Blasco, F. Navarrón, and E. Moltó, "Multispectral inspection of citrus in real-time using machine vision
and digital signal processors," Computers and Electronics in Agriculture, vol. 33, pp. 121-137, 2002.
[8] C. A. Basca and R. Brad, "Texture segmentation. Gabor filter bank optimization using genetic algorithms," presented at
[9] H. M. Asraf, N. M. Tahir, and B. S. Shah, "Overview of image processing approach for nutrient deficiencies detection in
elaeis guineensis," presented at the System Engineering and Technology (ICSET), 2011 IEEE International Conference
2011.
[10] J. I. Arribas, G. V. Sánchez-Ferrero, G. Ruiz-Ruiz, and J. Gómez-Gil, "Leaf classification in sunflower crops by
computer vision and neural networks," Computers and Electronics in Agriculture, vol. 78, pp. 9-18, 2011.