Image Retrieval based on Local Histogram
and Texture Features
Ch.Kavitha#1,M.Babu Rao#2,Dr. B.Prabhakara Rao*3, Dr. A.Govardhan~4 #
Associate Professor, Gudlavalleru Engineering College Krishna (dist.), Andhra Pradesh, India
*
Professor & Director of Evaluation, JNTUK, Kakinada East Godavari (dist.), Andhra Pradesh, India
~
Professor & Principal, JNTUH College of Engineering, Jagtial Karimnagar (dist.), Andhra Pradesh, India
Abstract
—
In this paper we propose a new and efficienttechnique to retrieve images based on sum of the values of Local Histogram and GLCM (Gray Level Co-occurrence Matrix) texture to enhance the retrieval performance. Most of the image retrieval techniques used Histograms for indexing. Histograms describe global intensity distribution. They are very easy to compute and are insensitive to small changes in object translations and rotations. Our main focus is on separation of the image bins (histogram value divisions by frequency) followed by calculating the sum of values, and using them as image local features. At first, the histogram is calculated for an image. After that, it is subdivided into sixteen equal bins and the sum of local values is calculated and stored. Similarly the texture features are extracted based on GLCM. The four statistic features of GLCM i.e. entropy, energy, inverse difference and contrast are used as texture features. These four features are computed in four directions (00, 450, 900, and 1350). A total of 16 texture values are computed per an image. Sum of the differences between each bin of the query and target image histogram is used as a distance measure for Local Histogram and Euclidean distance is adopted for texture features. Weighted combined distance is used in retrieving the images. The experimental results show that the proposed method has achieved highest retrieval performance.
Keywords— Image retrieval, Local Histogram, Color, Texture,
GLCM.
I. INTRODUCTION
Content-based image retrieval (CBIR) [1,13,15] has become a prominent research topic because of the proliferation of video and image data in digital form. Increased bandwidth availability to access the internet in the near future will allow the users to search for and browse through video and image databases located at remote sites. Therefore fast retrieval of images from large databases is an important problem that needs to be addressed.
Image retrieval systems attempt to search through a database to find images that are perceptually similar to a query image. CBIR is an important alternative and complement to traditional text-based image searching and can greatly enhance the accuracy of the information being returned. It aims to develop an efficient visual-Content-based technique to
search, browse and retrieve relevant images from large-scale digital image collections. Most proposed CBIR techniques automatically extract low-level features (e.g. color, texture, shapes and layout of objects) to measure the similarities
among images by comparing the feature differences.
The CBIR process consists of calculating a feature vector
that characterizes some image properties, and stored in the image feature database. The user provides a query image, and the CBIR system computes the feature vector for it, and then compares it with the particular image feature database images. The relevance comparison is done by using some distance measurement technique, and the minimum or permissible distances are the metrics for the matched or similar images. The features vector should be able enough to fully characterize image structural and spatial properties, which retrieve the similar images from the image database.
Color is one of the most reliable visual features that are also easier to implement in image retrieval systems. Color is independent of image size and orientation, because, it is robust to background complication. Color histogram is the most common technique for extracting the color features of colored images [2-6]. Color histogram tells the global distribution of colors in the images. It involves low computation cost and it is insensitive to small variations in the image structure. However, color histogram hold two major shortcomings. They are unable to fully accommodate the spatial information, and they are not unique and robust. Two dissimilar images with similar color distribution produce very similar histograms. Moreover, similar images of same point of view carrying different lighting conditions create dissimilar histograms.
Many researchers suggested the use of color correlogram for avoiding inconsistencies involving the spatial information [5]. Multiresolution histograms [6,7] are also suggested to ameliorate image retrieval process. Gaussian filtering may also be used for multiresolution decomposition of an image [7]. This paper tends to solve the second problem.
be distinguished solely by their textures without any other information. There is no universal definition of texture. Texture may consist of some basic primitives, and may also describe the structural arrangement of a region and the relationship of the surrounding regions [8]. In our approach we have used the statistic texture features using gray-level co-occurrence matrix (GLCM). So, in this paper, we present a technique for image retrieval based on color and texture. Because Low level visual features of the images such as color and texture are especially useful to represent and to compare images automatically. In the concrete selection of color and texture description, we use sum of the values of Local histogram, and Gray-level co-occurrence matrix.
In this paper a new and efficient technique to retrieve images is developed which captures the sum of values of Local histogram and texture features of the image to enhance the retrieval performance. The rest of the paper consists of: Section II presents extraction of sum of values of a local histogram. Section III describes the extraction of texture features based on GLCM. In Section IV, contains the description of similarity measure used in image retrieval system. Section V presents’ experimental results Finally, Section VI concludes this presentation.
II. EXTRACTION OF SUM OF THE VAUES OF LOCAL HISTOGRAM
The proposed method strives for a light weight computation with effective feature extraction. Digital images undergo the following process in order to produce an effective feature vector describing an eminent feature set targeted to avoid the lack of robustness of a common histogram.
A. Pre-processingPage
RGB and indexed images carry high values that require more computation time. Hence, the images are converted to gray scale in order to reduce the vast spectrum of indexed images or the 3D components of RGB to a 2D component carrying values between 0 and 255 (containing the end points). This process promises reduction in the computation time and power required for extracting features from an image. The resulting image undergoes histogram equalization in order to enhance contrast of values of an image by generating its flat histogram. Figures 2 show the reprocessing applied to the image shown in figure 1.
B. Splitting histogram values by fixed frequency range
Fig. 1An image selected at random as a sample from a collection of images.
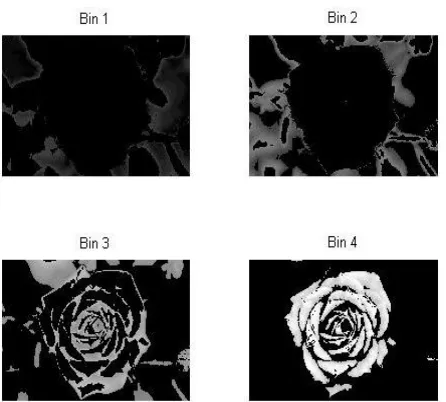
The histogram equalized image is split into four fixed bins in order to extract more distinct information from it. The frequencies of 256 values of gray scale are split into sixteen (16) bins carrying 16 values each (0~15, 16~31, 32~ 47, 48~63, and so forth). This is done by turning off the gray values of image which do not lie between the four bins. This gives four images carrying objects which lie in the specific
frequency ranges, and all different from each other. This
provides a better illustration of image segments and simplifies the computation of features for the distinct portion of image. An example of the mechanism is shown in figure 3, which clearly shows the distribution of frequencies in various bins.
TAB LE I
Sum of values listed against bins
Bin# 1 2 3 4 5 6 7 --- 16
Sum 165 24 85 3 73 96 234 --- 147
Fig. 2(a) Gray scale (intensity) representation of image in figure 1. (b) Histogram of the gray scale image. (c) Gray scale image after histogram equalization. (d) Histogram of the flat (equalized) image.
C. Calculating sum of values from the bin sub-divisions
The values from each bin are summed together and noted down against each bin. This provides a more distinctive set of values for an image. Therefore, these sums from the local regions give a, some what, robust information from the histograms.
D. Storing information
The information from bins is stored in the form of a feature
Fig. 3Bins generated from the image in figure 2(c).
III.EXTRACTION OF TEXTURE FEATURES
Most natural surfaces exhibit texture, which is an important low level visual feature. Texture recognition will therefore be a natural part of many computer vision systems. In this paper, we propose a texture representation for image retrieval based on GLCM.
GLCM [9, 10, 11, 13 ] is created in four directions with the distance between pixels as one. Texture features are extracted from the statistics of this matrix. Four GLCM texture features are commonly used which are given below:
GLCM is composed of the probability value, it is defined
by which expresses the probability of the couple
pixels at direction and d interval. When and d is
determined, is showed by Pi, j. Distinctly GLCM
is a symmetry matrix and its level is determined by the image gray-level. Elements in the matrix are computed by the
equation shown below:
) 1 ( ) , , ( ) , , ( ) , , (
i jP i jd
d j i P d j i P
GLCM expresses the texture feature according the correlation of the couple pixels gray-level value at different positions. It quantification ally describes the texture feature. In this paper, four texture features are considered. They include energy, contrast, entropy, inverse difference.
A. Energy
x y y x P EEnergy ( ) , 2 (2)
It is a texture measure of gray-scale image represents homogeneity changing, reflecting the distribution of image gray-scale uniformity of weight and texture.
B. Contrast
, (3)
)
(I x y 2P x y
Contrast
Contrast is the main diagonal near the moment of inertia, which measures how the values of the matrix are distributed and number of images of local changes reflecting the image clarity and texture of shadow depth. Large Contrast represents deeper texture.
x y y x P y x P SEntropy( ) ( , )log ( , ) (4)
Entropy measures randomness in the image texture. Entropy is minimum when the co-occurrence matrix for all values is equal. On the other hand, if the value of co-occurrence matrix is very uneven, its value is greater. Therefore, the maximum entropy implied by the image gray distribution is random.
) 5 ( ) , ( ) ( 1 1 )
( 2P x y y x H ference InverseDif x y
It measures number of local changes in image texture. Its value in large is illustrated that image texture between the different regions of the lack of change and partial very evenly.
Here p(x, y) is the gray-level value at the Coordinate (x, y).
The texture features are computed for an image when d=1
and =00, 450, 900, 1350. In each direction four texture features are calculated. They are used as texture feature descriptor. Combined feature vector of Color and texture is formulated.
IV.SIMILARITYMEASUREMENT
There are various similarity measures like L1, L2 norms which can be used in the computation of similarity between feature vectors of two images. The distance between the feature vector of query image and the feature vector of image stored in the database can be calculated by using L2 or Euclidean distance. But the distance between local histogram of query image and the target image comprises of three steps. The feature vectors are subtracted, at first, under simple subtraction rules. Secondly, their sum is calculated. Finally, the third step comprises of sorting the absolute values of the sums obtained in the second step.
For any two vector images Q and D, let their corresponding feature vectors be 1 row and 16 column matrices. Let, feature vector of image Q be FV(Q). Similarly, let the feature vector of image D be FV(D). According to Euclidean distance algorithm described above, let:
Distance (Q, D) = FV (Q) – FV (D) … (6)
Where, Distance (Q,D) is a vector containing the result of difference calculation as described in equation 6. The components of the resulting matrix are summed together and the absolute value of this sum is considered.
And the distance between the texture features of query image and target image is computed with L2 or Euclidean distance.
The similarity between query and target image is measured from two types of characteristic features which includes Local )
, ,
(i jd
P
) , ,
(i jd
Histogram and texture features. Two types of characteristics of images represent different aspects of property. So during the formulation of similarity measure, the appropriate weights are used to combine the distances between them. These distance values are sorted in order to display the top 20 matches.
D(A, B) =ω1D(FCA , FCB ) + ω2D(FTA , FTB) (7)
Here ω1 is the weight of Local Histogram features, ω2 is the
weight of texture features, FCA and FCB represents the
16-dimensional Local Histogram features for image A and B. For
a method based on GLCM, FTA and FTB on behalf of 16-
dimensional texture features correspond to image A and B. Here, we combine color features and texture features. The
value of ω through experiments shows that at the time
ω1=ω2=0.5 has better retrieval performance.
V. EXPERIMENTALRESULTS
A. Data set
Wang’s [16] dataset comprising of 1000 Corel images with ground truth. The image set comprises 100 images in each of 10 categories. The images are of the size 256 x 384 or 384X256. But the images with 384X256 are resized to 256X384.
B. Feature set
The feature set comprises Sum of Local Histogram values and texture descriptors computed for an image as we discussed in section II and section III.
C. Results
The results are benchmarked with some of the existing systems using the same database [16]. The quantitative measure is given below
) ( ) ( , 100 ) , ( , 1000 1
1 100
1 ) (
i ID j ID j i r j
i p
Where p(i) is precision of query image I, ID(i) and ID(j) are
category ID of image I and j respectively, which are in the range of 1 to 10. the r(i, j) is the rank of image j. This value is percentile of images belonging to the category of image i , in the first 100 retrieved images.
The average precision pt for category t(1≤t≤10) is given by
t i ID i
t p i
P
) ( , 1000 1
) ( 100
1
The comparison of proposed method with other retrieval systems is presented in the Table 1. These retrieval systems are based on HSV color, GLCM texture and combined HSV color and GLCM texture. Our sub-blocks based retrieval system is better than these systems in all categories of the database.
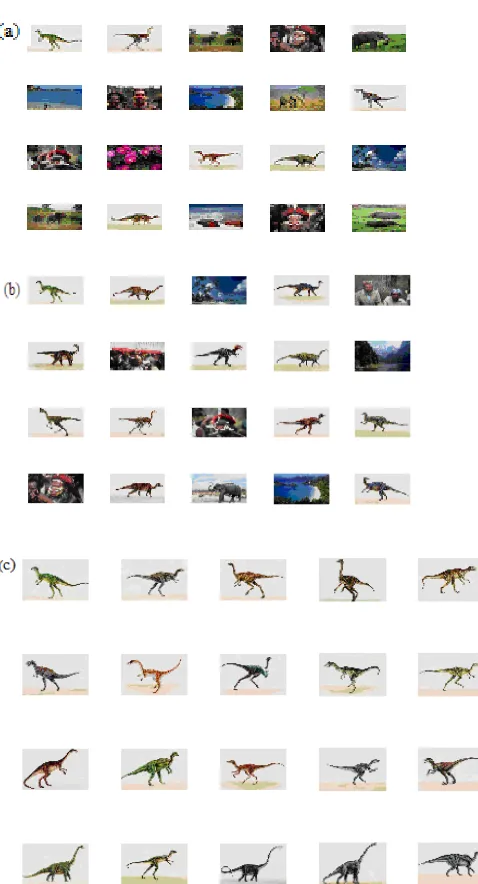
The experiments were carried out on a Core i3, 2.4 GHz processor with 4GB RAM using MATLAB. Fig. 2 shows the image retrieval results using HSV color, GLCM texture, HSV color and GLCM texture and the proposed method. The image
at the top left- hand corner is the query image and the other 19 images are the retrieval results.
The performance of a retrieval system can be measured in terms of its recall (or sensitivity) and precision (or
specificity).Recall measures the ability of the system to
retrieve all models that are relevant, while precision measures the ability of the system to retrieve only models that are relevant. They are defined as
images relevant of
Number Total
retrieved images
relevant of
Number
Recall
retrieved images
of Number Total
retrieved images
relevant of
Number
precision
TABLE I shows the comparison of average precision obtained by proposed method with other retrieval systems. In our data base, there are ten categories. In each class of images, there is an improvement in the average precision value by our proposed method when compared with other techniques.
TABLE I Average Precision
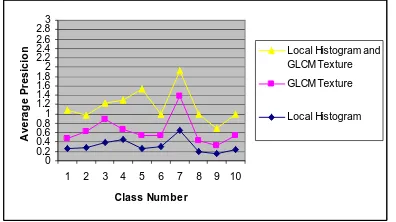
The graph in Fig.5 represents Average Precision of ten classes of images in Corel Data base [16] in various techniques. The Fig. 6 shows the Average Precision with the number of returned images. Average precision decreases with increasing the number of returned images. And the Fig. 7 represents a graph showing the Average Recall with respect to number of returned images. The value of the Average Recall increases with increase in the number of returned images.
0 0.2 0.4 0.6 0.81 1.2 1.4 1.6 1.82 2.2 2.4 2.6 2.83
1 2 3 4 5 6 7 8 9 10
Class Number
A
v
e
ra
g
e
P
re
s
ic
io
n Local Histogram and
GLCM Texture
GLCM Texture
Local Histogram
Fig.5 Average Precision of Various techniques of ten classes of images in Corel data base.
0 0.1 0.2 0.3 0.4 0.5 0.6
20 40 60 80 100
Number of returned Images
A
v
e
a
g
e
P
re
c
is
io
n Local Histogram
GLCM texture
Local Histogram and GLCM Texture
Fig. 6 Average Precision of various image retrieval methods.
0 0.1 0.2 0.3 0.4 0 .5 0.6
2 0 40 60 80 100
N umb er o f R et ur ned i ma g es
Local Histogram GLCM Text ure Local Histogram and GLCM Text ure
Fig. 7 Average Recall of various image retrieval methods.
VI.CONCLUSION
Image retrieval is an active research topic in image processing, pattern recognition, and computer vision. In this paper, a new and efficient image retrieval technique has been proposed which uses the combination of Local Histogram, and GLCM texture features. Experimental results showed that the proposed method yielded higher average precision and average recall with reduced feature vector dimension. In addition, the proposed method almost always showed performance gain of average retrieval time over the other methods. As further studies, the proposed retrieval method is to be evaluated for more various databases.
REFERENCES
[1] Ritendra Datta, Dhiraj Joshi, Jia Li, James Z. Wang, Image retrieval: ideas, influences, and trends of the new age, ACM Computing Surveys 40 (2) (2008) 1–60.
[2] M. Carlotto, “Histogram analysis using a Scale space approach,” IEEE Transactions of Pattern Analysis and Machine Intelligence, vol. 9, no. 1, pp. 121-129, 1987.
[3] J. Hafner, H. Sawhney, W. Equitz, M. Flickner and W. Niblack, “Efficient color histogram indexing for quadratic form distance functions,” IEEE Transactions of Pattern Analysis and Machine Intelligence, vol. 17, no. 7, pp.
[4] M. Swain and D. Ballard, “Color indexing,” International Journal of Computer Vision, 7(1) pp. 11-32.
[5] Jing Huang, S Ravi Kumar, Mandar Mitra, Wei- Jing Zhu and Ramin Zabi, “Image indexing using color correlograms,” Computer Vision and Pattern Recognition, 1997. Proceedings, 1997 IEEE Computer Society Conference on 17-19 June 1997.
[6] J. Engel, “The multiresolution histogram,” Metrika, vol. 46, pp. 41-57, 1997.
Average Precision
Class
Local Histogram
GLCM Texture
Local Histogram+GLCM
Texture
Africa 0.26 0.21 0.612
Beaches 0.27 0.35 0.366
Building 0.38 0.5 0.357
Bus 0.45 0.22 0.618
Dinosaur 0.26 0.29 0.993
Elephant 0.3 0.24 0.451
Flower 0.65 0.73 0.543
Horses 0.19 0.25 0.562
Mountain 0.15 0.18 0.355
Food 0.24 0.29 0.454
[7] E. Hadidemetriou, M. D. Grossberg, and S.K. Nayar, “Multiresolution histograms and their use for recognition,” IEEE Transactions of Pattern Analysis and Machine Intelligence, vol. 26, no. 7, pp. 831-847, July 2004.
[8] Chia-Hung Wei, Yue Li, Wing-Yin Chau, Chang-Tsun Li, Trademark image retrieval using synthetic features for describing global shape and interior structure, Pattern Recognition 42 (3) (2009) 386–394. [9] H. T. Shen, B. C. Ooi, K. L. Tan, Giving meanings to www images,”
Proceedings of ACM Multimedia, 2000, pp.39–48.
[10] FAN-HUI KONG, “Image Retrieval using Both color and texture features” proceedings of the 8th international conference on Machine learning and Cubernetics, Baoding, 12-15 July 2009.
[11] JI-QUAN MA, “Content-Based Image Retrieval with HSV Color Space and Texture Features”, proceedings of the 2009 International Conference on Web Information Systems and Mining.
[12] P. Howarth and S. Ruger, “Robust texture features for still-image retrieval”, IEE. Proceedings of Visual Image Signal Processing, Vol. 152, No. 6, December 2005.
[13] Rui Y, Huang T S, Chang S F. Image retrieval: current techniques, promising directions and open issues, Journal of Visual Communication and Image Representation, 1999, 10( I): 39-62 [14] Song Mailing, Li Huan, “An Image Retrieval Technology Based on
HSV Color Space”, Computer Knowledge and Technology, No. 3, pp. 200-201, 2007.
[15] B S Manjunath, W Y Ma, “Texture feature for browsing and retrieval of image data”, IEEE Transaction on PAMI, Vol. 18, No. 8, pp.837-842.