PERSKETCHTIVITY : RECOGNITION SYSTEM AND PROGRESSIVE LEARNING ANALYSIS
A Thesis by
SWARNA KESHAVABHOTLA
Submitted to the Office of Graduate and Professional Studies of Texas A&M University
in partial fulfillment of the requirements for the degree of MASTER OF SCIENCE
Chair of Committee, Tracy Hammond Committee Members, John Keyser
Julian Kang Head of Department, Dilma Di Silva
August 2016
Major Subject: Computer Engineering
ABSTRACT
PerSketchTivity is a sketch-based tutoring system for design sketching that allows students to hone their skills in design sketching and self-regulated learning through real-time feedback. Students learn design-sketching fundamentals through drawing exercises of reference shapes starting from basic to complex shapes in all dimensions and subsequently receive real-time feedback assessing their performance.
PerSketchTivity consists of a recognition system that evaluates the correctness of a student’s sketch and provides real-time feedback, evaluating the sketch based on error (accuracy), smoothness, and speed. The focus of this thesis is to evaluate the performance of the system in terms of the recognition accuracy (does the system correctly understand what the student intended to draw) as well as the educational impact on the sketching abilities of the students practicing with this system. Each student’s increase in sketching ability is measured in terms of the accuracy, smooth-ness, and the speed at which the strokes. Data analysis comparing the early to late sketches showed a statistically significant increase in sketching ability.
ACKNOWLEDGEMENTS
I would like to express my sincere thanks to everyone who helped in the comple-tion of this thesis. My gratitude to my advisor, Dr. Tracy Hammond, for constant support throughout the Masters and inspiring and motivating me. Her continu-ous guidance, mentoring and encouragement helped me learn and progress in this research.
I also would like to thank other committee members, Dr. John Keyser and Dr. Julian Kang, for their insightful suggestions and the sharing of their knowledge.
I am grateful to the PerSketchTivity team at the Georgia Institute of Technology for their insights during the research and helping in collecting data. My special thanks to Dr. Julie Linsey, Dr. Wayne Li, Blake Willford, and Ethan Hilton who integrated the software into their classroom curriculum, helping to obtain student data.
Thanks to all the friends in the Sketch Recognition Lab for their valuable feedback throughout my Masters. In particular, I would like to thank Paul Taele and Shalini Ashok Kumar who were part of the project and have given their comments during the course of this research.
TABLE OF CONTENTS Page ABSTRACT . . . ii DEDICATION . . . iii ACKNOWLEDGEMENTS . . . iv TABLE OF CONTENTS . . . v
LIST OF FIGURES . . . vii
LIST OF TABLES . . . ix
1. INTRODUCTION . . . 1
2. RELATED WORK . . . 5
2.1 Sketch-based Tutoring System . . . 5
2.2 Drawing Gaming Applications . . . 6
2.3 Drawing Instruction Applications . . . 7
2.4 Sketch Recognition . . . 8
2.5 Education Theory and Learning . . . 10
3. SYSTEM INTERFACE . . . 13
3.1 Lesson Plan . . . 13
3.1.1 Lessons Section . . . 13
3.1.2 Challenges Section . . . 15
3.1.3 Sketchbook . . . 17
3.2 Drawing and Submission Tools . . . 18
3.2.1 Real-time Feedback . . . 18 3.2.2 Automatic Submission . . . 20 3.2.3 Review Panel . . . 21 3.2.4 Undo Button . . . 22 3.3 Learning Assistance . . . 23 4. METHODOLOGY . . . 25 4.1 Evaluating Recognition . . . 25
4.2 Evaluating Learning . . . 26 5. RECOGNITION SYSTEM . . . 27 5.1 Sketch Representation . . . 27 5.2 Preprocessing . . . 27 5.2.1 Resampled Points . . . 28 5.2.2 Resampled Time . . . 28
5.2.3 Overtracing and Overdrawing . . . 28
5.3 Recognition Algorithm . . . 29 5.3.1 Rectangles . . . 30 5.3.2 Planes . . . 32 5.3.3 Cubes / Cuboids . . . 32 5.3.4 Circle . . . 35 5.3.5 Ellipse . . . 37 5.3.6 Cylinder . . . 39
5.4 Analysis and Results . . . 39
5.4.1 Recognition Efficiency Results . . . 39
5.4.2 Analysis . . . 41
5.4.3 User Interface Modifications . . . 45
6. PROGRESSIVE LEARNING . . . 48
6.1 Characteristics of a ”Good” Sketch . . . 48
6.2 Features Selected . . . 49
6.3 Results . . . 49
6.4 Discussion . . . 52
6.4.1 Outliers . . . 55
6.4.2 Lesson-wise Deviation Results . . . . . . . 59
6.4.3 Overall Student Performance Results . . . ... . . 60
7. FUTURE WORK . . . 61
8. CONCLUSION . . . 62
LIST OF FIGURES
FIGURE Page
2.1 The circled application [84] . . . 6
2.2 Learn to draw [61] . . . 7
2.3 Draw this application [46] . . . 8
3.1 PerSketchTivity login page . . . 13
3.2 Basic shapes . . . 14
3.3 Perspective shapes . . . 15
3.4 Primitive shapes . . . 16
3.5 Perspective challenges . . . 16
3.6 Face drawing challenges . . . 17
3.7 Free body challenges . . . 18
3.8 Symmetry challenge with feedback . . . 19
3.9 Sketchbook tools . . . 19
3.10 Stroke color feedback . . . 20
3.11 Review panel showing previously submitted sketches . . . 22
3.12 Planes lesson with guidelines . . . 24
3.13 Gradual removal of scaffolding for the circles lesson . . . 24
5.1 Line recognized . . . 29
5.2 Curve recognized . . . 30
5.3 Rectangle recognized . . . 30
5.5 Cube recognized . . . 35
5.6 Rectangle recognized . . . 37
5.7 Ellipse recognized . . . 38
5.8 Circle in perspective inscribed in a square . . . 38
5.9 Cylinder recognized . . . 40
5.10 Bar chart showing recognition efficiencies and exception . . . 41
5.11 Example of missing bottom face . . . 42
5.12 Example of front two bottom face edges missing . . . 42
5.13 Example of missing hidden edges . . . 43
5.14 Example of dotted hidden edges . . . 44
5.15 Example of combination sketch . . . 44
5.16 Incomplete cube feedback . . . 46
5.17 Dotted lines feedback . . . 47
6.1 Outlier example 01 . . . 56 6.2 Outlier example 02 . . . 56 6.3 Outlier example 03 . . . 57 6.4 Outlier example 04 . . . 57 6.5 Outlier example 05 . . . 58 6.6 Outlier example 06 . . . 58 6.7 Outlier example 07 . . . 59
LIST OF TABLES
TABLE Page
5.1 Recognition results . . . 40
5.2 Recognition results after system update . . . 45
6.1 Total submissions . . . 50
6.2 Minimum deviation results, per student comparison . . . 51
6.3 Average minimum deviation results, per student . . . 52
6.4 Maximum speed results, per student comparison . . . 53
6.5 Average maximum speed results, per student . . . 54
6.6 Accuracy - speed trade-off . . . 54
6.7 Number of outliers . . . 55
6.8 Lesson-wise deviation results . . . 60
1. INTRODUCTION
The education system in the 21st century is undergoing rapid change, especially engineering education. In order to achieve success, students are required to think more broadly and approach problems from multiple viewpoints [19]. Creativity, invention, and innovation have been recognized to be indispensable qualities of en-gineering [29]. Sketching plays a critical part in allowing engineers to visualize and effectively communicate their design ideas to other engineers. The ability to visu-alize and draw combines multiple modalities of learning. These learning modalities include the kinesthetics (muscle movement and memory) and visual spheres (spa-tial reasoning). Drawing has the power to access these modalities simultaneously in order to formalize and communicate ideas [36]. Engineering education is highly logic and mathematics based, and when combined with drawing helps access knowl-edge through aesthetic and social inquiry. When used in combination with analysis and mathematical models, engineering drawing has the potential to enhance cre-ative output. It is this cross-linking of modalities that leads to innovcre-ative concept solutions.
Engineers are often needed to explain their designs in an informal way, but they rarely are trained in the skills to do so. This is because modern engineers are often trained solely through CAD-based systems, and are less familiar with traditional drawing and drafting techniques. CAD-based formats take longer to create, as stu-dents often struggle with small details. The CAD interface is certainly far less intuitive than the simple pencil and paper, however creating an effective pencil and paper sketch requires a certain amount of sketching ability. There is a great advan-tage to providing engineers with sketching skills needed to quickly communicate their
designs effectively in three dimensions. Having stated that, the value of sketching in designing is not merely limited to the communication, ideation, and polishing of visu-alized concepts to diverse fields. Such practical purposes to learners include a rapid exchange of ideas and improved visual communications that benefit internal thought processes [81], improve students’ general academic achievement and problem-solving thinking [104], elevate awareness of and attention to details of surroundings [64], hone analytical skills [24], stimulate both halves of the brain [78], improve peripheral skills in writing, critical thinking, and brainstorming when integrating sketching in their thought processes [24], as well as boost self-confidence in other academics from successful artistic pursuits [49], and improve three-dimensional spatial recognition skills [83].
“Learning for mastery” is a term coined by Benjamin Bloom which refers to a method of instruction that ensures students master each basic component of a sub-ject before heading towards more advanced ones. The aim is to reduce the difference in achievement among varied groups of students. In mastery learning environments, students are not competing against each other or some kind of reference line, but rather they are competing with themselves so they can become their personal best. Learning to sketch benefits from the same approach, as students need to first learn the basic shapes like lines, circles, and ellipses, before advancing to more complex combined forms like cubes, cylinders, etc. Mastery in sketching involves understand-ing how to sketch the different forms, the development of hand-eye coordination, and most importantly, a great amount of time spent practicing [99].
When learning fundamentals of design sketching, there are various resources that students have at their disposal. The classroom setting is one such resource, where design sketching is traditionally taught in studio environment; experienced instruc-tors teach drawing basics and the students practice on their own to present in front
of their peers for feedback. However, valuable expert feedback from instructors is less available as classroom size increases and less accessible beyond classroom and instructor office hours [27]. An additional constraint is that, those students who have low self-efficacy – or the level of confidence that people have in their ability to com-plete a certain task [8] – are less motivated to participate and comcom-plete tasks given when they are learning in such classroom environment [59]. Learning design sketch-ing is no different, as sketchsketch-ing in general is significantly affected by self-efficacy such that students with low-efficacy are less confident to improve, unmotivated to prac-tice, and discouraged when comparing their drawings to those of their more skilled peers [44].
Advances in artificial intelligence are opening up immense possibilities to cre-ate computer-based tutoring systems in sketch-based domains that can perceive and understand free hand sketches as humans do [40]. A sketch-based tutoring system in a classroom environment can encourage students to practice sketching that can improve internal thought processes for visual communication [91], three-dimensional spatial recognition skills [83], attention to detail of surroundings [64] and improve self-efficacy in successful artistic pursuits [49]. PerSketchTivity is an online stylus and touch capable interface that combines traditional design sketching instructions with state-of-the-art sketch recognition techniques to provide guidance and instant feedback as students learn the basics of free-hand sketching. PerSketchTivity com-bines the advantages of the traditional pedagogy with sketch recognition in order to provide students with an intuitive practicing platform that gives real-time visual feedback. The goal of this research is to answer three specific questions:
• How efficient is the recognition system in recognizing the correctness of the submitted sketches, i.e., can the computer understand what the human drew
so that it can provide effective feedback?
• How can the recognition of the system be improved?
2. RELATED WORK
Constant development in computing technologies enables researchers and devel-opers to build digital systems that can widely benefit domains related to design sketching. This technological growth is highly evident in hardware devices that have widened the horizon for design sketch interactions like digital stylus devices, tablets, touchscreen displays, and web-based academic tools, instructional apps, and intelli-gent tutoring systems.
2.1 Sketch-based Tutoring System
There are sketch-based tutoring systems that not only are related to drawing and sketching instructions but also to educational disciplines outside of drawing instruction like mechanical engineering [95, 73, 6, 5, 93, 96, 60, 32, 65, 94, 52], East Asian languages [86, 88, 89, 90], music [87], mathematics [50], and the military [43, 42, 20, 41, 22]. There are such systems for other domains [74] and also for children [97, 70]. These educational systems use a sketch-based interface for users to submit hand-drawn symbols or diagrams, which are assessed, and users are provided with a feedback.
Sketch-based Intelligent Tutoring System such as iCanDraw [25] and EyeCan-Draw [21] also provide drawing or sketching instruction focusing specifically on hu-man figure art drawing and give intelligent step-by-step instructions on how to draw human faces and eyes, respectively. More recent systems have followed up on these systems with their work by incorporating larger drawing options [48], enhancing creative expression of reference models [10], or by providing more detailed features for drawing [103]. In general, these systems focus on improving drawing skill of art figures as opposed to improving precision in drawing skills for design sketching.
Nevertheless, these systems provide valuable insights into interaction design practices and sketch-based user interfaces.
2.2 Drawing Gaming Applications
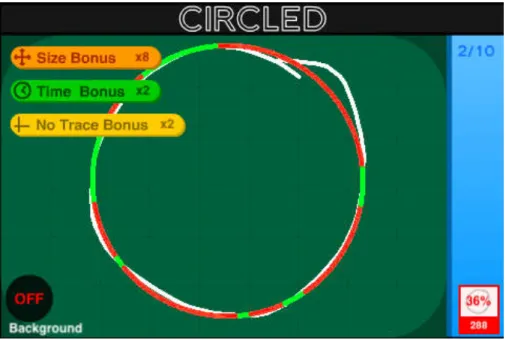
One of the drawing gaming applications is Circled [84] developed by Underbeak1, which is an application where the objective is to draw accurate circles. Based on the accuracy of the circles drawn by the user, new modes and levels are unlocked. Figure 2.1 shows a screenshot of the application with the accuracy feedback. Though the application does provide feedback, it is limited to only accuracy, and only circles. For effective assessment of sketching ability, more shapes and more nuanced feedback are necessary.
Figure 2.1: The circled application [84]
Draw Something [67] is a multiplayer game that allows its users to sketch and 1http://www.underbeak.com/
have others guess what they sketched. This game can prove to be a very good tool to improve visual communication skill. Having said that, it does not teach users sketching technique conceptually, does not have a professional approach, and neither does it assess the submitted sketches in any way.
2.3 Drawing Instruction Applications
Learn to Draw Sketchbook by Walter Foster [61] is a drawing instruction appli-cation that focuses on fine art style of drawing. I consists of step-by-step tracing approach to teach drawing. The step-by-step approach is effective, however it does not teach to draw from imagination or perspective sketching and relies purely on trac-ing. The application lacks performance assessment of the users. Figure 2.2 shows the screenshot of the application.
Figure 2.3: Draw this application [46]
Draw This App from Peter Hamilton [46] is another application that also uses step-by-step guidance approach. This application incorporates accuracy metrics on traced shapes as shown in Figure 2.3. The downside of this application is that it forces users to draw shapes in a certain way that does align with the techniques taught and used in design sketching. Another downside is that it relies purely on tracing of shapes. It does not help users understand 3-dimensionality and perspective. The assessment does not help users to understand which areas to focus on which means it has very limited assessment capability.
2.4 Sketch Recognition
PerSketchTivity encourages students to practice shapes in a progressive manner where in they start with basic shapes like lines, rectangles and circles, and proceed to complex shapes like cubes and cylinders in two-point perspective. The recognition
system recognizes if the expected correct shape is drawn, in that it identifies which stroke represents which part of the shape.
Sketch recognition can be broadly categorized into two parts: geometric recogni-tion [71, 39] and gesture recognirecogni-tion [76, 100, 58, 23, 17, 18]. Geometric recognirecogni-tion algorithms recognize the shapes by computing their geometric properties while ges-ture recognition algorithms recognize shapes by the gesges-tures made to draw them (i.e., the path of the pen or finger). Some of these are discussed below.
The Rubine recognizer [76] consists of 13 novel sketch-based features integrated into a weighted linear discriminator that classifies single stroke sketches centered on a training set. It considers features that humans perceive visually in shapes and learns the shape. The major limitation of the recognizer is its sensitivity towards orientation and scale, and its inability to recognize multi-stroke sketches.
The $1 algorithm [100] compares given sketch to a template set and returns a list of shapes ordered from closest match to least based on the distance value. Prior to the calculation of the distance, the $1 recognizer first changes the orientation and scale bringing it into the same ‘frame of reference‘ as the templates. The $N recognizer [3] was created to overcome the limitations of the $1 recognizer, such as the sensitivity to drawing direction and the inability to recognize multi-stroke shapes and one dimensional, multi-directional shapes (e.g., lines). Despite the improvements, the $N recognizer still fails when the shape is drawn with different number of strokes than those in the templates.
A multistroke recognizer based on HMM (Hidden Markov Model) [2] recognizes sketches without the need for segmentation before recognition. Since HMMs function for sequences, this recognizer cannot be used for domains where the order of strokes is not known. It is also sensitive to orientation as it recognizes shapes in the trained orientation.
There are various other recognizers that have been built that use other features like entropy [11], geometric based features with confidence values [72], and haus-dorff distance [51]. Multistroke recognizers with corner finders have been built like Shortstraw [101], Douglas-Peucker [26], Paleosketch [71], Sezgin [80], Kim [53] and a combination of all [102].
2.5 Education Theory and Learning
Visual and spatial thoughts, and their coordination, are essential for scientific and engineering innovation [31]. The coordination facilitates understanding because there are separate complementary cognitive channels for each type of representation [68, 77]. Thus, when information is coordinated between verbal and nonverbal, one can process more information simultaneously as the size of the working memory is usually the limiting factor [7]. This in turn reduces the cognitive load [85]. In case of a very difficult task, the intrinsic cognitive load is large as is often the case with engineering concepts. The presentation format of material or extrinsic cognitive load should be well designed for such tasks. Cognitive loads decrease with mastery. Engineers should be skilled in visual representation. Sketching is an integral part of life of Industrial designers and engineers [92].
Feedback has always been considered a critical tool in information-processing view of learning. Learners can identify misconceptions in their learning with the help of feedback. Feedback guides the learner to a more accurate conception of learning [56]. Feedback was found to be the single most powerful predictor for stu-dent success in a seminal meta-analysis regarding competing influences on stustu-dent achievement [35]. Large engineering classrooms, typical of low-level classes at many public universities, make it impossible to provide adequate feedback. It is not only a very time consuming task to give feedback individually to students, but also the
availability of instructors for feedback is limited to classroom and office hours [28]. Furthermore, formative feedback, (in contrast to summative feedback) emerged as the most valuable type of feedback [13]. Formative feedback is given to learners in the midst of the learning process, allowing them adjust their thinking and consider their own misconceptions [15]. Assignment problems can be considered as opportu-nities for formative feedback. On the contrary, summative feedback occurs at the end of the learning process like final exam. In large classroom scenarios, it is difficult for an instructor to provide frequent and timely feedback [37]. In such scenarios, it is a major challenge to raise the levels of self-efficacy of the students to improve their levels of achievement and engagement [45], which require just-in-time forma-tive feedback. Sketchbooks have proven to be an effecforma-tive tool to learn sketching as they provide both portability and accessibility for students to practice their design sketching regularly and continuously [69]. Therefore tools, such as PerSketchTivity, can help provide formative feedback by giving students guidance within the problem solving process.
A meta-analysis of studies comparing immediate and delayed feedback concluded the overall superiority of the immediate timing of feedback [57]. Delayed feedback may become irrelevant as students may have moved on to new content. The benefit of immediate feedback has been found across many populations, including PerS-ketchTivitys target population of undergraduate college students [37]. It has also been found that one of the essential elements for an Intelligent Tutoring System (ITS) is to provide immediate feedback to the students to help in identifying the er-rors and guide them towards better understanding of the concepts [9]. For example, with undergraduate science students, an intervention comprised of repeated practice with immediate, computer-based feedback, enabled previously identified weaker stu-dents (N = 197) to outperform the stronger stustu-dents (N = 417) on immediate and
subsequent exams [82]. The question of timing is made complex due to the inter-actions with the type of feedback. For example, if corrective feedback occurs too quickly, students will not have a chance to evaluate their thinking [63].
3. SYSTEM INTERFACE
This chapter provides details of PerSketchTivity’s system interface (Figure 3.1 shows the login screen), the tools provided in the system, and the assistance pro-vided to the students to learn design sketching concepts. This detail is helpful in understanding the tool itself and the design principles behind the software design.
Figure 3.1: PerSketchTivity login page
3.1 Lesson Plan
3.1.1 Lessons Section
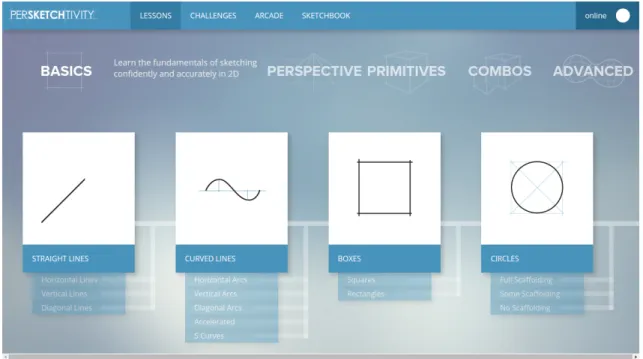
PerSketchTivity’s sketching lessons are structured progressively, starting with ba-sic concepts and building up to more advanced lessons. The implemented lessons are
Figure 3.2: Basic shapes
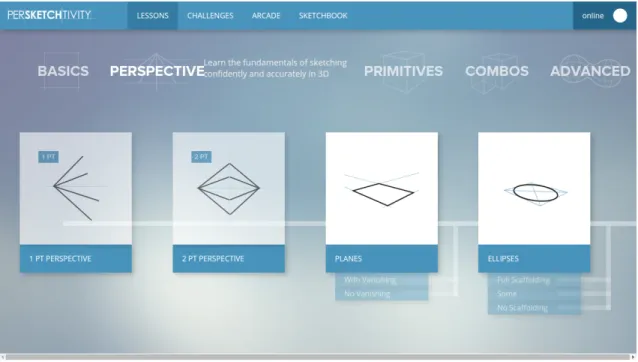
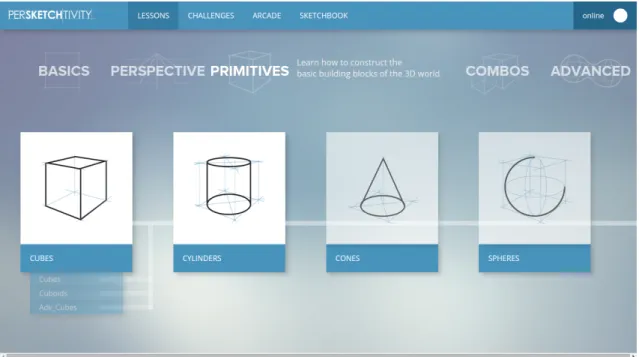
grouped into basic (Figure 3.2), perspective (Figure 3.3), and primitive shapes (Fig-ure 3.4). Basic shapes include lines, curves, rectangles, and circles, while perspective shapes include planes and ellipses (circles in perspective), and primitives include cubes and cylinders. Each lesson consists of sub-lessons, which have variations in angles, subtypes and vanishing points visibility (perspective). For example, lines can be horizontal, vertical, or at an angle, and solid boxes could be cubes or cuboids. Once students begin a lesson, a set of basic instructions is displayed introducing the lesson and they are then taken to the exercises. There are eight exercises in one instance of a lesson, each of which are procedurally generated variations of the same base problem. Parameters that are varied between each permutation include length, angles, size, rotation about an axis, or location in 3D space (perspective). Once the system recognizes the completion of the desired shape, real-time feedback is displayed. At the end of each lesson, a cumulative feedback of all eight exercises
is displayed. The scores of three criteria - error, smoothness, and speed, which help in analysing the grade for the students, are shown.
Figure 3.3: Perspective shapes
3.1.2 Challenges Section
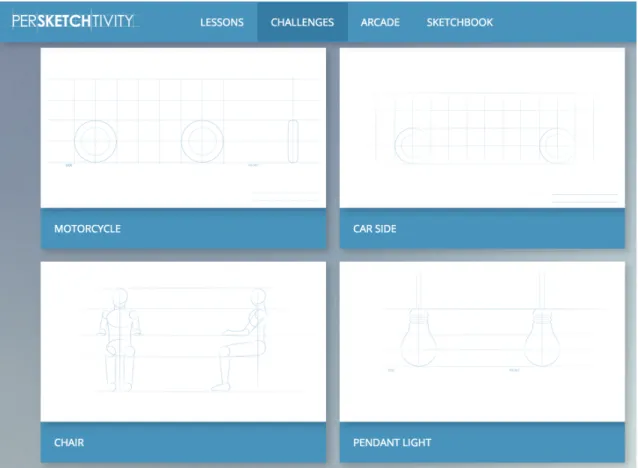
The “Challenges” seeks to improve creativity and give learners an opportunity to try out the skills theyre learning (Figures 3.5, 3.6, and 3.7). Basic guidelines are provided in the challenges. and the students are encouraged to test their creativity and design skills. Students can also practice drawing symmetrical shapes in the symmetry challenge(Figure 3.8). A sketchbook is provided as well for the students to draw free form sketches (Figure 3.9).
Figure 3.4: Primitive shapes
Figure 3.6: Face drawing challenges
3.1.3 Sketchbook
The Sketchbook is a blank canvas that is provided for the students to showcase their creativity and perhaps practice what they have learnt without any guidelines. Students can save their sketches or erase them at will (Figure 3.9). Different types of markers and pen sizes are provided for sketching. The students are also provided with a grid that can be toggled as and when needed.
Figure 3.7: Free body challenges
3.2 Drawing and Submission Tools
3.2.1 Real-time Feedback
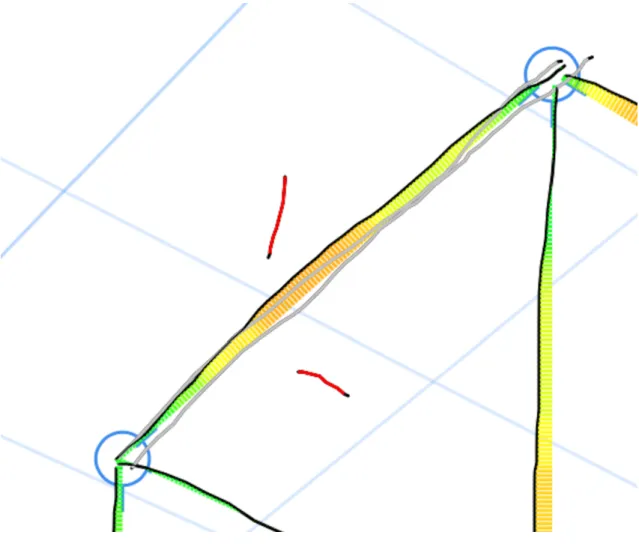
The real-time feedback is displayed in the form of error lines, which show the deviation of the drawn strokes from expected ideal strokes. The deviation is shown in the form of a gradient of colored lines varying from green to yellow to red; green representing the lowest deviation from the ideal stroke and red being the largest. The application recognizes strokes and displays visual feedback with the help of sketch recognition algorithms. For example, in the cubes lesson, the recognizer identifies stray strokes (strokes that are not a part of the shape and might have been drawn
Figure 3.8: Symmetry challenge with feedback
Figure 3.9: Sketchbook tools
unintentionally) and retraced strokes (strokes that were part of the shape but were retraced). Stray strokes are displayed red in color and retraced strokes are displayed
grey in color (Figure 3.10). In this case, red is used to indicate incorrectness, and grey indicates the input is recorded, though not evaluated as a part of the drawn shape, similar to a residual mark left by an erased pencil stroke on paper.
Figure 3.10: Stroke color feedback
3.2.2 Automatic Submission
In lessons, while students can use any number of strokes to complete any as-signment, the students should draw each line in one stroke and with consistent arm
motion from the starting point to the ending point. Ideally, the arm will stay in this position while moving from one example to the next. To ensure consistency in the arm motion while sketching, the application automatically submits the drawn sketch once it recognizes the shape as complete, giving real-time feedback without the need to press a submit button in most cases. Thus, the students dont need to move their arm away from the drawing canvas to click the next button to submit their sketches. The next task is shown after a delay time proportional to the complexity of the shape to give the students enough time to take note of the feedback displayed. To ensure there is no loss of sketching data, the application also has a manual button for submissions in the event that the system fails to submit the sketches automat-ically. This button is dynamic in its functionality; if the student has yet to start drawing and wishes to skip an exercise, the button can be used to skip the current exercise. However, once the student starts drawing, it automatically becomes the manual submission button.
3.2.3 Review Panel
It can be useful to be able to analyze one’s previous submissions and feedback at any time as one progresses through a lesson. Hence, a review panel is included to the left of the drawing canvas (Figure 3.11). The review panel displays the students submitted sketches. The students can click on the display of their submitted sketch in the panel to review the sketch if they need more time to take note of the feedback. The drawing canvas gets converted to a review screen where the selected sketch is displayed for review. Once the student is done reviewing, the screen can be closed and the drawing canvas is displayed with the next exercise. This way the students can always go back to their submissions between the exercises in order to analyze where they might be going wrong, and to correct themselves in further exercises.
Figure 3.11: Review panel showing previously submitted sketches
3.2.4 Undo Button
Sketching on a computer screen is different from sketching on a paper. There is less friction on a screen than there is on paper, which can cause the pen to slip and lead to unintended strokes. In order to allow the students to erase such strokes, the application has an UNDO button, which erases the last drawn stroke. There are two possible ways the button could function, either it could erase the entire sketch and let the student restart their sketch, or it could erase the latest stroke every time it is clicked like a conventional undo button. There is a possibility of the students overusing the undo button in order to submit more accurate sketches by erasing and redrawing till they get it right. The instructors want to discourage this, encouraging fluid sketching without undoing sketches. To avoid such situation, the application allows the students to use the undo button only once throughout each exercise, and erasing only the latest stroke. This is an experimental design decision and was made with an intention allowing students only limited modification after
making observations of students usage of the button during class sessions. 3.3 Learning Assistance
The variations in the exercises help practice the shapes with different arm mo-tions. Muscle memory plays a role when learning to draw certain fundamental shapes like circles and ellipses. With repetition and practice, these shapes become easier to sketch, and from there more complex shapes and combinations of shapes become eas-ier as well [75]. This way the students develop muscle memory of the basic shapes with variations which would eventually make it easier for them to draw complex shapes comprised of different overlapping basic shapes. Guidelines are provided in the exercises in the form of scaffolding to help students sketch the shapes concep-tually (Figure 3.12). The feedback is removed gradually as the students advance through the sub-lessons (Figure 3.13). This is similar to training wheels on a bike; scaffolding acts as a helping hand in the beginning, and can be weaned off of once the student becomes more proficient. A standard perspective grid is provided in all the perspective lessons to help the students visualize the shape in two-point perspective.
Figure 3.12: Planes lesson with guidelines
4. METHODOLOGY
The application was implemented as an additional tool in an “Introduction to Engineering Graphics” course at Georgia Institute of Technology, which includes a section on sketching. A set of 20 students were selected from the class to complete lessons in the system in place of assignments completed on paper by the rest of the class during the sketching portion of the class. The students were made to submit 20-25 sketches in every lesson in the following order for studying the impact of practicing shapes in a progressive manner:
• Lines - Squares - Cubes • Circles - Ellipses - Cylinders
4.1 Evaluating Recognition
The submitted sketch data was used to assess the performance of the recognition system. This indicated whether the computer interpreted the submitted data accu-rately and provided correct feedback to the students. The following scenarios are considered:
• Recognized sketches • Non-Recognized sketches
– Sketches were correct (all components of shape are drawn correctly) – Sketches were incomplete (some components of shape are missing) – Sketches were incorrect (all components of shape are not drawn correctly)
4.2 Evaluating Learning
Our system intends to encourage the “Learning for Mastery” approach where students compete with themselves to become a better version of themselves. Hence, to analyze whether this was achieved by our system, we split the submitted sketches data into two, with respect to time. The data was assessed within a lesson and among lessons in the order of their time stamps. The features to be evaluated were calculated for each set and compared with each other using paired t-test to find out if they significantly improved as the students practiced on the system. This will help us understand whether our design of lessons and the feedback that we provide in the system are significantly helping students to improve their drawing skills.
5. RECOGNITION SYSTEM
The goal at hand for the recognition system is to identify specific aspects of the sketch, i.e. recognize the correctness of the shape as opposed to classification of the shape drawn. Hence, the submitted sketches are assessed against the expected shape in the exercise.
5.1 Sketch Representation
Modern pen-based interfaces provide positional information along with current time in two dimensional coordinate system which is usually the window coordinates. The software generates a point as the pen or stylus moves over the input device. We record each of these points as the x-y coordinate along with its timestamp. The timestamp recorded is the epoch time which is time that has elapsed since 00:00:00 Coordinated Universal Time (UTC), Thursday, 1 January 1970 in milliseconds. A stroke is collection of time-ordered points which are between the pen-up and the pen-down events. A sketch is comprised of one or more strokes and defined as a shape when it satisfies geometric constraints recognized by our software.
5.2 Preprocessing
Before passing strokes to our recognition system, it is necessary to preprocess the strokes. Sezgin and Davis ( [79, 66]) state that the input strokes will contain noisy and inaccurate samples which are caused by spatial and temporal quantization of the input by the hardware. Spatial digital noise comes from conversion of ink positions to screen coordinates. The difference in the sampling rates of the operating system and the tablet causes temporal quantization errors. This motivates us to eliminate and decrease the problems caused by such noise and we resample points and time.
This helps subsequent steps in the process to be easier.
5.2.1 Resampled Points
The number of points sampled by the system depends on the speed of the pen movement. The number of points will be fewer when the speed is more and more when the speed is less. We use an algorithm similar to the $1 recognizer [100] with one difference. Instead of the target stroke having a fixed number of points, we resample in such a way that the points are equidistant from each other. We choose this threshold to be 2. We choose this technique to ensure that the feedback is consistent.
5.2.2 Resampled Time
The time-stamps recorded for the points of a stroke that was drawn really fast are not accurate. The time stamp remains the same for many of consecutive points. This causes problems while calculating speed as mentioned by Sezgin and Davis [79]. To solve this issue we resample time as well. We interpolate the time based on the distance between points for those that have same stamp by using the time-stamp of first point in the sequence of points having same time and the first point after this sequence.
5.2.3 Overtracing and Overdrawing
Overtracing is the technique of drawing beyond and/or over the already drawn stroke. This is a natural way of drawing closed shapes like circles and ellipses. In the specific case of a circle, it is usually observed that the end of circle overlaps with the beginning of the stroke. To facilitate this while keeping in mind the recognition and evaluation components of the system, we allow users to overtrace provided it is within some threshold, and ignore the overtraced portion for our future processing
of the strokes.
For straight lines connecting two given end points, according to the instructors teaching the class, the correct technique of drawing in design sketching is to draw beyond the end points to make the line quality better. This technique is called overdrawing. In our system we allow students to overdraw, and the overdrawn stroke segments will be considered in further steps of recognition and evaluation.
5.3 Recognition Algorithm
For lessons which ask the student for a single stroke submission like lines and curves, the system assumes the sketch to be complete and calculates deviation of the sketch from the ideal shape before submitting it to the feedback system. Multi-stroked submissions are assessed using algorithms which are explained briefly in the following sub-sections.
Figure 5.2: Curve recognized
5.3.1 Rectangles
5.3.1.1 Corner Finding
Students are encouraged to draw each line separately, with parallel lines drawn se-quentially. This is because in two-point perspective, parallel lines are rarely actually parallel, but instead extend towards the same invisible perspective point. Nonethe-less, students often draw multiple lines in the same stroke. To find the corners in a single stroke, we:
• Find four points each closest to respective corners of the ideal plane.
• Check if the points are within a threshold distance from respective corners, if not reject the point.
• The points left which are within threshold are the corner points in the drawn stroke
5.3.1.2 Segmentation
Once the corners are identified, we need to split the lines in order to evaluate them. To segment the lines, we:
• Using the identified corner points between start and end of the stroke if any, segment the stroke into sub-strokes representing constituent lines.
• The final set of strokes is the set of all lines drawn.
5.3.1.3 Stroke Identification
Once the strokes are segmented, we need to determine which stroke or substroke is intended to draw which line of a shape. This is an increasingly complex action depending on the shape; i.e., this is trivial for lines, but quite complex for many cubes. To identify which line the user intended to draw for the stroke or sub-stroke, we:
• Identify which sub-stroke represents what edge of the plane by identifying the corners that lie in the stroke at the start and end. For example, if a stroke has a point somewhere in the beginning which is within a threshold distance of corner A and one close to corner B, the stroke represents the side A-B. • If all the edges of the plane have been identified as drawn by the user, the
shape is recognized as complete.
5.3.1.4 Deviation Calculation
Once each stroke or substroke is aligned with its ideal counterpoint, we need to determine the accuracy of that stroke.
• The perpendicular distance of each sampled point on the drawn stroke from the corresponding sampled point on the ideal shape is calculated.
• The calculated distances are recorded for all the sampled points on the drawn strokes and further processed for evaluation of the submitted sketch. An illus-tration of a recognized rectangle has been shown in Figure 5.3.
5.3.2 Planes
Planes recognition consists of the same step as the Rectangles. The only difference is the location of the corner points. In case of a rectangle it is Top-Left, Top-Right, Bottom-Left and Bottom-Right. In case of a plane it is Top, Bottom, Left and Right. An illustration of a recognized plane has been shown in Figure 5.4.
5.3.3 Cubes / Cuboids 5.3.3.1 Corner Finding
Cubes and cuboids contain many more lines than Rectangles and other shapes, as such, corner finding can be more complex. To find the corners in cubes and cuboids,
Figure 5.4: Plane recognized
we:
• Find 12 points on the drawn stroke which are each closest to respective corners of the ideal cube.
• Check for each point if it lies within a threshold distance from its corresponding corner point, if not reject the point.
• The points left are the corners in the stroke.
5.3.3.2 Segmentation
To segment the strokes into the appropriate substrokes, we:
• Using the identified corner points, segment the drawn strokes such that each sub-stroke represents a line.
• If there are no corners between the start and end corners in the stroke, the stroke itself is a line.
5.3.3.3 Stroke Identification
• Each sub-stroke is processed to identify which two corner points it joins.
5.3.3.4 Stroke Categorization
Often the situation is not as simple as it may seem, and becomes increasingly difficult when students draw lines with multiple strokes, retrace their previously drawn strokes, use dotted lines to draw a stroke, or have accidental lines on the screen:
• If a stroke does not join two adjacent corner points, it is categorized as rejected stroke.
• Among the rejected strokes, if there are two consecutive strokes each consisting of adjacent points at the start and end respectively, both of them are then removed from rejected strokes and categorized as strokes to be combined. A-X + X-C = A-C. This is to account for cases where the user draws one side with two strokes in continuation.
• If a stroke joins two adjacent corner points, it is categorized as correct stroke. • If more than one correct stroke represents the same side of the cube, the latest stroke is categorized as correct stroke while all the other strokes are categorized as retraced/outdated strokes.
• If two edges of the cube overlap in two point perspective view, it is considered a special case. For example, as shown in the figure, it accepts C as a corner (A-B-C-D) but rejects B, as it is not supposed to be adjacent to A or C. An extreme case where a stroke is drawn from A to E, it could either be considered as side A-C or B-E. In this case, it picks the one with shorter overdraw.
Figure 5.5: Cube recognized
5.3.3.5 Deviation Calculation
To calculate the error, we:
• The perpendicular distance of each sampled point on the drawn correct strokes from the corresponding sampled point on the ideal strokes is calculated. • The calculated distances are recorded for all the sampled points for all the
strokes and further processed for evaluation of the submitted sketch. An illus-tration of a recognized cube has been shown in Figure 5.5.
5.3.4 Circle
The ideal circle is inscribed within a square with diameter of circle equal to the sides of the square.
In order to accurately recognize circles drawn with multiple strokes or other complexities, we:
• Merge strokes: The circle lesson supports multi-strokes drawn in any direc-tion(clockwise or anticlockwise). After each stroke is drawn it is merged with the previous strokes and passed to the next stage of the algorithms.
• Find major and minor axis: Two points on the strokes that are farthest from each other form the major axis. The two points on the line perpendicular to this through the midpoint of major axis are endpoints of the minor axis. • Calculate the radius and the center of the circle: The mean of the radius of the
major and minor axis is the radius. The point of intersection of the two axes is the center.
• Check for overtracing: The distance and the center angle between first and last point on the stroke is calculated. If the distance between first and last point is less than a threshold, and a percentage of radius and the angle formed at center by the first and last points is less than threshold B, the sketch does not have any overdrawing. Otherwise it is cropped.
• Crop circle: Check for the closest point in last 25% of the stroke. If closest point makes an angle of less than 10 degrees, then crop till that point.
• Calculate the path length of the cropped circle and the circumference of the expected circle with calculated radius. The circumference = 2∗π∗radius
• The sketch is a circle if : The ratio of major axis to minor axis is less than a 0.3 and the ratio of actual circumference of the expected circle to circumference of the sketch is between 0.7 and 1.4.
• Calculate the error.
An illustration of a recognized circle has been shown in Figure 5.6.
Figure 5.6: Rectangle recognized
5.3.5 Ellipse
Finding the reference ellipse: An ellipse is a circle in perspective. Ellipse conforms to sames rules as a circle. We try to draw ellipse using a square in 2 point perspective. • Merge strokes: The circle lesson supports multi-strokes drawn in any direction (clockwise or anticlockwise). After each stroke is drawn, it is merged with the previous strokes and passed to the next stage of the algorithms.
• Find major and minor axis: The two points on the strokes which are farthest from each other form major axis. The two points on the line perpendicular to
Figure 5.7: Ellipse recognized
the major axis and through the midpoint of the major axis are defined as the endpoints of the minor axis.
• Calculate the center of the ellipse: The point of intersection of the two axes is the center.
• Calculate the path length of the drawn ellipse and the circumference of the ideal ellipse using the calculated major and minor axis. The circumference =π(3(a+b)−p
(3a+b)(a+ 3b));
• The sketch is an ellipse if the ratio of the actual circumference of the ideal ellipse to circumference of the sketch is between 0.7 and 1.3.
• Calculate the error.
An illustration of a recognized ellipse is shown in Figure 5.7.
5.3.6 Cylinder
In order to recognize a cylinder, we:
• Recognize the two ellipses (flat faces) and two straight lines (curved face). • Checks if major axes of ellipses are parallel and the lines are parallel.
• Recognizes shape as complete, calculates deviation of the sketch from the ideal shape, and submits it to the feedback system.
An illustration of a recognized cylinder has been shown in Figure 5.9. 5.4 Analysis and Results
5.4.1 Recognition Efficiency Results
The submitted sketches were evaluated to analyze how efficiently was the system able to assess the sketches submitted by the students and provide correct feedback.
Figure 5.9: Cylinder recognized
These results have been illustrated in Table 5.1 where efficiency is the ratio of number of sketches recognized (assessed correctly) to the total number of sketches submitted. The bar chart of the recognition results is shown in Figure 5.10.
Table 5.1: Recognition results
Shapes #Completed sketches #Recognized Efficiency
Rectangles 314 311 0.99044586 Circles 919 914 0.994559304 Ellipses 567 566 0.998236332 Planes 64 63 0.984375 Cubes/Cuboids 251 224 0.892430279 Cylinders 615 608 0.988617886
Figure 5.10: Bar chart showing recognition efficiencies and exception
5.4.2 Analysis
All the recognition algorithms have the efficiency greater than 98% except cubes or cuboids. An analysis of the submitted cubes and cuboids sketches showed that the students either misinterpreted the guidelines or drew the shape in a way that was unexpected.
There were around 55 sketch submissions in total which made it evident that students misinterpreted the given guidelines in the exercises.
There were broadly three cases
-• Bottom face : The bottom face in the guidelines provided in the cube exercise has been shown with solid blue lines for facilitating better visualization of the cube. The students were expected to draw the bottom face nevertheless. Among the 55 sketch submissions, there were 21 sketch submissions that were not recognized because the bottom faces were not drawn. An illustration of such sketches has been shown in Figure 5.11 and Figure 5.12.
Figure 5.11: Example of missing bottom face
• Hidden edges :
– Edges were not drawn : There were 16 sketches which were not recognized because the hidden edges were missing. An illustration of such sketches has been shown in Figure 5.13.
Figure 5.13: Example of missing hidden edges
– Edges were drawn with dotted lines : There were 13 sketches which were not recognized because the hidden edges were drawn with dotted lines. An illustration of such sketches has been shown in Figure 5.14.
• Combination of both : There were 5 sketches which were not recognized because the hidden edges and the bottom face were missing . An illustration of such sketches has been shown in Figure 5.15.
Figure 5.14: Example of dotted hidden edges
Modifications were made such that the system always gives feedback on the sub-mitted cube even when not recognized. In such cases, the sketch is assessed to identify why the cube wasn’t recognized and give back appropriate feedback. After the modifications were made to the algorithm, the system was again tested on the submitted sketches. In this case, the efficiency is ratio of the number of times the computer recognized both the correctness and incorrectness of the sketch to the total number of sketches. The results are shown in Table 5.2.
Table 5.2: Recognition results after system update
Shapes #Sketches #Correct Feedback Accuracy
Cubes/Cuboids 251 244 0.972112
We now have a better assessment system, that can provide real-time feedback with accuracy of greater than 97% for all the lessons. We still have some difficulties with the dashed and stray lines, which will be focused on in greater detail in future work.
5.4.3 User Interface Modifications
The recognition algorithm has been modified to accommodate such unexpected sketch submissions. But since we also want the users to draw all of the lines, we now also identify this situation and help provide real-time feedback encouraging students to draw the cubes completely with all sides drawn using solid lines.
When a student submits an unrecognized sketch, the feedback system now by-passes the recognition system and processes the strokes to identify what went wrong. For example, if the total number of correct sides are lesser than 12, feedback is pro-vided saying “you missed some edges, draw all the 12 edges of the cube with solid
lines”. If there are consecutive empirical number of short strokes, feedback is pro-vided saying “all lines need to be solid”. A prototype of the feedback display has been shown in Figure 5.16 and Figure 5.17.
6. PROGRESSIVE LEARNING
6.1 Characteristics of a ”Good” Sketch
Buxton provides in-depth knowledge of the characteristics of a design sketch [16]. He defines sketches as having the following qualities:
• “Quick - A sketch is quick to make, or at least gives that impression.
• Timely - A sketch can be provided when needed.
• Inexpensive - A sketch is cheap. Cost must not inhibit the ability to explore a concept, especially early in the design process.
• Disposable - If you cant afford to throw it away when done, it is probably not a sketch.
• Plentiful - Sketches tend not to exist in isolation.
• Clear Vocabulary - The style in which a sketch is rendered follows certain con-ventions that distinguish it from other types of renderings.
• Distinct Gesture - There is a fluidity to sketches that give them a sense of openness and freedom.
• Minimal Detail - Include only what is required to render the intended purpose or concept.
• Appropriate Degree of Refinement - By its resolution or style, a sketch should not suggest a level of refinement beyond that of a project being depicted.
• Ambiguity - Sketches are intentionally ambiguous, and much of their value derives from their being able to be interpreted in different ways”
6.2 Features Selected
Based on the findings in previously conducted research on evaluation of sketches in PerSketchTivity, it was found that while deviation played an important role in motivating the students to practice more, speed played far more important role in evaluating the expertise in the sketches [4]. The features that were considered in the study were from motor-control studies ([33, 1, 62]) that included speed fluidity based on Fitts’ law ( [33, 34], [1],), accuracy based on vision based algorithm [100, 51], Hausdorff similarity [51], and smoothness based on Rubine features [76]. These features were assessed using subset selection [14] in Weka [38].
This motivated us to conduct an analysis of the sketches based on the average deviation and average speed to understand how these features changed with time as students practiced and the trade-off between these two features in actual act of sketching.
• Average Deviation: It is calculated by adding the deviations at every point and dividing it by the total number of points.
• Average Speed: It is calculated by using the total path length traversed by each of the strokes divided by the time taken to finish the whole shape, that is start time of the first stroke and the end time for the last stroke.
6.3 Results
The Table 6.1 illustrates the total submissions made by all students. It can be seen that all students submitted at least 200 sketches.
Table 6.1: Total submissions
Student Total sketches submitted
Student1 228 Student2 239 Student3 296 Student4 225 Student5 308 Student6 223 Student7 248 Student8 255 Student9 269 Student10 230 Student11 243 Student12 306 Student13 224 Student14 240 Student15 221 Student16 217 Student17 233 Student18 338 Student19 248 Student20 265
The minimum deviation in the values of first half of the submissions was tested against that of the second half of the submissions within a lesson to obtain the results in Table 6.2. This will help understand whether there has been a significant decrease in the deviation of the students’ submissions from the ideal sketches. p-values less than 0.05 are bolded in the table. The Table 6.3 shows the average deviation values in first half and second half of the sketch submission.
Maximum Speed, Per Student Comparison :
The maximum speed in the values of first half of the submissions was tested against that of the second half of the submissions within a lesson to obtain the results shown in Table 6.4. This will help understand whether there has been a
Table 6.2: Minimum deviation results, per student comparison Student p-value from paired t-test
Student1 0.0335 Student2 0.00009 Student3 0.048 Student4 0.01881 Student5 0.00121 Student6 0.0031 Student7 0.00196 Student8 0.0054 Student9 0.01099 Student10 0.42934 Student11 0.02467 Student12 0.27047 Student13 0.02758 Student14 0.04041 Student15 0.03559 Student16 0.04008 Student17 0.00387 Student18 0.01697 Student19 0.01716 Student20 0.47986
significant increase in the speed of the students’ submissions from the ideal sketches. This increase would directly correlate to the increase in expertise [4]. p-values less than 0.05 are bolded in the table. The Table 6.5 shows the average speed values in first half and second half of the sketch submission.
In order to understand if the students who performed well on one performed well in the other, the results obtained before were analyzed to against each other. If the students did not perform well in both, there is a trade-off between accuracy and speed for these students. There are 7 students who showed such trade off in accuracy and speed where they had significant improvement in one but did not perform well in the other. The results are shown in Table 6.6.
Table 6.3: Average minimum deviation results, per student
Student average deviation in first half average deviation in second half
Student1 7.274 5.05931 Student2 3.08307 2.55598 Student3 4.23146 3.39252 Student4 5.62794 4.31235 Student5 5.15834 3.8463 Student6 3.75965 2.37091 Student7 7.74398 6.04058 Student8 5.57052 4.05973 Student9 6.32179 4.7196 Student10 5.52209 5.42195 Student11 6.05081 4.1909 Student12 3.23658 3.00252 Student13 7.51179 6.15845 Student14 3.88818 2.86058 Student15 3.98669 2.73791 Student16 7.84048 4.9896 Student17 5.41012 4.15508 Student18 7.1516 5.14715 Student19 9.94872 8.78449 Student20 4.80398 4.73154 6.4 Discussion From the results obtained we have observed that:
• There was an improvement in accuracy in the students with about 85% students showing significant improvement.
• There was an improvement in speed in the students with about 75% students showing significant improvement.
• There were about 35% of the students who seem to have traded off between accuracy and speed.
Table 6.4: Maximum speed results, per student comparison Student p-value from paired t-test
Student1 0.01412 Student2 0.20623 Student3 0.03196 Student4 0.03268 Student5 0.1154 Student6 0.43478 Student7 0.00741 Student8 0.07239 Student9 0.02474 Student10 0.00332 Student11 0.00052 Student12 0.00698 Student13 0.04209 Student14 0.04052 Student15 0.14775 Student16 0.04922 Student17 0.03923 Student18 0.03242 Student19 0.00909 Student20 0.1851
• All except for one student (Student 20) improved significantly either in speed or accuracy.
• All students’ mean accuracy improved, even if some not to a significant level of increase.
• All student’s speed improved except one (Student 20), even if some not to a significant level of improvement.
There has been research on the trade-off between accuracy and speed in the motor skills while moving hand to a aimed target [62, 98, 105, 47]. We can see clearly even in our results that this kind of relationship exists in the act of sketching as well.
Table 6.5: Average maximum speed results, per student
Student average speed in first half average speed in second half
Student1 0.737767778 1.235583333 Student2 0.523703378 0.527773574 Student3 0.647880833 0.836723333 Student4 0.832915455 1.097491818 Student5 0.98159 0.9826825 Student6 1.052739046 1.068672283 Student7 0.904392939 1.092426005 Student8 0.673939812 0.875127758 Student9 0.465925455 0.529171818 Student10 0.664327519 0.77546554 Student11 0.679790682 0.873796477 Student12 0.566784466 0.712176298 Student13 0.9640775 1.059625833 Student14 0.362526667 0.642227778 Student15 0.35341563 0.378112366 Student16 0.71378 1.168750909 Student17 0.47980449 0.603066375 Student18 2.110821997 3.308176709 Student19 0.800862745 0.961939577 Student20 0.645291762 0.614033228
Table 6.6: Accuracy - speed trade-off
Student Deviation p-values Speed p-values
Student2 0.00009 0.20623 Student5 0.00121 0.1154 Student6 0.0031 0.43478 Student8 0.0054 0.07239 Student10 0.42934 0.00332 Student12 0.27047 0.00698 Student15 0.03559 0.14775
An improvement in accuracy shows improvement in their skill in drawing that shape accurately while an improvement in speed along with it shows an increase in their
expertise in drawing the shape in general. In order to encourage students to improve their speed while balancing their accuracy, additional feedback or instructions can be provided. Also, the exercises can be modified to incorporate a time factor that would encourage students to draw faster while the visual color feedback encourages them to draw more accurately. Such modifications can be further experimented.
6.4.1 Outliers
An analysis of the submitted sketches showed that there were some significant outliers in the data. The number of outliers in each lesson has been illustrated in Table 6.7. These outliers occurred because of students attempting to deliberately break or test the limits of the system. These could also be the reason for the few students not showing significant improvement in their skills as they deliberately drew wrong sketches to test the system’s limits as they became more comfortable with the system. Some examples of the outliers have been illustrated in Figure 6.1 - Figure 6.7.
Table 6.7: Number of outliers Lesson %outliers Horizontal Line 18
Vertical Line 14 Diagonal Line 11 Circle Full Scaffolding 4 Circle Some Scaffolding 0 Circle No Scaffolding 3
Rectangles 0
Cubes/Cuboids 0
Figure 6.1: Outlier example 01
Figure 6.3: Outlier example 03
Figure 6.5: Outlier example 05
Figure 6.7: Outlier example 07
6.4.2 Lesson-wise Deviation Results
In order to understand whether the students performed well in each lesson and if these outliers affected the overall accuracy of all students in each lesson, the deviation values for each lesson were analysed. The results have been illustrated in Table 6.8. In all the lessons, there has been a significant improvement in the overall accuracy of the students in all lesson types.
Further analysis of the results shows that in case of lines lesson, students showed more improvement in vertical lines lesson as compared to horizontal and diagonal lines lessons. This could be because of the inclination of the screen they were drawing on, which means gravity facilitated the vertical arm motion. In case of circles lessons, students showed most significant improvement in circles with no scaffolding. This could be interpreted as either students improve faster when without scaffolding or since they practiced the shape with scaffolding, it became easier for them to improve
Table 6.8: Lesson-wise deviation results
lessons min deviation p-values Horizontal Line 0.01855
Vertical Line 0.00008 Diagonal Line 0.02504 Circle Full Scaffolding 0.00301 Circle Some Scaffolding 0.00384 Circle No Scaffolding 0.00001
Rectangles 0.00382
Cubes/Cuboids 0.04161
Ellipses 0.03921
by the time they reached the lesson without scaffolding.
6.4.3 Overall Student Performance Results
The minimum deviation values and maximum speed values of all the students combined were compared from the first half to the second half of the submitted sketches using paired t-test. The results have been illustrated in Table 6.9. The difference in mean values indicates whether the value increased or decreased from the first half to the second half of the submitted sketches. We observed a significant performance improvement in both the features.
Table 6.9: Overall student performance results Student difference in mean p-values Accuracy 1.33832 0.00000 Speed -0.19862 0.00001
7. FUTURE WORK
We plan to introduce new lessons with more complex shapes like spheres, cones, and shapes made from a combination of primitive 3D shapes in two-point perspective. We also intend to include new feedback techniques and experiment with different instructional practices. In order to further analyze the improvement in the student’s drawing skills, we plan to collect expert sketch data and analyze the change in the sketch features with respect to those of the expert sketches.
Pressure is also an important criteria in sketching to understand the students intentions. In the future, a pressure sensitive device can be used to get pressure and line-weight related features. Signature verification is very similar to sketch recogni-tion and can be used for user identificarecogni-tion in PerSketchTivity. This field has had extensive research in the past, recognizing distinct identity of sketcher [30] and, the age and gender of the sketcher [54, 55, 55]. Pressure and other features, such as entropy [12] and eye gaze should be experimented with, to understand what benefits they reap for our study. These features can also be used to build a sketch-based biometric system.
8. CONCLUSION
In this research, we introduced our pen-based intelligent practice tool for design sketching called PerSketchTivity. Design sketching is an important skill for engi-neering and design students. The feedback given in a traditional classroom set up is limited to instructor’s availability and decreases the student’s self-efficacy. We designed an intelligent-tutoring system to help students to improve their sketching capability.
From data collected from 20 students, we performed statistical analysis on the recognition and assessment system to understand its accuracy in identifying the students’ intentions. We were able to identify where the recognition system lagged and have implemented modifications on the algorithm to improve the accuracy. We now have an assessment system which has accuracy over 97%.
We also conducted an analysis to understand the impact of the system on the drawing skills of the students. From the analysis, we can conclude that there was a significant improvement in accuracy in 85% of the students. We also observed a significant improvement in speed in 75% of the students. We were also able to identify that 35% of the students showed a off between accuracy and speed. The trade-off has been discussed and methods for overcoming have been reasoned out. In the lesson-wise analysis, we observed a significant improvement in performance in all the lessons. We conclude that our system was able to significantly improve the drawing skills of the students in terms of their accuracy and speed. Our system was successful in implementing “Learning for Mastery” approach in improving the students’ skills. With further practice and additional exercises, students can hone their drawing skills with our system.
REFERENCES
[1] Johnny Accot and Shumin Zhai. Beyond fitts’ law: Models for trajectory-based hci tasks. In Proceedings of the ACM SIGCHI Conference on Human Factors in Computing Systems, CHI ’97, pages 295–302, New York, NY, USA, 1997. ACM.
[2] Derek Anderson, Craig Bailey, and Marjorie Skubic. Hidden markov model symbol recognition for sketch-based interfaces. InAAAI Fall Symposium, pages 15–21, 2004.
[3] Lisa Anthony and Jacob O Wobbrock. $ n-protractor: a fast and accurate multistroke recognizer. In Proceedings of Graphics Interface 2012, pages 117– 120. Canadian Information Processing Society, 2012.
[4] Shalini Ashok Kumar. Evaluation of conceptual sketches on stylus-based de-vices. Master’s thesis, Texas A&M University, College Station, Texas, USA, 2016.
[5] Olufunmilola Atilola, Martin Field, Erin McTigue, Tracy Hammond, and Julie Linsey. Mechanix: a sketch recognition truss tutoring system. In ASME 2011 International Design Engineering Technical Conferences and Computers and Information in Engineering Conference, pages 645–654, Washington, DC, USA, 2011. American Society of Mechanical Engineers.
[6] Olufunmilola Atilola, Stephanie Valentine, Hong-Hoe Kim, David Turner, Erin McTigue, Tracy Hammond, and Julie Linsey. Mechanix: A natural sketch interface tool for teaching truss analysis and free-body diagrams. Artificial
Intelligence for Engineering Design, Analysis and Manufacturing, 28:169–192, 5 2014.
[7] Alan Baddeley. Working memory. Science, 255(5044):556–559, 1992.
[8] Albert Bandura. Self-efficacy: The exercise of control. Worth Publishers, New York, New York, USA, 1 edition, 1997.
[9] Robert L. Bangert-Drowns, Chen-Lin C. Kulik, James A. Kulik, and Mary-Teresa Morgan. The instructional effect of feedback in test-like events. Review of Educational Research, 61(2):213–238, 1991.
[10] Luca Benedetti, Holger Winnem¨oller, Massimiliano Corsini, and Roberto Scopigno. Painting with bob: Assisted creativity for novices. InProceedings of the 27th Annual ACM Symposium on User Interface Software and Technology, UIST ’14, pages 419–428, New York, NY, USA, 2014. ACM.
[11] Akshay Bhat and Tracy Hammond. Using entropy to distinguish shape versus text in hand-drawn diagrams. In IJCAI, volume 9, pages 1395–1400, 2009. [12] Akshay Bhat and Tracy Hammond. Using entropy to distinguish shape versus
text in hand-drawn diagrams. In Proceedings of the 21st International Joint Conference on Artifical Intelligence, IJCAI’09, pages 1395–1400, San Francisco, CA, USA, 2009. Morgan Kaufmann Publishers Inc.
[13] Paul Black and Dylan Wiliam. Assessment and classroom learning.Assessment in education, 5(1):7–74, 1998.
[14] Mary E Broadbent, Martin Brown, Kevin Penner, I Ipsen, and Rizwana Rehman. Subset selection algorithms: Randomized vs. deterministic. SIAM Undergraduate Research Online, 3:50–71, 2010.
![Figure 2.2: Learn to draw [61]](https://thumb-us.123doks.com/thumbv2/123dok_us/10984113.2986243/16.918.219.728.589.973/figure-learn-to-draw.webp)
![Figure 2.3: Draw this application [46]](https://thumb-us.123doks.com/thumbv2/123dok_us/10984113.2986243/17.918.234.715.132.502/figure-draw-this-application.webp)