Microstructural characterisation of normal and malignant human prostate tissue with VERDICT MRI
Abstract
Objectives Demonstrate the feasibility of the recently introduced VERDICT (Vascular, Extracellular and Restricted DIffusion for Cytometry in Tumours)
framework for imaging prostate cancer with diffusion-weighted Magnetic Resonance Imaging (DW-MRI) within a clinical setting.
Materials and Methods VERDICT is a non-invasive microstructure imaging technique that combines an in-depth diffusion MRI acquisition with a mathematical model to estimate and map microstructural tissue parameters such as cell size and density, and vascular perfusion. In total 8 patients underwent 3T MRI using 9 different b values (100-3000 s/mm2). All patients were imaged before undergoing biopsy. Experiments with VERDICT analysed DW-MRI data from patients with histologically confirmed prostate cancer in areas of cancerous and benign peripheral zone tissue. For comparison we also fitted commonly used diffusion models such as the Apparent Diffusion Coefficient (ADC), the Intravoxel Incoherent Motion (IVIM) and the Kurtosis model. We also investigated correlations of ADC and Kurtosis with VERDICT parameters to gain some biophysical insight into the various parameter values.
Results 8 patients had prostate cancer in the peripheral zone with Gleason score 3+3 (n=1), 3+4 (n=6) and 4+3 (n=1). The VERDICT model identified a significant increase in the intracellular and vascular volume fraction estimates in cancerous
compared to benign peripheral zone, as well as a significant decrease in the volume of the extracellular-extravascular space (EES) (P=0.05). This is in agreement with manual segmentation of the biopsies for prostate tissue component analysis, which found proliferation of epithelium, loss of surrounding stroma and an increase in vasculature. The standard ADC and Kurtosis parameters were also significantly
different (P=0.05) between tissue types. There was no significant difference in any of the IVIM parameters (P=0.11 to 0.29). VERDICT parametric maps from voxel by voxel fitting clearly differentiated cancer from benign regions. ADC and Kurtosis parameters correlated most strongly with VERDICT’s intracellular volume fraction, but also moderately with the EES and vascular fractions.
Conclusions VERDICT distinguished tumour from benign areas, while revealing differences in microstructure descriptors such as cellular, vascular and EES fractions. The parameters of ADC and Kurtosis models also discriminated between cancer and benign regions. However, VERDICT provides more specific information that
disentangles the various microstructural features underlying the changes in ADC and Kurtosis. These results highlight the clinical potential of the VERDICT framework and motivate the construction of a shorter, clinically viable, imaging protocol to enable larger trials leading to widespread translation of the method.
Key words: VERDICT MRI, prostate cancer, cancer imaging, microstructure, compartment model.
Introduction
Prostate cancer is the most common cancer among males in all economically
developed countries (1). The standard procedure to provide a diagnosis of the disease is transrectal prostate biopsy, which is invasive with possible unpleasant side effects (2) and is prone to error (3). Imaging based diagnostic strategies, using techniques such as multi-parametric magnetic resonance imaging (MRI), show great promise (4) providing useful information on the location and the stage of disease. Diffusion-weighted MRI (DW-MRI) is an integral component of the multi-parametric MRI examination, because of its unique sensitivity to the microscopic structure of the tissue. In particular, histological features such as the cellular density, cellular size and shape and cellular arrangement, all influence tissue-water mobility, so differences in these features produce image contrast in DW-MRI. These same microstructural characteristics, are evaluated by histopathologists to determine the Gleason grade of prostate cancers. Hence, DW-MRI offers great potential value as a non-invasive diagnostic probe for cancer pathology.
Most DW-MRI studies have used the technique in its simplest form by calculating the apparent diffusion coefficient (ADC) to identify clinically significant tumour foci more clearly (5, 6). In general, ADC values are lower in prostate carcinoma compared to healthy tissue and are believed to reflect the highly cellular environment of
neoplastic tissue, which constrains water mobility. However, this simplified model of water diffusion remains a blunt tool, which fails to discriminate the variety of
histological changes (cell density, size, shape, permeability, subcellular architecture, and vascular perfusion effects) that occur within cancers. Indeed, the overall
within a given region remains limited, as ADC values in prostatic cancer and in benign prostatic tissue vary widely and overlap substantially (7-9). Biophysical mechanisms affect ADC in different ways that can even compete and cancel each other. Furthermore, the simultaneous dependence of ADC on a variety of histological features simultaneously means that it lacks biological specificity; a factor which likely limits its ability to distinguish cancer from other common pathologies, such as
prostatitis and hyperplasia.
A variety of more sophisticated DW-MRI models have recently been reported to improve sensitivity and specificity for cancer diagnosis.
Diffusion kurtosis imaging (DKI) is a generalisation of ADC estimation (10) that quantifies the Gaussian and non-Gaussian components of the diffusion behaviour in tissue. Several studies have demonstrated greater discriminatory sensitivity of DKI for benign and prostate cancer tissue than standard ADC (11, 12). Yet, as for ADC, DKI lacks specificity to the underlying microstructural features that cause the changes (13).
Le Bihan et al (14) proposed the intravoxel incoherent motion (IVIM) model to separate “pure” water diffusion effects in the tissue from pseudo-diffusion of water in the blood capillary network. IVIM characterises water dispersion as a combination of a slow component associated with Brownian motion and a fast component associated with the bulk motion of molecules inside microcapillaries (14, 15). IVIM has been used to study various cancer types such as breast (16), prostate (9) and pancreatic (17, 18) tumours, showing improvement in data description compared to ADC. However, its description of diffusion in the cellular component of the tissue remains simplistic: it does not account for cellular geometry and compartmentalisation. This has led to
sometimes poor reproducibility and unreliable estimates of both fast and slow diffusion parameters from the DW-MRI signal (9, 19-22).
The recent VERDICT framework (23) uses a three compartment tissue model
designed to capture the main histological features that influence the DWI signal from in-vivo cancer tumours. The three compartments account explicitly for i) water trapped in cells, ii) water in the vascular network, and iii) interstitial water. Thus, in contrast to ADC, Kurtosis and IVIM models, VERDICT provides estimates of
specific tissue properties such as the size and packing density of the cells, the vascular and extracellular-extravascular space (EES) volume fractions. The original
presentation of VERDICT demonstrated its use in tumour xenograft models of colorectal cancer (23). Experiments identified and quantified i) known differences in the microstructure of two human colorectal tumours (LS174T and SW1222) with differing cellular and vascular phenotypes; and ii) a significant decrease in cell size following administration of a chemotherapeutic agent indicating Apoptotic Volume Decrease. In contrast the standard ADC and IVIM models failed to identify either difference. These results show promise for the potential of the VERDICT framework for non-invasive histology and motivate translation to clinical practice for providing sensitive biomarkers of tumour type without the need for biopsy.
This feasibility study assesses the ability of the VERDICT model to differentiate between benign and cancerous prostate tissue in a clinical setting, while comparing its performance with more established models (ADC, Kurtosis, IVIM). The cellular and vascular architecture of the normal prostatic tissue changes dramatically with disease. Notably in prostate carcinoma there is profound increase of glandular elements, which coincides with the proliferation of epithelial cells as well as capillary
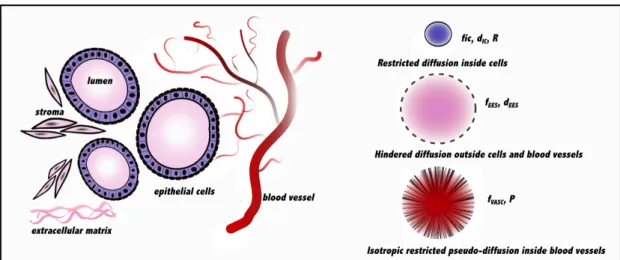
neovascularization (13, 24). VERDICT is designed to reflect these changes as the intracellular and vascular volume fractions are influenced by the signal from these cellular and vascular structures (Figure 1). To test its potential, we acquired uniquely rich DW-MRI data sets with a wide range of diffusion times and diffusion weightings from a small set of prostate-cancer patients. This data set demonstrates the feasibility of VERDICT for providing non-invasive measurements of histological parameters in a clinical setting and motivates the construction of more economical protocols for widespread application of VERDICT in the clinic.
Materials and Methods
Patient population This study was performed with informed patient consent and local ethics committee approval. The standard of reference was histology following transperineal template mapping (TPM) biopsy (25). TPM biopsies systematically sample the whole prostate and therefore provide high accuracy for the detection of clinically significant prostate cancer tumours. Between October 2012 and July 2013, 8 patients with elevated PSA levels consented to have multiple b value DW-MRI as described below. The inclusion criteria for the patients of this study for VERDICT analysis were (i) no prior hormonal or radiation treatment and (ii) a region of cancer on MRI in the peripheral zone (PZ), with histologically positive results for cancer in the corresponding region confirmed after the MRI scan. All 8 patients met our inclusion criteria for VERDICT analysis and were pristine patients
MRI acquisition
We imaged 8 patients (prior to TPM biopsy) on a Philips Achieva 3T MRI scanner using conventional multi-parametric MRI (26, 27) supplemented by
additional DW-MRI sequences specifically for VERDICT modelling. Imaging used a 32 channel cardiac coil with the patient in the supine position. For anatomical
imaging, the entire prostate gland was imaged with a T2-weighted acquisition (echo time (TE)= 100ms, repetition time (TR)= 5407ms, flip angle 90°, matrix 448×448, field of view (FOV) = 180x180mm2, 3mm slice thickness, 30 slices). DW-MRI was performed in the axial plane using a pulse gradient spin echo (PGSE) sequence, with data acquired using single-shot echo planar imaging (EPI). Three orthogonal
directions were used for each of the 9 b values (100, 200, 400, 800, 1000, 1500, 2000, 2500, 3000 s/mm2). The DW-MRI sequence was acquired with a voxel size of
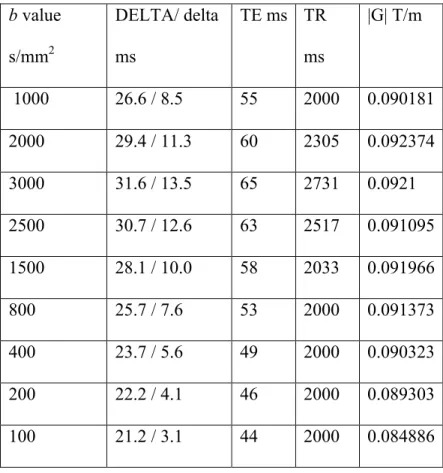
1.3×1.3×5mm3, 5mm slice thickness, 14 slices and FOV=220×220mm2, and images were reconstructed to a 176×176 matrix size. More parameters are detailed in Table 1. The data was normalised to avoid T2 dependence with a b=0 image for every echo time (TE). The total duration of the scan for each patient was approximately 35 minutes, which is at the limit of what the patients would tolerate. As such this provides the richest possible data for assessing the potential benefits of VERDICT MRI.
Image Analysis
Based on multi-parametric MRI findings, an experienced radiologist (S.P., with 9 years of experience in prostate MR imaging;) contoured the focal areas
most suspicious for tumour within the PZ of the prostate. The MRI suspicious regions of interest (ROI) were subsequently targeted and confirmed as cancer by TPM biopsy. The ROIs were chosen to be as large as possible, while having minimal contamination from unintended tissues. For the purposes of image interpretation the tumour ROIs were defined as a focal area that displayed i) local low signal intensity on
T2-weighted images and/or ii) high intensity on a DW image with high b value (Figure 2). All 8 patients with PZ identified suspicious MRI findings had histologically-confirmed tumour on targeted biopsy cores. Following review of the biopsy result to confirm the absence of tumour on the contralateral side of the PZ, the same
radiologist located an ROI for each patient in an area of benign PZ.
Data Processing
We fit the ADC, Kurtosis, IVIM and VERDICT models to the data using a similar iterative optimization procedure to (23, 28) that accounts for local minima and Rician noise. The experiments first fit the models to data averaged over all voxels within tumour and benign regions and subsequently in each voxel. The signal to noise ratio (SNR) was calculated using the method described in (29) that accounts for the spatially variant noise in the DW-MR images. The median SNR, at b=0, for our patient data sets was 14.
Mathematical models
The ADC model is a simple monoexponential description of the signal decay as a function of b; it assumes an isotropic Gaussian distribution of water-molecule displacements and has one parameter, the ADC d. The normalised signal is
𝑆=exp −𝑏𝑑 . 1
The diffusion Kurtosis model generalises the ADC model to relax the assumption of Gaussian water dispersion. It has two parameters K, and Dk. The diffusivity parameter
deviation of the dispersion pattern from a Gaussian distribution. The normalised signal under the Kurtosis model is
𝑆= exp −𝑏𝐷!+ 1
6𝑏!𝐷!!𝐾 . 2
The IVIM model is biexponential assuming ADC models for each of two non-exchanging pools of water molecules, one vascular and one cellular. The parameters of the model are ffast fslow, Dfast, and Dslow, where ffast, Dfast and fslow, Dslow are the
volume fraction and the diffusion coefficient associated with the fast (vascular) and the slow (cellular) compartments, respectively, with ffast + fslow = 1. The normalised
signal is
𝑆= 𝑓!"#$ exp (−𝑏𝐷!"#$ )+𝑓!"#$ exp (−𝑏𝐷!"#$ ). 3
VERDICT is a three-compartment model that characterises water diffusion in the vascular, extracellular-extravascular space (EES) and intracellular (IC)
compartments in tumours. Mathematically, VERDICT is the sum of three parametric models, each describing the diffusion MR signal in a separate population of water from one of the three components. The model assumes no exchange between the three water populations. The normalised signal for the VERDICT model is
𝑆= 𝑓! !
!!!
𝑆! 4
where 𝑓! is the proportion of signal with no diffusion weighting (b=0) from water molecules in population 𝑖, 0≤𝑓! ≤1, ! 𝑓!
As specified in (22), the precise forms of the model components are application dependent. For prostate tissue, we use restricted diffusion in impermeable spheres (30) to model the signal for the IC compartment. This compartment has fIC
(IC volume fraction), dIC, (IC diffusivity) and cell radius R as parameters. The model
for the EES compartment uses an isotropic diffusion tensor (DT) model (31), so it has fEES (EES volume fraction) and dEES (diffusivity EES) as parameters. The vascular
model assumes isotropically restricted water in cylinders with uniformly
distributed orientations and zero diameter (AstroSticks in the terminology of (28)) and has fVASC (vascular volume fraction) and P (pseudo-diffusivity) as parameters. A
schematic representation of the VERDICT model for prostate tissue is in Figure 1. In total we estimated 3 independent parameters for this study: fIC, fEES, and R.
The other volume fraction fVASC= (1- fIC -fEES), and the diffusion and pseudo-diffusion
coefficients were fixed to values that minimise fitting error averaged over all PZ voxels using data sets that were not included in the VERDICT analysis: dIC = dEES =
2×10⁻⁹m2/s, P = 8×10⁻⁹m2/s. This particular form of VERDICT resulted from preliminary work on model selection, similar to (28, 32, 33), to identify a
parsimonious model with the minimum number of parameters required to fit the data robustly.
Histopathology
For each patient after the prostate biopsy procedure the tissue samples were collected and placed in a paraffin block. After paraffin embedding, microsections were placed on glass slides and stained with hematoxylin and eosin (H&E). Also
immunohistochemical staining was performed for blood vessels and capillaries using the CD31 (PECAM-1, Leica Biosystems, Newcastle-upon-Tyne, UK) marker as per
standard methods. The cores were approximately 4µm thick and 1cm in length. Each lesion was measured in size and assigned a Gleason score by a histopathologist with 10 years experience in genitourinary pathology. A second histopathologist with 10 years of experience verified the Gleason score findings. The histopathologist also evaluated the cellularity and vascularity of the samples. To quantify the prostate tissue components we performed manual segmentation of the core biopsies. For this histopathological analysis we considered all cancers (irrespective of Gleason grade) versus benign tissue.
Statistical Analysis
Each parameter of each model was evaluated for performance in differentiation between benign and cancerous tissue via a Wilcoxon matched pairs statistics. To perform statistical analysis we used the OriginPro 9.1 statistics software for Windows. We used nonparametric tests to assess differences between the paired malignant versus normal appearing PZ values. A P < 0.05 was taken to indicate significance in all methods.
Results
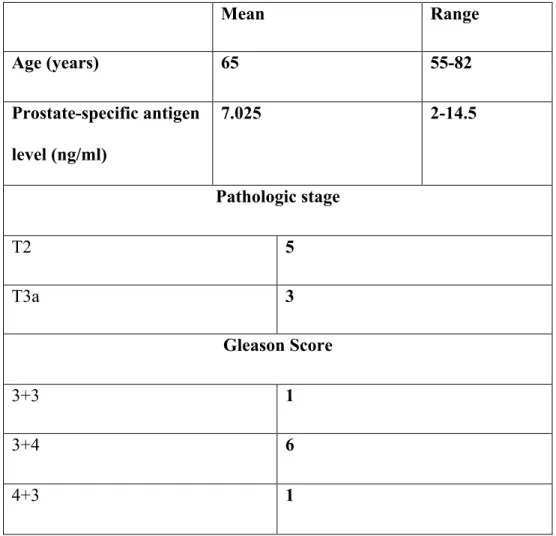
The 8 patients had histologically confirmed Gleason scores of 3+3 [n=1], 3+4 [n=6], 4+3 [n=1] cancer in the PZ based on targeted biopsy cores. Patients with 3+3 score had cancer core length (CCL) of 3mm, with 3+4 had median CCL 7.5mm [range 5 to 14mm] and with 4+3 had CCL 1mm. A summary of characteristics for the 8 patients is presented in Table 2. Histological analysis of the patient biopsies revealed
(vessels stain brown and are indicated with arrows) and found increased number of epithelial cells with evident reduction of the supporting stroma. To quantify the prostate tissue components we performed manual segmentation of the core biopsies labelling areas of blood vessels, lumen, epithelium and stroma. Figure 3C quantifies the increase in vasculature in tumour regions (162%) compared to benign. Figure 3D presents ratios for lumen, epithelial cells and stroma. The cancer shows increased proportions of lumen space (44%) and epithelium (470%), and reduction of stroma (-62%).
Figure 4 presents the fit of the VERDICT, ADC, IVIM and Kurtosis models to the data from a representative patient (63y, Gleason score 3+4), with the corresponding mean squared errors (MSE), by comparing the measured and predicted normalised diffusion signal S as a function of the diffusion weighting factor (b value). The VERDICT model captures the trends in the data for both benign and cancer ROIs with lower MSE than the ADC and IVIM models. The standard ADC and IVIM models exhibit clear departures: the ADC model signal prediction starts too high and ends up too low demonstrating that the signal decay is not monoexponential. The IVIM fails to estimate the signal at high b values in the cancer ROI, indicating that both models are unable to capture all the variation in the signal from both the cancer and benign tissue regions. The Kurtosis model fits both benign and cancer signals closely over their whole range in a similar way to VERDICT. Figure 5 compares more closely, over all patients, the VERDICT and Kurtosis models’ ability to explain the data averaged over the benign and cancer regions using Akaike’s Information Criterion (AIC) (34). AIC allows model comparison that accounts for differences in complexity (Kurtosis has 2 free parameters, while VERDICT has 3); the preferred model is the one with the minimum AIC score. In benign regions, the two models
have similar residual error score, so the AIC has a slight but consistent preference for the Kurtosis model, because of its simplicity. However, in cancer areas VERDICT shows consistent and often substantially smaller AIC than the Kurtosis model, indicating that the extra complexity of the model is needed to explain the data. Figure 6 compares parameter estimates from the ADC, IVIM, and VERDICT models from all patients fit to signals averaged over the benign and cancer ROIs. The d, Dk, K
estimates are all significantly different (P =0.05) between tissue types with d, Dk
lower and K higher in cancer than normal appearing tissue. None of the IVIM
parameter estimates show significant differences between the tissue types (P =0.11 to 0.29). The VERDICT volume fraction estimates for the IC, EES and vascular
compartments are all significantly different between the benign and cancer tissue (P =0.05); note, however, that the three volume fractions are interdependent as they are constrained to sum to one. The IC and vascular volume fractions are higher while the EES fraction is lower in tumour than benign regions. There is no significant change in the cell radius estimate.
Figure 7 illustrates parametric maps for an example patient (62y) with Gleason score 3+4 tumour on the PZ for the ADC, Kurtosis and VERDICT models. These models showed significant differences in the averaged data over the ROIs of cancer versus benign tissue. The ADC map displays lower values for the tumour area as well as the Kurtosis Dk map. The Kurtosis K is higher for the tumour region as in the whole ROI
analysis. Spatial mapping reveals clear differences in VERDICT parameters between the benign and cancer areas, particularly in the IC volume fraction, the EES volume fraction, and the radius index. The differences in those parameters between cancer and benign areas are broadly consistent with the whole-ROI VERDICT analysis. The cellularity map is an estimate of cell density obtained by dividing the intracellular
volume fraction estimate by the cube of the cell-radius (cell volume) estimate. It strongly highlights the tumour area by suppressing high values elsewhere in the prostate that other parameter maps show, unlike the ADC and Kurtosis maps. The microstructural maps also show heterogeneity within the tumour region, which may provide additional useful diagnostic information.
Figure 8 investigates the relationship between the VERDICT and the ADC and Kurtosis parameters. It presents scatter plots for the tumour region of all the patients for voxel by voxel fitted values of d, Dk, K and fIC, R, fEES, fVASC. The colour coding
distinguishes individual patients. We observe similar correlative trends for d and Dk:
strong negative correlation with fIC, and moderate positive correlations with fEES and
fVASC. The kurtosis K shows strong positive correlation with fIC and moderate negative
correlation with fEES.
Discussion
Biomarkers sensitive to the pathophysiology of tumours are essential in the clinic for diagnosis and risk stratification (based on cancer grade and volume). Most current biomarkers come from histology, but the procedure is invasive, often challenging to perform, and limited to small sampling areas so are prone to errors. ADC derived from DW-MRI is increasingly used in cancer imaging to aid diagnosis, but is limited by the lack of specificity to individual histological features. The incorporation of an appropriate mathematical model is necessary to address this weakness and to develop DW-MRI as a source of non-invasive biomarkers of tumour histopathology, thereby improving patient classification, and perhaps ultimately limiting the requirement for biopsy. Previous studies using DW-MRI in prostate cancer have also assessed IVIM and Kurtosis techniques, however these models also lack specificity to the underlying
microstructure with significant overlap of parameter values between benign and cancerous tissue (11, 19, 21). VERDICT has the potential to overcome limitations of these simple models as it provides an effective probe of specific microstructural changes.
In the present study we examined patients with biopsy proven prostate PZ cancer using VERDICT MRI. Lesion-to-lesion comparisons with the patients’ tissue samples (Figure 3A-D) demonstrate how the volume fractions of different prostate tissue components vary over cancer and benign tissue. The main trends are a substantial increase in the proportion of epithelial tissue with prostate cancer while the volume of supporting stroma reduces. This suggests that the high values of the VERDICT intracellular volume fraction and cellularity reflect the proliferation of epithelial cells in tumours, which contain densely packed cells with little extracellular space. Also, the vascular staining in tumour areas showed the appearance of many new small blood vessels in close proximity to the tumour (neovascularisation). In contrast, areas of benign tissue had fewer large pre-existing vessels. These
observations agree with the significant increase of the VERDICT vascular volume fraction and support the assignment of the prostate tissue compartments to the
VERDICT model components illustrated in Figure 1. The observed VERDICT trends of increased cellularity and vasculature in cancerous versus normal prostate tissue are also well known and documented in the literature (13, 35).
We found the VERDICT volume fraction estimates of the IC and vascular tissue components significantly higher for cancer than benign tissue (Wilcoxon test P=0.05). These results are in agreement with histological assessment of increased cellularity and vascularity within our patient cohort and with existing knowledge of prostate
cancer (13, 35). Also the EES volume fraction was significantly lower for the tumour ROI than the benign region. This reflects the sensitivity of the volume fraction parameters of VERDICT to discern microstructure previously seen in a preclinical study, where all of the volume fraction parameters showed significant differences between two tumour xenograft models of colorectal cancer with different cellular and vascular phenotypes (23). The parameter estimations in the current study were based on regions known to be cancerous or benign. To evaluate the ability of VERDICT to detect cancerous tissue, a more extensive blinded study is required. From the standard models d, Dk and K parameters were also significantly different (P
=0.05) between tissue types, but none of the IVIM parameters (P =0.11to 0.29). Likewise both the IVIM and the ADC models were unable to describe the full range of the signal from the prostate data as shown in Figure 4, in contrast with VERDICT and the Kurtosis models. Recent findings in Jambor et al (36), also concluded that the kurtosis model is better than the biexponential model for both normal and cancerous prostate tissue, but did not evaluate the VERDICT model. They found that the biexponential model fitted the data best, but with poor reproducibility, and hence, they preferred the kurtosis model overall. In our study we found that the kurtosis and VERDICT fitted the data more closely than the biexponential IVIM. As commonly used in the literature, we used unconstrained fits for the IVIM model and a wide range of b values. However, in comparing with VERDICT, the choice of b values may not have been optimal for IVIM parameter estimation. The differences in the fit of the biexponential model are most likely due to the different set of b values in the acquisition protocol. The biexponential model has also been shown elsewhere in literature to have a variable performance (20, 23, 37).
the whole-ROI fitting in Figure 4. They showed elevated values of IC volume fraction in the tumour area and reduction of EES volume fraction. Furthermore combining the volume fraction of the IC component with the cell radius index allowed us to
compose a cellularity map that clearly indicated only the tumour area as highly
cellular and not other benign regions highlighted in the ADC d, and the kurtosis Dk, K
parametric maps. The cellularity feature of the VERDICT model may have potential for improving the diagnostic procedure by eliminating deceptive false positives. Although both the ADC and Kurtosis models also revealed significant differences between the benign and tumour areas, a key advantage of VERDICT is that it assigns the differences to specific biophysical or histological factors. Comparison of ADC and Kurtosis parameters with VERDICT parameters provides some insight into the biophysical properties that affect the unspecific parameters, which may help interpret other studies that focus on ADC or Kurtosis parameters (5, 9, 36, 38). The scatter plots in Figure 8 showed strong negative correlation of the IC volume fraction with ADC d and Dk as well as moderate positive correlations with the EES and vascular
volume fractions. These observations make sense, as we would expect ADC to decrease as the proportion of water trapped in cells increases and to increase as the proportion of water moving more rapidly in the vascular network increases. The kurtosis K exhibited opposite trends having positive correlation with the IC volume fraction and moderate negative correlation with the EES volume fraction. This again makes sense, as we would expect greater departures from Gaussian dispersion as the proportion of water restricted within cells increases. Although more data is necessary to establish better the relationship between the different parameters, the results do suggest that ADC and kurtosis confound various interesting histological effects, which further motivates the use of VERDICT parameters instead.
This study is an essential first step in the translation of the VERDICT technique to clinical practice. We have purposefully used an extended imaging protocol (compared to standard clinical imaging protocols) to obtain a uniquely rich data set with which to establish the best form for the VERDICT model and demonstrate its potential
advantages. This limited the cohort size to 8 patients, which supports a comparison only of cancerous tissue against benign rather than a finer grained study of the contrast between different Gleason grades. Larger patient populations, with a wide range of tumour grades, are needed to evaluate the diagnostic benefit of VERDICT prior to clinical adoption. The results we present here are sufficiently compelling to motivate such a study. Nonetheless, it requires a shorter acquisition protocol of approximately 10-15 minutes that is more feasible within the standard clinical
workflow allowing it to supplement multi-parametric MRI examination. Thus the next step is to design a clinical acquisition protocol using, for example, the experiment design optimization in (39). Such optimization reduces scan time by producing the minimum optimal combination of b values for estimating the VERDICT parameters. The form of the model we have identified here with the rich data set is essential to underpin that process and the positive results motivate continuation to the next steps. Also the small cohort of our study consisted only of pristine patients. Patients who have already undergone biopsies could potentially be analysed using VERDICT. Although previous studies have shown that diffusion MRI tends to be quite robust to the changes caused by biopsy, for example in active surveillance patients (40), it is possible that the new model may be more sensitive than standard DWI to the associated tissue disruption. Further work is required to investigate non-pristine patients.
In the future, the VERDICT model can be refined in a number of ways to incorporate more physiological parameters. However, as discussed in Panagiotaki et al (23), we believe that the current form of the model is as complex as the PGSE sequence on current clinical MRI scanners can support. A range of other DW measurements could potentially allow incorporation of additional microstructural parameters in the model. For example, oscillating gradient DW-MRI could give access to subcellular structures such as the nuclei (38, 41, 42), while double pulsed-field gradient waveform
sequences could inform about the shape (43) and permeability of cells (44).
Conclusion
In summary, we have demonstrated the utility of the VERDICT framework in a clinical setting for imaging prostate cancer. VERDICT successfully differentiated between benign and cancer regions while providing useful microstructural parameter estimates such as cell size, cellular, vascular and EES volume fractions. ADC d, Dk
and K were also significantly different between types, unlike the IVIM parameters. The specificity of VERDICT analysis sheds light on the factors that affect and control the contrast in currently used methods such as ADC and DKI that have less direct biophysical foundation. Furthermore, the direct microstructural inferences could improve diagnosis and patient risk stratification, and help reduce the large number of false positive and false negative biopsies that currently arise from the Prostate
Specific Antigen followed by the transrectal biopsy diagnostic pathway. Specifically, a promising advantage of this approach over simple ADC and DKI is the potential to eliminate the need for DCE-MRI, which is particularly pertinent to patients who cannot receive intravenous gadolinium-based contrast media. Most importantly, this feasibility study is a first step motivating the formation of a clinically viable imaging
protocol. This will allow large-scale evaluation of this technique to potentially offer and establish new non-invasive biomarkers for cancer diagnosis.
REFERENCES:
1. Jemal A, Bray F, Center MM, et al. Global Cancer Statistics. Ca-‐a Cancer Journal for Clinicians. 2011;61(2):69-‐90.
2. Norberg M, Egevad L, Holmberg L, et al. The sextant protocol for ultrasound-‐guided core biopsies of the prostate underestimates the presence of cancer. Urology. 1997;50(4):562-‐6.
3. Hu Y, Ahmed HU, Carter T, et al. A biopsy simulation study to assess the accuracy of several transrectal ultrasonography (TRUS)-‐biopsy strategies compared with template prostate mapping biopsies in patients who have undergone radical prostatectomy. Bju International. 2012;110(6):812-‐20. 4. Graham J, Peter Kirkbride, Kimberley Cann, Elise Hasler, and Matthew
Prettyjohns. Prostate cancer: summary of updated NICE guidance. British Medical Journal. 2014;348.
5. Sato C, Naganawa S, Nakamura T, et al. Differentiation of noncancerous tissue and cancer lesions by apparent diffusion coefficient values in transition and peripheral zones of the prostate. Journal of Magnetic Resonance Imaging. 2005;21(3):258-‐62.
6. Lim HK, Kim JK, Kim KA, Cho KS. Prostate Cancer: Apparent Diffusion Coefficient Map with T2-‐weighted Images for Detection-‐A Multireader Study. Radiology. 2009;250(1):145-‐51.
7. Gibbs P, Pickles MD, Turnbull LW. Diffusion imaging of the prostate at 3.0 tesla. Investigative Radiology. 2006;41(2):185-‐8.
8. Kim CK, Park BK, Lee HM, Kwon GY. Value of diffusion-‐weighted Imaging for the prediction of prostate cancer location at 3T using a phased-‐array coil -‐ Preliminary results. Investigative Radiology. 2007;42(12):842-‐7. 9. Riches SF, Hawtin K, Charles-‐Edwards EM, de Souza NM. Diffusion-‐
weighted imaging of the prostate and rectal wall: comparison of
biexponential and monoexponential modelled diffusion and associated perfusion coefficients. Nmr in Biomedicine. 2009;22(3):318-‐25.
10. Jensen JH, Helpern JA, Ramani A, et al. Diffusional kurtosis imaging: the quantification of non-‐gaussian water diffusion by means of magnetic resonance imaging. Magn Reson Med. 2005;53(6):1432-‐40.
11. Rosenkrantz AB SE, Johnson G, Babb JS, Mussi TC, Melamed J, Samir S, Lee V S, Jensen JH. Prostate cancer: feasibility and preliminary experience of a diffusional kurtosis model for detection and assessment of aggressiveness of peripheral zone cancer. Radiology. 2012;264:126-‐35.
12. Bourne RM, Panagiotaki E, Bongers A, Sved P, Watson G and Alexander DC. Information theoretic ranking of four models of diffusion attenuation in fresh and fixed prostate tissue ex vivo. Magnetic Resonance in
Medicine. 2013. DOI 10.1002/mrm.25032.
13. de la Rosette JJ MJ, Harisinghani MG, Wijkstra. Imaging in Oncological Urology Springer; 2009.
14. Le Bihan D, Breton E, Lallemand D, et al. Separation of diffusion and perfusion in intravoxel incoherent motion MR imaging. Radiology. 1988;168(2):497-‐505.
15. Koh DM, Collins DJ, Orton MR. Intravoxel Incoherent Motion in Body Diffusion-‐Weighted MRI: Reality and Challenges. American Journal of Roentgenology. 2011;196(6):1351-‐61.
16. Sigmund EE, Cho GY, Kim S, et al. Intravoxel Incoherent Motion Imaging of Tumor Microenvironment in Locally Advanced Breast Cancer. Magnetic Resonance in Medicine. 2011;65(5):1437-‐47.
17. Klauss M, Lemke A, Gruenberg K, et al. Intravoxel Incoherent Motion MRI for the Differentiation Between Mass Forming Chronic Pancreatitis and Pancreatic Carcinoma. Investigative Radiology. 2011;46(1):57-‐63.
18. Concia MS, Alois M.; Penner, Arndt-‐Hendrik. Diffusion-‐Weighted Magnetic Resonance Imaging of the Pancreas: Diagnostic Benefit From an
Intravoxel Incoherent Motion Model–Based 3 b-‐Value Analysis. Investigative Radiology. 2014;49(2):93-‐100.
19. Mazaheri Y, Vargas HA, Akin O, et al. Mazaheri Y, Vargas HA, Akin O, Goldman DA, Hricak H. Reducing the influence of b-‐value selection on diffusion-‐weighted imaging of the prostate: evaluation of a revised monoexponential model within a clinical setting. J Magn Reson Imaging 2012;35:660-‐668. Journal of Magnetic Resonance Imaging.
2012;36(5):1256-‐.
20. Dopfert J, Lemke A, Weidner A, Schad LR. Investigation of prostate cancer using diffusion-‐weighted intravoxel incoherent motion imaging. Magnetic Resonance Imaging. 2011;29(8):1053-‐8.
21. Pang YX, Turkbey B, Bernardo M, et al. Intravoxel incoherent motion MR imaging for prostate cancer: An evaluation of perfusion fraction and
diffusion coefficient derived from different b-‐value combinations. Magnetic Resonance in Medicine. 2013;69(2):553-‐62.
22. Ocak I, Bernardo M, Metzger G, et al. Dynamic contrast-‐enhanced MRI of prostate cancer at 3 T: a study of pharmacokinetic parameters. AJR. American journal of roentgenology. 2007;189(4).
23. E. Panagiotaki, Walker-‐Samuel S., B. Siow, S. P. Johnson, V. Rajkumar, R. B. Pedley, M. F. Lythgoe, D. C. Alexander. Non-‐invasive quantification of solid tumour microstructure using VERDICT MRI. Cancer Research.
2014;74(7):1902-‐12.
24. Hassan G, Mohd Shafi, and M. L. Bhat. Changes in the Normal Cellular Architecture in the Prostatic Tissue with the Increasing age. International journal of health sciences. 2008;2(2):171-‐8.
25. P. B. Singh CA, E. Dalton, O. Barbouti, D. Stevens, P. Gurung, M. Arya, C. Jameson, A. Freeman, M. Emberton, H. U. Ahmed. Prostate cancer tumour features on template prostate-‐mapping biopsies: implications for focal therapy European urology. 2013;66(1).
26. Barentsz JO, Richenberg J, Clements R, et al. ESUR prostate MR guidelines 2012. European Radiology. 2012;22(4):746-‐57.
27. Kurhanewicz J, Vigneron D, Carroll P, Coakley F. Multiparametric magnetic resonance imaging in prostate cancer: present and future. Current Opinion in Urology. 2008;18(1):71-‐7.
28. Panagiotaki E, Schneider T, Siow B, et al. Compartment models of the diffusion MR signal in brain white matter: A taxonomy and comparison. Neuroimage. 2012;59(3):2241-‐54.
29. Dikaios N, Punwani S , Hamy V , Purpura P, Rice S, Forster M, Mendes R, Taylor S, and Atkinson D. Noise estimation from averaged diffusion weighted images: can unbiased quantitative decay parameters assist cancer evaluation? Magnetic Resonance in Medicine. 2013;71(6):2105-‐17. 30. Murday JS, Cotts RM. Self-‐diffusion coefficient of liquid lithium. Journal of
Chemical Physics. 1968;48(11):4938-‐&.
31. Basser PJ, Mattiello J, Lebihan D. MR Diffusion Tensor Spectroscopy and Imaging. Biophysical Journal. 1994;66(1):259-‐67.
32. Panagiotaki E, Walker-‐Samuel S, Siow B, Johnson P, Pedley R, Lythgoe MF, Alexander DC. In vivo characterisation of colorectal tumour
microstructure with DW-‐MRI. International society for magnetic resonance in medicine, 2013. Salt Lake City, Utah, USA.
33. Ferizi U, Torben Schneider, Eleftheria Panagiotaki, Gemma Nedjati‐ Gilani, Hui Zhang, Claudia AM Wheeler‐Kingshott, and Daniel C.
Alexander. A ranking of diffusion MRI compartment models with in vivo human brain data. Magnetic Resonance in Medicine. 2013.
34. Burnham KPaA, David R. Model selection and multimodel inference: a practical information-‐theoretic approach: Springer; 2002.
35. Bigler SA, Robert E. Deering, and Michael K. Brawer. Comparison of microscopic vascularity in benign and malignant prostate tissue. Human pathology. 1993;24(2):220.
36. Jambor I, Merisaari H, Taimen P, Bostrom P, Minn H, Pesola M, Aronen, HJ. Evaluation of different mathematical models for diffusion-‐weighted imaging of normal prostate and prostate cancer using high b-‐values: A repeatability study. Magnetic Resonance in Medicine. 2014.
37. Orton MR, Collins DJ, Koh DM, Leach MO. Improved intravoxel incoherent motion analysis of diffusion weighted imaging by data driven Bayesian modeling. Magnetic Resonance in Medicine. 2014;71(1):411-‐20.
38. Colvin DC, Loveless ME, Does MD, et al. Earlier detection of tumor treatment response using magnetic resonance diffusion imaging with oscillating gradients. Magnetic Resonance Imaging. 2011;29(3):315-‐23. 39. Alexander DC. A general framework for experiment design in diffusion
MRI and its application in measuring direct tissue-‐microstructure features. Magnetic Resonance in Medicine. 2008;60(2):439-‐48. 40. van As NJ, Nandita M. de Souza, Sophie F. Riches, Veronica A. Morgan,
Sayid A. Sohaib, David P. Dearnaley, and Chris C. Parker. A study of diffusion-‐weighted magnetic resonance imaging in men with untreated localised prostate cancer on active surveillance. European Urology. 2009;56(6):981-‐8.
41. Colvin DC, Yankeelov TE, Does MD, et al. New insights into tumor
microstructure using temporal diffusion spectroscopy. Cancer Research. 2008;68(14):5941-‐7.
42. Gore JC, Xu JZ, Colvin DC, et al. Characterization of tissue structure at varying length scales using temporal diffusion spectroscopy. Nmr in Biomedicine. 2010;23(7):745-‐56.
43. Jespersen SN, H. Lundell, et al. Orientationally invariant metrics of apparent compartment eccentricity from double pulsed field gradient diffusion experiments. NMR in biomedicine. 2013 26(12):1647-‐62. 44. M. Nilsson JL, D. van Westen, S. Brockstedt, S. Lasic, F. Ståhlberg, and D.
human brain using filter-‐exchange imaging. Magn. Reson. Med. 2013 69(6):1572-‐80.
Tables
Table 1 DW- MRI acquisition parameters, where DELTA is the time separation between the two pulses, delta is the duration of the pulses and |G| is the gradient strength. b value s/mm2 DELTA/ delta ms TE ms TR ms |G| T/m 1000 26.6 / 8.5 55 2000 0.090181 2000 29.4 / 11.3 60 2305 0.092374 3000 31.6 / 13.5 65 2731 0.0921 2500 30.7 / 12.6 63 2517 0.091095 1500 28.1 / 10.0 58 2033 0.091966 800 25.7 / 7.6 53 2000 0.091373 400 23.7 / 5.6 49 2000 0.090323 200 22.2 / 4.1 46 2000 0.089303 100 21.2 / 3.1 44 2000 0.084886
Table 2 Characteristics of the 8 patients with confirmed prostate cancer Mean Range Age (years) 65 55-82 Prostate-specific antigen level (ng/ml) 7.025 2-14.5 Pathologic stage T2 5 T3a 3 Gleason Score 3+3 1 3+4 6 4+3 1 Figure Legends
Figure 1 Schematic representation of the prostate tissue and the corresponding VERDICT model. The colour indicates the potential assignment of the tissue compartments to the model components (see Discussion).
Figure 2 Gleason score 3+4 tumour on the PZ of a 74-year-old patient is seen as a focus of high signal intensity on a DW image of b value=3000s/mm2 (A). The tumour area is noted in magenta and the benign region in green. In (B) the tumour is seen as a homogenous focus of low signal intensity on the closest corresponding transverse T2-weighted MR image.
Figure 3 Histological analysis and prostate tissue component ratios from manual segmentation of biopsy cores. A) Immunohistochemical detection of vasculature in benign tissue shows a small number of large blood vessels. B) In cancerous tissue staining reveals numerous new small capillaries near the glands. Blood vessels are outlined in brown and presented by arrows. Note the evident proliferation of epithelial cells and loss of surrounding stroma in cancer. Manual segmentation ratios of VERDICT patients’ biopsies for C) vasculature, D) lumen, epithelial cells and stroma. Figure 4 Fits of the VERDICT, ADC, IVIM and Kurtosis models to the data for an example data set of a 63-year-old patient with Gleason score 3+4. The symbols represent the measured data and the lines show the corresponding fits by the model. The normalized signal S is plotted as a function of the b value for all diffusion directions. The VERDICT and Kurtosis models provide a good fit, whilst the ADC and IVIM models fail to represent the whole range of the data.
Figure 5 AIC scatter plots for the VERDICT and the kurtosis model with data from all the patients for signal averaged over the benign and cancer regions. Lower AIC scores indicate the best model. VERDICT consistently scores lower AIC for all cancer regions, while for benign areas the kurtosis model performs best.
Figure 6 Parameter estimates for all patients for the benign and cancer ROIs for (A) ADC, (B) IVIM, (C) VERDICT and (D) Kurtosis. Boxes define the interquartile range, whiskers the full range, the central lines the median and the dot the mean. Significant differences between groups are represented by asterisks (Wilcoxon test P<0.05). VERDICT volume fractions of the IC, EES and vascular compartments, and the ADC and Kurtosis parameters showed significant differences between the groups
of benign and cancer tissue.
Figure 7 Parameter maps from 62-year-old patient with Gleason score 3+4 tumour on the PZ. In red we outline the tumour ROI and in black a benign region. A) Transverse T2 weighted image, B) ADC map, C) volume fraction map of the intracellular
component, D) volume fraction map of the extracellular-extravascular space (EES), E) cell radius index map F) cellularity map derived from fIC and R, G) volume fraction
map of the vascular space, H) kurtosis diffusivity map, I) kurtosis map. The
cellularity map clearly distinguishes the tumour from the benign region unlike the rest parametric maps.
Figure 8 Colour-coded per patient scatter plots of voxel by voxel fitting values of the ADC d, Dk, K and fIC, R, fEES, fVASC, for the tumour ROIs showing the least-squares
line and the correlation coefficients for each plot. For the ADC d and Dk we observe
strong negative correlation with fIC, and moderate positive correlations with fEES and
fVASC. The kurtosis K shows strong positive correlation with fIC and moderate negative
correlation with fEES.
Figure 1
Figure 2 Figure 3 Figure 4
Figure 5 Figure 6 0 5 10 15 20 25 30 35 0 5 10 15 20 25 30 35 AIC VERDICT AIC KURTOSIS Benign Cancer y=x
Figure 7