warwick.ac.uk/lib-publications
Original citation:
Xin, Guan, Li, Chang-Tsun and Yu, Guan (2017) Matrix factorization with rating completion :
an enhanced SVD Model for collaborative filtering recommender systems. IEEE Access, 5 .
pp. 27668-27678. doi:10.1109/ACCESS.2017.2772226
Permanent WRAP URL:
http://wrap.warwick.ac.uk/105606
Copyright and reuse:
The Warwick Research Archive Portal (WRAP) makes this work by researchers of the
University of Warwick available open access under the following conditions. Copyright ©
and all moral rights to the version of the paper presented here belong to the individual
author(s) and/or other copyright owners. To the extent reasonable and practicable the
material made available in WRAP has been checked for eligibility before being made
available.
Copies of full items can be used for personal research or study, educational, or not-for profit
purposes without prior permission or charge. Provided that the authors, title and full
bibliographic details are credited, a hyperlink and/or URL is given for the original metadata
page and the content is not changed in any way.
Publisher’s statement:
© 2017 IEEE. Personal use of this material is permitted. Permission from IEEE must be
obtained for all other uses, in any current or future media, including reprinting
/republishing this material for advertising or promotional purposes, creating new collective
works, for resale or redistribution to servers or lists, or reuse of any copyrighted component
of this work in other works.
A note on versions:
The version presented here may differ from the published version or, version of record, if
you wish to cite this item you are advised to consult the publisher’s version. Please see the
‘permanent WRAP url’ above for details on accessing the published version and note that
access may require a subscription.
Matrix Factorization with Rating
Completion: an Enhanced SVD Model for
Collaborative Filtering Recommender
Systems
XIN GUAN1, CHANG-TSUN LI1,2, AND YU GUAN.3,
1Department of Computer Science, University of Warwick, UK (e-mail: x.guan,[email protected]) 2School of Computing and Mathematics, Charles Sturt University, Australia (e-mail: [email protected]) 3School of Computing Science, Newcastle University, UK (e-mail: [email protected])
Corresponding author: Chang-Tsun Li (e-mail: [email protected]).
This work is supported by the EU Horizon 2020 - Marie Sklodowska-Curie Actions through the project entitled Computer Vision Enabled Multimedia Forensics and People Identification (Project No. 690907, Acronym: IDENTITY).
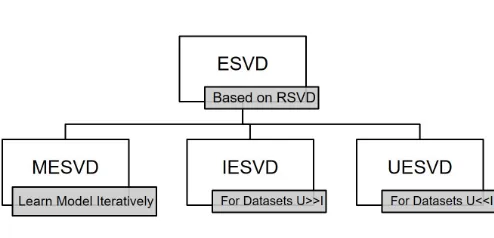
ABSTRACT Collaborative filtering algorithms such as matrix factorization techniques are gaining mo-mentum recently due to their promising performance on recommender systems. However, most collaborative filtering algorithms suffer from data sparsity. Active learning algorithms are effective in reducing the sparsity problem for recommender systems by requesting users to give ratings to some items when they enter the systems. In this paper, a new matrix factorization model, calledEnhanced SVD(ESVD) is proposed, which incorporates the classic matrix factorization algorithms with ratings completion inspired by active learning. In addition, the connection between the prediction accuracy and the density of matrix is built to further explore its potentials. We also propose theMulti-layer ESVD(MESVD), which learns the model iteratively to further improve the prediction accuracy. To handle the imbalanced datasets that contain far more users than items or more items than users, theItem-wise ESVD (IESVD) andUser-wise ESVD (UESVD) are presented, respectively. The proposed methods are evaluated on the famousNetflixandMovielensdatasets. Experimental results validate their effectiveness in terms of both accuracy and efficiency when compared with traditional matrix factorization methods and active learning methods.
INDEX TERMS matrix factorization, recommender systems, data sparseness, rating completion, active learning
I. INTRODUCTION
R
ECOMMENDER systems are one of the most common software tools and techniques for generating recom-mendations since the early 1990s. They provide users with personalized recommendations by predicting the preference (often expressed in rating) that the users would give to an item, and typically apply methodologies and techniques from related areas such as Machine Learning, Information Retrivial, andHuman Computer Interaction. They play vital roles in real life and are adopted by many internet leaders such as Google[1], Facebook[2], Amazon [3],Netflix [4], etc.Recommender systems are used for generating recommen-dations to users, usually in one of the following ways:
- Collaborative filtering algorithms [5] predict other items
the current users might like based on the past knowledge about the preferences of users for some items.
- Content-based algorithms [6] produce recommendation-s barecommendation-sed on item derecommendation-scriptionrecommendation-s which could be auto-matically extracted or manually created, or (and) user profiles that represent the users’ interests on items. - Knowledge-based algorithms [7] generate
recommen-dations by exploiting explicit user requirements and de-tailed domain knowledge about item features, reasoning about what items meet the user’s needs.
Collaborative filtering is considered the most important techniques, and is widely used in industry, especially in online retail sites such as Netflix [4], in order to promote additional items and increase sales. It is a method that makes recommendations by using ratings given to items by users as the only source of information. Empirical studies such as [9] and [10] categorized collaborative filtering algorithms into two classes: memory-based and model-based algorithms. Memory-based algorithms [11] [12] focus on relationship-s between urelationship-serrelationship-s (urelationship-ser-barelationship-sed) or itemrelationship-s (item-barelationship-sed), while model-based approaches [13] [14] [15] are based on predic-tion models that have been trained using the rating matrix. Matrix factorization methods [16] [17] [18], as one of the most successful realizations of model-based algorithms, can achieve better accuracy than classic nearest neighbor meth-ods (memory-based) when dealing with product recommen-dations [19].
In real-life scenarios, when a new user comes in, most recommender systems would only query the user to rate a limited number of items (which is a small proportion comparing with the whole data set). Therefore, there is not enough knowledge to form accurate recommendations for the user since the rating matrices are normally very sparse. To get precise recommendations for the target user, active learning is often used to elicit more high-quality data [20] [21] [22].
However, traditional active learning methods [23] [24] [25] only evaluate each user independently and only consider the benefits of the elicitations to the "new" user, neglecting the effects of the elicitations to the whole system. Moreover, in previous works [9] [23] [24], selected users are enforced to rate each elicitation through an active learning process, which is unrealistic in practice. In this paper an ESVDmodel is proposed by incorporating the matrix completion strategy, which improves the prediction accuracy of the whole system by automatically ’adding’ ratings only for existing users. Furthermore, ratings were added on a one by one per request [23] or user’s by user’s per request basis [25] by the system in traditional active learning. As a result, the model is trained at each request, which is considerably time-consuming. In contrast, the proposed ESVD model increases the amount of special training ratings simultaneously that are predicted by matrix factorization. Through this special preprocessing step, not only is the computational cost reduced, but also the performance of the recommender system is greatly improved. To alleviate the bias of the added ratings in theESVDmodel, we also propose theMultilayer ESVD(MESVD) algorithm, which learns the model iteratively. To handle the imbalanced datasets that contain far more users than items or more items than users, we also propose theItem-wise ESVD (IESVD)and
User-wise ESVD (UESVD), respectively. The connections of the proposedESVDand its variants are shown in Figure 1.
The rest of the paper is organized as follows: Preliminaries and related works are introduced in Section II. In Section III we first analyze active learning, then propose theESVD
model for recommender systems. Section IV describes the
MESVDmodel to further explore its potential. More
exten-FIGURE 1: The proposedESVDand its variants
sions on ESVDincluding IESVD,UESVD are presented in Section V to handle the imbalanced datasets. The paper is concluded in Section VI.
II. PRELIMINARIES
Collaborative filtering recommender systems usually consist of a set of users, a set of items and the preferences of users for various items, which are frequently represented in the form of [User, Item, Rating] triples. By aggregating these triples, a U-I rating matrixR ∈ Rm×n that consists ofm users and
n items can be obtained, where each rating rij represents
the preference of userifor itemj. The task of collaborative filtering recommender systems is to recommend each user a list of unrated items that are ranked in a descending order based on predicted preferences (ratings). As the key point of collaborative filtering is the ratings prediction task, most algorithms transform the recommending problem into the missing value estimation problem in the U-I rating matrix with high sparsity. The evaluation of the algorithms is often measured by computing the prediction accuracy of a set of unknown ratings in the rating matrix based on the predefined metrics, such asRoot Mean Squared Error (RMSE)andMean Absolute Error (MAE).
As the knowledge of preferences is very limited, the rating matrices in most recommender systems are extremely sparse. Take Netflix [4] and Movielens [26] datasets as examples, the density are 1.18% and6.3%, respectively, which mean that only a few elements are rated. Another challenge is that the dataset used in real-world recommender systems is typically of high dimensionality. Due to high sparseness and computational complexity, directly applying traditional dimensionality reduction methods, like SVD algorithms, to rating matrices is not appropriate [27].
A. REGULARIZED SVD
Funk [28] proposed theRegularized SVD(RSVD) algorithm, which is proved to be effective for collaborative filtering. De-note the rating matrix byR∈Rm×nthat consists ofmusers
[image:3.576.299.546.82.201.2]Regularized SVDalgorithm decomposes the rating matrixR
into the products of two lower rank matricesU ∈Rk×mand
V ∈Rk×n as the feature matrix of users and items: ˜
R=UTV (1)
It is based on an assumption that each user’s rating is composed of the sum of preferences about various latent factors of that item. So each rating rij (the corresponding
prediction is represented as˜rij) theith user gives to thejth
movie can be represented as:
˜
rij =UiTVj (2)
whereUi,Vj are the feature vectors of theith user and the
jth movie, respectively.
To learn the optimized approximations of U andV, the system minimizes the sum of squared errors between the existing scores and prediction values:
E = 1 2
X
i,j∈κ
(rij−˜rij)2+
ku 2
m
X
i=1
Ui2+
kv 2
n
X
j=1
Vj2 (3)
whereκis a set of(u,i)pairs that has been assigned values originally in the rating matrix R (a.k.a. the training set), the regularization parametersku andkv are used to alleviate
over-fitting.
To solve the optimization problem like Equation (3), S-tochastic Gradient Descent (SGD) is widely used and has shown to be effective for learning matrix factorization models [16] [29]. It loops through training ratings (κ) and modifies
U andV in the opposite direction of the gradient:
Ui ←Ui−α
∂Eij
∂Ui
(4)
Vj ←Vj −α
∂Eij
∂Vj
(5) whereαis the learning rate.
Unlike traditionalSVD,RSVDis a procedure of optimizing the feature matrices, which minimizes the least square error of the approximations. By solving this optimization problem, the end result is the same as SVD, which gets the diagonal matrix arbitrarily rolled into the two side matrices.
B. DATASETS
Movielens [26] is a classic recommender system that rec-ommends movies for its users through collaborative filtering algorithms. Movielens 1M contains 1,000,209 anonymous ratings of 3,952 movies provided by 6,040 users, while
Movielens 100Kcontains 100,000 ratings from 943 users on 1,682 movies.
Netflix[4] is a recommender system consisting of over 100 million 5-star ratings by 480,189 users for 17,770 movies. Each rating in theMovielensandNetflixdatasets is an integer ranging from 1 to 5, which represents the level of perferences the user has for the corresponding movie. The first 106,150
ratings are extracted from the fullNetflixdataset as the subset of Netflix, which are provided by 1,910 users for 1,780 movies.
III. THE PROPOSED ENHANCED SVD (ESVD) MODEL
It is important to note that the characteristics of prediction algorithms may influence the prediction accuracy. Matrix factorization models likeRegularized SVD (RSVD)are learnt by fitting a limited number of existing ratings. As a re-sult, the model trained with good quality as well as large quantity ratings could achieve better performance than the one with less sufficient ratings. Generally, the more number and informative ratings are obtained, the better performance recommender systems could achieve. However, most recom-mender systems suffer from the sparsity problem, i.e. the rating matrices are extremely sparse since users are often unwilling to rate a large amount of items.
A. CLASSIC ACTIVE LEARNING ALGORITHMS
Active learning is widely used for obtaining high quality data that better represents the preferences of users. To achieve this purpose, the system requests the user to rate specific items based on certain strategies or criteria. These strategies include:
1) Randomization: The system selects items or users to present randomly with uniform probability over all the items or users, which can be regarded as the baseline strategy for comparison [30].
2) Popularity-based: Items or users with the highest num-ber of ratings are preferred, which is based on the assumption that the user is more likely to give ratings to popular items [30].
3) Variance-based: The system selects items with the largest variance for eliciting. Therefore, the items with the largest variance are preferred for reducing the cer-tainty of the system [30].
4) Similarity-based: The system selects the items with the highest similarity to the user’s previously rated items. 5) Hybrid: This includesSqrt(F requency)∗V ariance
[31],Voting[25] , which consider the overall effect of previous methods.
These strategies try to identify the most informative set of training examples, aiming to achieve better performance for users with a certain amount of ratings required from them. However, tradition active learning has several limitations:
1) First, previous works (e.g., [25] [30] [32]) focused on the accuracy of the recommendations for ’a single user’, regardless of the fact that the increase of elicita-tions affect the performance of the whole system. 2) Furthermore, the model was trained by iterating all
0 200 400 600 800 1000 1200 1400 1600 1800 Movie ID
0 50 100 150 200 250 300 350 400 450 500
[image:5.576.48.272.70.246.2]Popularity
FIGURE 2: The number of ratings each item has received (popular-ity) inMovielens 100K
as another user’s since different users have different experiences. Hence the strategy (personalized) has to be applied repeatedly for each user, in order to elicit different items.
3) In addition, current active learning methods are based on the assumption that a user can provide ratings for any queried items, which is unrealistic and costly. Take movie recommendation for example, to rate a movie that is generated by the active learning strategy, a user has to watch it. On the other hand, the user maybe be frustrated when asked to rate a movie that he/she has not watched.
B. THE PROPOSED METHODS
1) Seeking High Density through Popular Items
Usually the number of ratings to each item (popularity) varies significantly. Take theMovielens 100Kdataset for example, the minimum and maximal number of popularity is 0 and 495, respectively, as shown in Figure 2. Popularity is based on the number of ratings for each item only. Therefore, the popularity of each movie remains the same for all the users. Based on the assumption that users are more likely to rate world-famous movies than the less known movies, by select-ingN most popular movies for all the users, a new sub-matrix could be obtained. Then the unrated items in this sub-matrix would be the ’desirable’ movies in some sense for the users who missed before. Unlike traditional active learning that queries only new users for a certain number of ratings in each iteration, the proposed strategy is to predict these specific ratings for all the users at the same time (one iteration) based on the result of applying matrix factorization algorithms to this sub-matrix. After these ratings are added to the original rating matrix, a more accurate matrix factorization model could be trained.
In summary, this item-oriented (based on item popularity) approach pre-estimates ratings of only popular movies for all
0 100 200 300 400 500 600 700 800 900 1000
User ID 0
100 200 300 400 500 600 700 800
Activity
FIGURE 3: The number of ratings each user has rated (activity) in Movielens 100K
the users simultaneously (instead of iterating through each individual user) in order to improve the performance of the whole system. Therefore, it reduces the training iteration from as high as the number of users (for active learning) to only 2 (the proposed method), which significantly reduces the computational cost.
2) Seeking High Density through Active Users
In contrast to traditional active learning for collaborative filtering, which selects a number of items to rate so as to improve the rating prediction for the user, Carenini et al. [33] proposed an alternative active learning method that elicits ratings by querying a number of special users about a specific item in order to improve the rating prediction for the target item. Inspired by [33], we also propose a user-oriented approach to further explore the potential of the proposed method.
Generally, the number of movies each user has rated (ac-tivity) varies significantly as shown in Figure 3. Take movie recommendations as an example, though active users who are enthusiastic about movies may watch far more than the ones who are not into movies, there are likely to be movies that the users have watched but not yet rated. Therefore, it is easier to accept that active users are more likely to give ratings to their unrated movies. These movie enthusiasts are selected based on the number of rated movies. Ratings of the unrated items (as the missing values in the new sub-matrix) would be predicted by matrix factorization algorithms. These new ratings are then added to the original matrix for generating better recommendations.
[image:5.576.309.531.71.246.2]of the original model because of the extensive selection of added ratings, especially when a large number of popular items or active users are selected in the sub-matrix.
3) ProposedESVD- Density-Oriented Approach
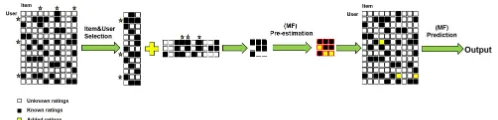
[image:6.576.35.284.340.400.2]So far an item-oriented approach and a user-oriented ap-proach are presented, both based on the idea that pre-estimating a set of selected ratings simultaneously for the matrix factorization model to learn. The rationale behind the pre-estimates is that they are predicted from a denser sub-matrix, which allows more accurate elicitations of the missing ratings. Typically the denser the matrix is, the better the matrix factorization model is obtained. For example with the Movielens 100Kdataset, the sub-matrix with5%of the most popular movies is of density29.47%in contrast to the orginal matrix (6.3%). On the other hand, the density of the new sub-matrix by choosing 5% of the most active users is 23.33%, which still much denser than the original one. Based on this observation, we propose a density-oriented approach, calledESVDas shown in Algorithm 1 and Figure 4), which combines the afore-mentioned item-oriented and user-oriented high density seeking strategies.
FIGURE 4: Procedures ofESVD
ESVDis based on the assumption that the recommender system was first built with a set of the most popular movies that are rated by a set of the most active users. Because item popularity depends on the number of ratings each user provides and user activity is related to the number of ratings each item receives, by choosing the N most popular items (columns) and the N0 most active users (rows), a much denser sub-matrix is obtained (as shown in Figure 4). Take theMovielens 100Kdataset as an example, the newly-formed sub-matrix would reach to77.28%density by selecting5%
of the most popular movies and5%of the most active users (Step 3 in Algorithm 1). The missing values in this sub-matrix can be explained as ratings of the most famous movies but have not been rated by a group of the most active users. Therefore, the recommendations generated by this recom-mender system should be of high accuracy. Afterwards some rare movies most people probably have not seen and users who provide very few ratings are added to the dataset (the orginal matrix), which could lower the prediction accuracy of the whole system. To achieve better performance, the ratings generated from the sub-recommender system (pre-estimates) could be used (by applying matrix factorization on the sub-matrix) as the known knowledge for further learning and inference. Finally an enhanced matrix factorization model can be obtained with higher accuracy by learning the existing
Algorithm 1 The Proposed ESVD (Density-Oriented Ap-proach)
Input: Rating matrixR ∈Rm×n, wherePi∈[1,m] ∈R1×n
is the row vector and Qj∈[1,n] ∈ Rm×1 is the column
vector;
T, test set in rating matrixR;
N, the number of items selected in the sub-matrix based on popularity;
N0, the number of users selected in the sub-matrix based on activity ;
Output: RMSEof the test setT;
Step 1: Sort both items j(1),j(2), ...,j(m) and users
i(1),i(2), ...,i(n)in the descending order based on popu-larity and activity, respectively;
Step 2: Create a sub-matrixM1 by selecting the top N
items (columns) of R based on the popularity such that
M1= [Qj(1),Qj(2), ....,Qj(N)](N <m);
Creat a sub-matrix M2 by selecting the top N0
user-s (rowuser-s) of R based on the activity such that M2 =
[Pi(1),Pi(2), ....,Pi(N0)](N0 <n);
Step 3: Create a sub-matrix M3 by selecting the
inter-section of the top N items (columns) and top N0 users (rows) based on the popularity and activity. Therefore,
M3=M1TM2;
Step 4: Apply basic matrix factorization (Regularized SVD) on matrixM3 to obtain feature matrices U andV
according to Equation (1). Then predict every missing value in sub-matrix M3 to acquire a non-null matrixM30
according to Equation (2). Then form a series of ratings
Lsuch thatL={rik(1),jt(1), ...,rik(n),jt(n0)}, whererik,jt ∈
(M3T¬κ);
Step 5: Fill the missing ratings in the original matrix R
with the value predicted inStep 4to acquire a new rating matrixR0. That means the extra ratings are added into the training setκ={κ,L};
Step 6: Apply basic matrix factorization (Regularized SVD) on matrixR0 to obtain feature matricesU0 andV0
according to Equation (1). Then predict the target ratings (test set) according to Equation (2) and calculateRMSEof the test setTaccording to Euqation (6);
and extra ratings.
C. EVALUATION
1) Experimental Setup
Experiments of the proposed algorithms (ESVD-I, ESVD-U and ESVD) are conducted on the classic recommender system datasets: Movielens 100K and the subset ofNetflix. Some experiments with the larger version are also performed and similar results are obtained. However, it requires much longer time to perform the experiments since the models are trained and tested each time for different choice of N
0 5% 10% 15% 20% 25% 30%
the percentage of items and users selected in the block matrix
0.96 0.97 0.98 0.99 1
RMSE
[image:7.576.48.271.67.174.2]ESVD ESVD-U ESVD-I
FIGURE 5:Movielens 100K:RMSEComparisons of the proposed methods based onRSVD. Note the results corresponding 0 percent-age in the plot is the results the the baseline RSVD.
more experiments so as to evaluate how these two parameters affect the results of the proposed algorithm.
Normally each dataset is partitioned into a training set and a test set. The model is trained on the training set and the quality of results is usually measured by theRoot Mean Square Error(RMSE) of the test set:
RMSE=
v u u t
P
({i,j}∈T estSet)
(rij −r˜ij) 2
T (6)
whereT represents the total number of(u,i)samples in the test set.RMSEis used as the default metric which is widely used in theNetfilxCompetition [4] and proved to be effective for measuring recommender systems.
The number of the latent factors (rank)k is a key factor for matrix factorization models. Increasingkwould result in better prediction at a higher computational cost. Here we set
k = 10for training each matrix factorization model in both datasets that balances the performance and training time. To learn the matrix factorization model from the sub-matrix, the regularization coefficientkuandkvin Equation (3) are set to
0.01 and 0.05 for theMovielens 100K andNetflixdatasets, respectively. The learning rateαin Equation (4) is set to 0.1 and is decreased by a factor of 0.9 each iteration for both datasets. To learn the matrix factorization model in the rating matrixR0(with pre-estimates), the regularization parameters
ku0andkv0are set to 0.1 for both datasets. The learning rates
αare set to 0.01 and 0.05 initially and allowed to decrease by a factor of 0.9 each iteration for theMovielens 100Kand
Netflixdatasets, respectively.
2) Experimental Results
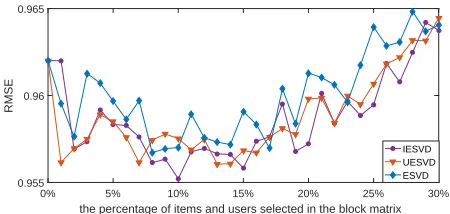
[image:7.576.306.529.67.175.2]We useESVD-I,ESVD-UandESVDto identify our methods proposed in Section III.B.1, III.B.2, and III.B.3, respectively. Figure 5 and Figure 6 show the results of the proposed methods based on the number of items and users selected (simply settingN = N0 in this case) in the sub-matrix on the Movielens 100K and Netflix datasets, respectively. All the methods start at 0 point where no extra filling is added into the learning process, which is the same asRSVD. It can be seen that the results ofESVD-I andESVD-Usometimes
0 5 10 15 20 25 30
the percentage of items and users selected in the block matrix
0.925 0.93 0.935 0.94
RMSE
ESVD ESVD-U ESVD-I
FIGURE 6:Netflix:RMSEComparisons of the proposed methods based onRSVD. Note the results corresponding 0 percentage in the plot is the results the the baseline RSVD.
are not promising. This is because the pre-estimates added to the training sets are either based only on item popularity (or user activity), which may lead bias and distort the latent factor model. For example, most people prefer movies with a happy ending, and hence popular movies always contain more comedies than tragedies. As a result, more ratings of comedy movies would be added to the learning process by the users, which leads to more weights added to the factor corresponding to comedies in the latent factor model (RSVD
[image:7.576.79.269.320.356.2]in this case) and deteriorate the performance. It is apparent from Figure 5 and Figure 6 that the proposed ESVD con-sistently outperforms other methods including the baseline method,RSVD.
TABLE 1: RMSE of ESVD on Movielens 100K (The Density-Oriented Approach)
Items&Users Sub-matrix Density Extra Ratings RMSE
0% null null 0.9709
5% 77.28% 897 0.9677
10% 65.20% 5496 0.9632
15% 53.90% 16381 0.9630
20% 45.66% 34508 0.9570
TABLE 2: RMSEofESVDonNetflix(The Density-Oriented Ap-proach)
Items&Users Sub-matrix Density Extra Ratings RMSE
0% null null 0.9306
5% 59.06% 3498 0.9265
10% 43.59% 19179 0.9265
15% 33.10% 51268 0.9291
20% 25.51% 101298 0.9319
Table 1 and Table 2 illustrate the experimental results of the proposed density-oriented (ESVD) approach on the
[image:7.576.306.530.424.484.2]sparser matrices may result in poor quality of pre-estimates, the quantity is increased as the size of the sub-matrix gets large. Therefore, more missing values can be pre-estimated by matrix factorization on the sub-matrix and put into the learning process of the original model. Because the sub-matrix of the ESVDapproach is the intersection of the N
items (item-oriented) andN0 users (user-oriented) with the largest number of ratings, its density is much greater than the ones used for ESVD-I and ESVD-U. Even with fewer ratings to be added compared withESVD-IandESVD-U, the performance is better.
In the experiments, it can be observed that for the Movie-lens 100K dataset, the performance of ESVDfluctuates as the number of users and items increases (Figure 5). While for theNetflixdataset (Figure 6), theRMSEofESVDdrops at first and then deteriorates (the lower RMSE the better performance) asNgoes up. This is mainly because theNetflix
dataset is much sparser than theMovielens 100Kdataset. As
Nincreases, more poor quality data is added into the learning process and leads to poorer performance (Figure 6). The optimal value forNthat balances the quality (density of sub-matrix) and the quantity (number of added ratings) depends on the distribution of ratings. For theMovielens 100Kdataset,
ESVDcan reach 0.9570 (whenN = 20%) which reduces the
RMSEby 0.0139 when compared with theRSVD0.9709. For the Netflix dataset, ESVDcan reduce theRMSE by 0.0047 from 0.9306 to 0.9259 whenN = 3%.
IV. PROPOSED MULTILAYER ESVD (MESVD)
[image:8.576.40.284.509.617.2]With ESVD, all the extra ratings are predicted in a single matrix factorization model simultaneously, which could lead to significant bias and distort the original model when the number of pre-estimates is large. To alleviate this problem a method called Multilayer ESVD (MESVD) is proposed, which obtains the fillings incrementally through multiple matrix factorization on different sub-matrices.
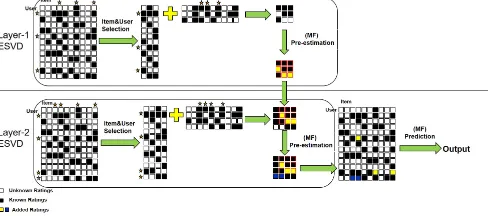
FIGURE 7: Procedures ofMultilayer ESVD
The example of a Two-layer ESVD is shown in Figure 7. First a set of sub-matrices are created in each layer by selecting the intersections of different numbers of columns and rows (as starred) based on the number of ratings each item received or each user provided, respectively. Therefore, each smaller sub-matrix (with red frame) in the upper layer can be seen as a part of the bigger sub-matrix in the lower
layer. The missing values (yellow ratings) in the smaller sub-matrix can be predicted by the sub-matrix factorization method and then be regarded as known ratings in the bigger sub-matrix. Similar to deep learning, the outputs generated by each layer are utilized as the inputs of the next layer, for enhancing the prediction accuracy of their outputs (pre-estimates). For example in Figure 7, the ratings in black and yellow are known in layer-2. Therefore, the sub-matrix in the next layer is much denser than the one without pre-estimates (the ratings in yellow) from the first layer. In this way fillings are predicted iteratively layer by layer. At last all the pre-estimated ratings are added to the original matrix to evaluate the performance of the whole system.
Basically, theMESVDapproach is based on the assump-tion that the recommender system is built by a very dense matrix with sufficient ratings first. Therefore, the recommen-dations (the missing values in the sub-matrix) were reliable and can be regarded as the known knowledge. After that, it is better to keep inviting the most active users to rate the most popular movies for the recommender system. In this way, each time a set of movies and users are added to the system, which generates knowledge iteratively for further learning and inference (from the upper layer to lower layer). As a result, better performance can be obtained by learning the current systems with extra knowledge generated in each of the sub-systems.
A. EXPERIMENTAL RESULTS
Experiments of theMESVDmethod on theMovielens 100K
and Netflixdatasets are also conducted. The corresponding results are shown in Table 3 and Table 4. For theMovielens 100K dataset, experiments of ESVD are conducted when
N =20%(optimal point),Two-layers ESVDwhere the first layer is 10% and the 2nd layer is20%, Four-layers ESVD
with layers from 5% to 20% with a 5% interval (setting
N = N0). Specifically, in the first experiment, ratings are predicted from the sub-matrix of density 45.66%. In Two-layers ESVD, the first 5496 ratings are predicted from the sub-matrix of density 65.20%, while the rest are calculat-ed from the sub-matrix of density 54.32%. In Four-layers ESVD, ratings are predicted successively, from where each time ratings are added based on a much denser matrix. Since we add the same amount of pre-estimates totally (34508) for each experiment, the sub-matrices in the final layers are the same correspondingly. However, the performance gets better from single layerESVDto Four-layersESVD, for the reason that the quality of pre-estimates gets better.
For the Netflix dataset, four experiments are performed:
TABLE 3:RMSEofMESVDonMovielens 100K
Item&User Sub-matrix Density Extra Ratings RMSE
RSVD N=0 0 0 0.9709
ESVD N=20% 45.66% 34508 0.9570
Two-layers ESVD N=[10%, 65.20% 5496
20%] 54.32% 29012 0.9564
Four-layers ESVD
N=[5%, 77.28% 897
10%, 70.88% 4599
15%, 69.37% 10885
[image:9.576.35.279.173.294.2]20%] 71.46% 18127 0.9561
TABLE 4:RMSEofMESVDonNetflix
Item&User Sub-matrix Density Extra Ratings RMSE
RSVD N=0 0 0 0.9306
ESVD N=10% 43.59% 19179 0.9265
Two-layers ESVD N=[5%,10%] 59.06%53.88% 156813498 0.9262
Four-layers ESVD
N=[2.5%, 67.04% 712
5%, 67.39% 2786
7.5%, 68.33% 6068
10%] 71.72% 9613 0.9248
Six-layers ESVD
N=[5%, 59.06% 3498
6%, 83.76% 1998
7%, 84.35% 2621
8%, 86.11% 3017
9%, 86.74% 3650
10%] 87.07% 4395 0.9255
ESVD than Two-layers ESVD. When compared Six-layers ESVDwithTwo-layers ESVD, the first batch of extra ratings are the same. However, the rest are of better quality because they are learnt layer by layer in the denser matrices. When comparedSix-layers ESVDwithFour-layers ESVD, although all the pre-estimates are learnt through more iterations, the first batch of extra ratings are of poorer quality. As a result, the performance ofSix-layers ESVDis not as good as Four-layers ESVD. In summary, although the optimal value for
N is not selected, better performance is obtained through
MESVDthanESVD.
Experimental results show that the quality of MESVD
depends on the number of layers and the choice of each layer. With the ESVD algorithm, decent result cannot be obtained if the number of items and users selected in the sub-matrixNis inappropriate. Through theMESVDmethod, this problem can be alleviated with comparable or better results. With optimal value for N, better performance can still be obtained by learning the extra ratings iteratively through the
MESVDmethod. The improvements of theMESVDapproach is limited, as the ratings added in the original matrix are the same when compared withESVDapproach. However, if the training time is not a concern,MESVDis preferable.
V. PROPOSED EXTENSIONS OF ESVD
Experimental results presented in the previous sections show that adding pre-estimates by applyingESVDdo improve the performance of the system. The reason behind is that the model is learnt by extra high quality ratings that are predicted from the dense sub-matrix based on item popularity and user activity. Based on this finding, we propose two extensions of
ESVDto deal with the datasets with a substantial imbalance between the number of users and the number of items.
A. PROPOSED ITEM-WISE ESVD (IESVD)
[image:9.576.296.545.184.250.2]When dealing with the rating matrix of which the number of users is far greater than the number of items, most items are rated by a significant number of users (popularity) but each user only rates a few items (activity) on average. Therefore, popular items have more impacts than active users on the density of the newly formed sub-matrix. As a result, obtain-ing a sub-matrix based on item popularity and user activity simultaneously is not appropriate under such circumstance.
FIGURE 8: Procedures ofItem-wise ESVD
TheItem-wise ESVD (IESVD)is proposed by first select-ing a number of most popular items to form a sub-matrix as theESVDAlgorithm does (Fig 8). Then, only the active users that have seen these specific movies (as starred) are chosen. In this way, a denser sub-matrix can be obtained than the one from theESVDmethod. Therefore, the missing values in the sub-matrix can be pre-estimated by the matrix factorization method. Finally, the predicted ratings are filled in the original matrix. Therefore, the new matrix factorization model is learnt and tested based on the newly formed rating matrix.
B. PROPOSED USER-WISE ESVD (UESVD)
Likewise, in the datasets consisting of far more items than users, the quantity of ratings each user rates (activity) is much greater than the quantity of ratings each item is rated (popu-larity) on average. Therefore, theUser-wise ESVD(UESVD) is proposed as shown in Fig 9. Initially, a number of most active users are selected to form a sub-matrix based on the number of ratings each user has rated. Then the most popular items that the active users have seen are chosen to form the sub-matrix, i.e. the items with most ratings in the sub-matrix only. As a result, a denser sub-matrix is obtained than the one fromESVD. The rest procedures are the same as theESVD
algorithm.
FIGURE 9: Procedures ofUser-wise ESVD
[image:9.576.303.545.599.653.2]theIESVDandUESVDalgorithms, the sub-matrices selected based on few items and users are not necessarily included in the larger sub-matrices consisting of more items and users.
C. EXPERIMENTAL RESULTS
To emphasize the merits of the proposedIESVDandUESVD
approaches, the following two subsets are extracted from
Movielens 1Mto make the size similar to theMovielens 100K
dataset in the experiments:
1) MI (6040×263): This dataset contains ratings for 263 movies randomly selected from 3,952 movies provided by 6,040 users.
2) MU (401 ×3952): This dataset contains ratings for 3,952 movies provided by 401 users randomly selected from 6,040 users.
Likewise, the following two subsets are also extracted from the original Netflix dataset to make the size equal to theNetflixsubset for comparative purpose.
1) NI (6800×500): This dataset contains ratings for 500 randomly selected movies provided by 6,800 users. 2) NU (955 ×3561): This dataset contains ratings for
3,561 randomly selected movies provided by 955 user-s.
Experiments of the proposedIESVD,UESVDapproaches are conducted on theMovielens 1Msubsets (MIandMU) and
[image:10.576.304.532.73.290.2]Netflixsubsets (NIandNU). The details are shown in Table 5.
TABLE 5: Experimental datasets
Dataset Size Number of ratings Density
MI 6040×263 59005 3.72%
MU 401×3952 70923 4.46%
NI 6800×500 105444 3.10%
NU 955×3561 110818 3.26%
Table 6 to Table 9 show some experimental details of proposed methods on the datasets including the number of selected items and users (N =N0= 10%for theMovielens 1M subsets MI, MU andN = N0 = 5% for the Netflix
subsets NI, NU), the density of sub-matrix, the number of added ratings and the results of different algorithms on the corresponding datasets.
It can be observed that for the datasets of which the number of users is far greater than the number of items (i.e. MI
andNI),IESVDcould obtain denser sub-matrices. While for datasets with far more items than users (i.e. MUandNU), the density of the sub-matrices produced by UESVD are greater. However, the number of extra ratings predicted from the denser matrix is less than that from the sparser sub-matrices. Therefore, it is inappropriate to compare the results of different algorithms based on the certain number of items and users N. As a result, the best performance (with least
RMSE) of the proposed algorithms are listed based on the best choices ofN (settingN =N0).
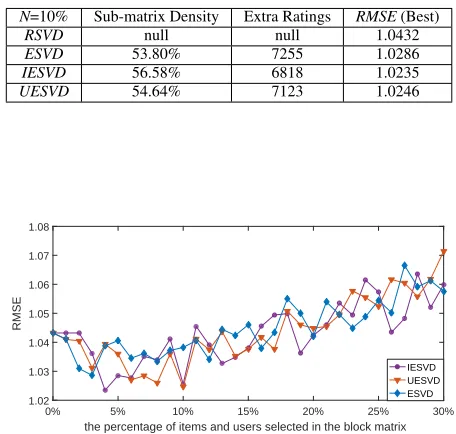
TABLE 6: Comparison of the proposed methods onMI(6040×263)
N=10% Sub-matrix Density Extra Ratings RMSE(Best)
RSVD null null 1.0432
ESVD 53.80% 7255 1.0286
IESVD 56.58% 6818 1.0235
UESVD 54.64% 7123 1.0246
0% 5% 10% 15% 20% 25% 30% the percentage of items and users selected in the block matrix 1.02
1.03 1.04 1.05 1.06 1.07 1.08
RMSE
IESVD UESVD ESVD
[image:10.576.304.531.385.598.2]FIGURE 10:RMSEof the proposed methods onMI(6040×263)
TABLE 7: Comparison of the proposed methods on MU(401×
3952)
N=10% Sub-matrix Density Extra Ratings RMSE(Best)
RSVD null null 0.9898
ESVD 57.52% 6712 0.9791
IESVD 58.52% 6554 0.9749
UESVD 58.80% 6509 0.9802
0% 5% 10% 15% 20% 25% 30% the percentage of items and users selected in the block matrix 0.975
0.98 0.985 0.99
RMSE
IESVD UESVD ESVD
FIGURE 11:RMSEof the proposed methods onMU(401×3952)
TABLE 8: Comparison of the proposed methods onNI(6800×500)
N=5% Sub-matrix Density Extra Ratings RMSE(Best)
RSVD null null 0.9620
ESVD 59.31% 3459 0.9567
IESVD 66.36% 2859 0.9552
[image:10.576.56.257.435.487.2]0% 5% 10% 15% 20% 25% 30% the percentage of items and users selected in the block matrix 0.955
0.96 0.965
RMSE
[image:11.576.45.270.65.172.2]IESVD UESVD ESVD
[image:11.576.44.271.233.417.2]FIGURE 12:RMSEof the proposed methods onNI(6800×500)
TABLE 9: Comparison of the proposed methods on NU(955×
3561)
N=5% Sub-matrix Density Extra Ratings RMSE(Best)
RSVD null null 0.9439
ESVD 62.54% 2038 0.9400
IESVD 68.18% 1717 0.9392
UESVD 68.79% 1684 0.9376
0% 5% 10% 15% 20% 25% 30% the percentage of items and users selected in the block matrix 0.94
0.945 0.95
RMSE
IESVD UESVD ESVD
FIGURE 13:RMSEof the proposed methods onNU(955×3561)
Figure 10 to Figure 13 show the performance (RMSE) of the proposed methods with respect to the percentage of items and users (settingN = N0) selected in the sub-matrices on
MI,MU,NI,NUdatasets, respectively. It can be seen from the figures all the algorithms start fromN =N0 = 0, where no extra ratings are added into the original matrix. This can be seen as the special case ofRSVD. As the number of items and users selected in the sub-matrixN goes up, the performance fluctuates. WhenN is getting large, excessive ratings distort the model and the performance deteriorates. Therefore, the best choices forN that lead to the leastRMSEare compared. It can be observed that when dealing with the datasetsMIand
NIwhere the number of user is far greater than the number of items,IESVDyields a denser sub-matrix than theUESVD
method. When the datasets contain more items than users (MU,NU),UESVDperforms better thanIESVD.
VI. CONCLUSION
The lack of information is an acute challenge in most recom-mender systems. In this paper, we propose a series of meth-ods, which apply the traditional matrix factorization method that best approximates a given matrix with missing values. Specifically, the general EVSD model is firstly proposed by seeking high density through popular items and active
users in a special manner inspired by active learning. The corresponding experimental results show its feasibility. The proposedEVSDmodel is further extended into theMESVD
approach, which learns the model iteratively. The MESVD
approach can achieve better performance thanESVDat the expense of higher computational complexity. In addition, two variants of ESVD model are proposed: IESVD and
UESVD. Although the multilayer learning strategy (adopt-ed by MESVD) is not applicable to IESVD and UESVD, their performance are better than ESVDwhen dealing with datasets with imbalanced number of items and users. Instead of viewing active learning from the individual user’s point of view, the proposed methods deal with the problem from the system’s perspective in a more realistic and effective manner. Although the proposed methods cannot deal with the cold start problem, where the database keeps growing as new users or items continue to be added, it does reduce the computational cost greatly since all the ratings are added simultaneously (ESVD,IESVDandUESVD) or iteratively by a predefined number of iterations (MESVD).
REFERENCES
[1] A. S. Das, M. Datar, A. Garg, and S. Rajaram, “Google news personal-ization: scalable online collaborative filtering,” in Proceedings of the 16th international conference on World Wide Web. ACM, 2007, pp. 271–280. [2] E.-A. Baatarjav, S. Phithakkitnukoon, and R. Dantu, “Group recommenda-tion system for facebook,” in On the Move to Meaningful Internet Systems: OTM 2008 Workshops. Springer, 2008, pp. 211–219.
[3] G. Linden, B. Smith, and J. York, “Amazon.com recommendations: Item-to-item collaborative filtering,” vol. 7, no. 1. IEEE, 2003, pp. 76–80. [4] J. Bennett, S. Lanning et al., “The netflix prize,” in Proceedings of KDD
cup and workshop, vol. 2007. New York, NY, USA, 2007, p. 35. [5] J. Schafer, D. Frankowski, J. Herlocker, and S. Sen, “Collaborative filtering
recommender systems,” The adaptive web, pp. 291–324, 2007. [6] P. Lops, M. De Gemmis, and G. Semeraro, “Content-based recommender
systems: State of the art and trends,” in Recommender systems handbook. Springer, 2011, pp. 73–105.
[7] S. Trewin, “Knowledge-based recommender systems,” Encyclopedia of library and information science, vol. 69, no. Supplement 32, p. 180, 2000. [8] R. Burke, “Hybrid recommender systems: Survey and experiments,” User modeling and user-adapted interaction, vol. 12, no. 4, pp. 331–370, 2002. [9] G. Adomavicius and A. Tuzhilin, “Toward the next generation of recom-mender systems: A survey of the state-of-the-art and possible extensions,” IEEE transactions on knowledge and data engineering, vol. 17, no. 6, pp. 734–749, 2005.
[10] J. S. Breese, D. Heckerman, and C. Kadie, “Empirical analysis of pre-dictive algorithms for collaborative filtering,” in Proceedings of the Four-teenth conference on Uncertainty in artificial intelligence. Morgan Kaufmann Publishers Inc., 1998, pp. 43–52.
[11] B. Sarwar, G. Karypis, J. Konstan, and J. Riedl, “Item-based collaborative filtering recommendation algorithms,” in Proceedings of the 10th interna-tional conference on World Wide Web. ACM, 2001, pp. 285–295. [12] R. M. Bell and Y. Koren, “Scalable collaborative filtering with jointly
derived neighborhood interpolation weights,” in Data Mining, Seventh IEEE International Conference on. IEEE, 2007, pp. 43–52.
[13] T. Hofmann, “Latent semantic models for collaborative filtering,” ACM Transactions on Information Systems (TOIS), vol. 22, no. 1, pp. 89–115, 2004.
[14] R. Salakhutdinov and A. Mnih, “Probabilistic matrix factorization.” in Nips, vol. 1, no. 1, 2007, pp. 2–1.
[15] S. Rendle, “Factorization machines with libfm,” ACM Transactions on Intelligent Systems and Technology (TIST), vol. 3, no. 3, p. 57, 2012. [16] Y. Koren, “Factorization meets the neighborhood: a multifaceted
[17] A. Paterek, “Improving regularized singular value decomposition for col-laborative filtering,” in Proceedings of KDD cup and workshop, vol. 2007, 2007, pp. 5–8.
[18] X. Guan, C.-T. Li, and Y. Guan, “Enhanced svd for collaborative filtering,” in Pacific-Asia Conference on Knowledge Discovery and Data Mining. Springer, 2016, pp. 503–514.
[19] Y. Koren, R. Bell, and C. Volinsky, “Matrix factorization techniques for recommender systems,” Computer, no. 8, pp. 30–37, 2009.
[20] X. Su and T. M. Khoshgoftaar, “A survey of collaborative filtering tech-niques,” Advances in artificial intelligence, vol. 2009, p. 4, 2009. [21] N. Rubens, M. Elahi, M. Sugiyama, and D. Kaplan, “Active learning in
recommender systems,” in Recommender systems handbook. Springer, 2015, pp. 809–846.
[22] M. Elahi, F. Ricci, and N. Rubens, “A survey of active learning in collaborative filtering recommender systems,” Computer Science Review, vol. 20, pp. 29–50, 2016.
[23] A. S. Harpale and Y. Yang, “Personalized active learning for collaborative filtering,” in Proceedings of the 31st annual international ACM SIGIR conference on Research and development in information retrieval. ACM, 2008, pp. 91–98.
[24] R. Jin and L. Si, “A bayesian approach toward active learning for collab-orative filtering,” in Proceedings of the 20th conference on Uncertainty in artificial intelligence. AUAI Press, 2004, pp. 278–285.
[25] M. Elahi, F. Ricci, and N. Rubens, “Active learning strategies for rating elicitation in collaborative filtering: a system-wide perspective,” ACM Transactions on Intelligent Systems and Technology (TIST), vol. 5, no. 1, p. 13, 2013.
[26] B. N. Miller, I. Albert, S. K. Lam, J. A. Konstan, and J. Riedl, “Movielens unplugged: experiences with an occasionally connected recommender system,” in Proceedings of the 8th international conference on Intelligent user interfaces, 2003, pp. 263–266.
[27] B. Sarwar, G. Karypis, J. Konstan, and J. Riedl, “Analysis of recom-mendation algorithms for e-commerce,” in Proceedings of the 2nd ACM conference on Electronic commerce. ACM, 2000, pp. 158–167. [28] S. Funk, “Netflix update: Try this at home,” 2006.
[29] R. Gemulla, E. Nijkamp, P. J. Haas, and Y. Sismanis, “Large-scale matrix factorization with distributed stochastic gradient descent,” in Proceedings of the 17th ACM SIGKDD international conference on Knowledge dis-covery and data mining. ACM, 2011, pp. 69–77.
[30] A. M. Rashid, I. Albert, D. Cosley, S. K. Lam, S. M. McNee, J. A. Konstan, and J. Riedl, “Getting to know you: learning new user preferences in recommender systems,” in Proceedings of the 7th international conference on Intelligent user interfaces. ACM, 2002, pp. 127–134.
[31] N. Golbandi, Y. Koren, and R. Lempel, “On bootstrapping recommender systems,” in Proceedings of the 19th ACM international conference on Information and knowledge management. ACM, 2010, pp. 1805–1808. [32] B. M. Marlin, R. S. Zemel, S. T. Roweis, and M. Slaney, “Recommender
systems, missing data and statistical model estimation.” in IJCAI, 2011, pp. 2686–2691.
[33] G. Carenini, J. Smith, and D. Poole, “Towards more conversational and collaborative recommender systems,” in Proceedings of the 8th interna-tional conference on Intelligent user interfaces. ACM, 2003, pp. 12–18.
Xin Guanreceived the B.S. degree in information and computing science from the China Univer-sity of Mining and Technology, Beijing, China, in 2011, and the M.S. degree in financial math-ematics and computation from the University of Leicester, Leicester, UK, in 2012. He is currently working toward the Ph.D. degree with the De-partment of Computer Science, University of War-wick, Coventry, UK. His research interests include machine learning, data mining and recommenda-tion systems.
Chang-Tsun Lireceived the BEng degree in elec-trical engineering from National Defence Univer-sity (NDU), Taiwan, in 1987, the MSc degree in computer science from U.S. Naval Postgraduate School, USA, in 1992, and the PhD degree in computer science from the University of Warwick, UK, in 1998. He was an associate professor of the Department of Electrical Engineering at NDU during 1998-2002 and a visiting professor of the Department of Computer Science at U.S. Naval Postgraduate School in the second half of 2001. He was a professor of the Department of Computer Science at the University of Warwick, UK, until Dec 2016. He is currently a professor of the School of Computing and Mathematics, Charles Sturt University, Australia, leading the Data Science Research Unit. His research interests include multimedia forensics and security, biometrics, data mining, machine learning, data analytics, computer vision, image processing, pattern recognition, bioinformatics, and content-based image retrieval. The outcomes of his multimedia forensics and ma-chine learning research have been translated into award-winning commercial products protected by a series of international patents and have been used by a number of police forces and courts of law around the world. He is currently Associate Editor of the EURASIP Journal of Image and Video Processing (JIVP) and Associate of Editor of IET Biometrics. He involved in the organisation of many international conferences and workshops and also served as member of the international program committees for several international conferences. He is also actively contributing keynote speeches and talks at various international events.


![Protocol for the immediate delivery versus expectant care of women with preterm prelabour rupture of the membranes close to term (PPROMT) Trial [ISRCTN44485060]](data:image/gif;base64,R0lGODlhAQABAIAAAP///wAAACH5BAEAAAAALAAAAAABAAEAAAICRAEAOw==)